1. Introduction
A large quantity of the textile effluent characterized by intense color and high organic load is generated in textile industry, which can cause severe damage to human health and ecological environment [1]. The mainstream treatment process of industrial textile effluent is the physic-chemical method followed by biological treatment and separation technology [2]. Chemical oxygen demand (COD) refers to the amount of oxidant consumed when the reducing substances in water are oxidized and decomposed, expressed in mg LŌłÆ1. However, the refractory organics cause a certain COD in the textile effluent after the biological treatment, which increases the treatment load in the following separation technology [3]. It is of significance to reduce the COD of textile effluent after biological treatment in order to meet the discharge limits of textile effluent [4,5].
Physical treatments are usually applied in the pretreatment of the textile effluent, such as coagulation sedimentation technology and Fenton oxidation technology [6]. The biodegradable organics can be effectively degraded by biological methods, which requires certain biodegradability of the textile effluent [7]. The sand filtering and the membrane filtering are usually used the terminal treatment of textile effluent [8,9]. However, the sand filter after adsorption saturation requires subsequent processing as solid waste and the membrane filtering is still faced with the membrane fouling problem caused by the organics in the textile effluent [10].
Electrochemical degradation has been widely investigated based on the oxidation of pollutants by hydroxy radical (OH┬Ę) generated, which has been applied in the treatment of textile effluent [11]. So far, tank electrolyzers have been widely used in then the treatment of textile effluent [12]. The tube electrolyzer with high mass transfer efficiency and compact structure is regarded as a potential electrolyzer type for the electrochemical degradation [13]. Electrode materials play a significant role in the performance of the electrochemical degradation, such as PbO2 electrode, Ti/RuO2ŌĆōIrO2 electrode and boron-doped diamond (BDD) electrode [14ŌĆō16]. PbO2 electrode with good electrocatalytic performance and low cost has been applied in the industrialized treatment of the textile effluent [17].
The electrolyte solution was usually circulated between the electrolyzer and the electrolyte reservoir during the related electrochemical degradation research of textile effluent. However, the textile effluent often flows into the electrolyzer and then flow out of electrolyzer for the following treatment process in the industrially electrochemical treatment [18]. WhatŌĆÖs more, textile effluent can flow though several electrolyzers one after another or repeatedly flow into the electrolyzer to further electrochemically degrade the organics.
In order to tackle global climate change, carbon neutrality has been paid more and more attention in the development of wastewater treatment [19]. The accounting of carbon emissions can play an important role in the carbon neutrality, which would be a research focus in the textile effluent treatment [20]. In addition, the accounting of carbon emissions should be considered as a performance parameter for the electrochemical degradation of textile effluent [21]. As for the textile effluent with the initial COD of 56.0 mg LŌłÆ1 obtained at the outflow of the sedimentation after the biological treatment from a textile effluent treatment plant, the PbO2 plate electrode showed a good performance of the electrochemical degradation of in a laboratory tank electrolyzer in our previous study [22].
Therefore, electrochemical degradation was utilized to treat the textile effluent after the biological treatment using the commercial PbO2 mesh cylinder electrode as the anode in the tube electrolyzer in the present study. The electrochemical degradation conditions of the textile effluent were optimized with COD, the current efficiency, the energy consumption and the carbon emissions investigated in the different initial pH, electrolyte flow rates, current densities and times of the electrochemical degradation.
2. Experimental
2.1. Materials and chemicals
The commercial PbO2 cylinder electrode was purchased from Shaanxi Utron Environmental Protection Technology Co., Ltd. PbO2 was electrodeposited on the cylinder titanium mesh with the mesh of 5, where the thickness of its PbO2 film was 0.5 mm. The diameter of the PbO2 cylinder electrode was 40 mm with the height of 680 mm. The cylinder titanium electrode as the cathode was purchased from Shanxi Utron Environmental Protection Technology Co., Ltd. The diameter of the cylinder titanium electrode was 70 mm with the thickness of 2 mm. Sulfuric acid (H2SO4) and sodium hydroxide (NaOH) were of analytical grade and purchased from Weisi (Beijing) Experimental Supplies Co., Ltd.
The textile effluent after the biological treatment was obtained from a textile enterprise in Zhejiang province. The composition of textile effluent was complex because the effluent originated from the different textile processes. The same collected textile effluent was used in the present study to avoid compositional and concentration variations. Some physico-chemical characteristics of the textile effluent was shown in Table 1.
2.2. Experimental apparatus
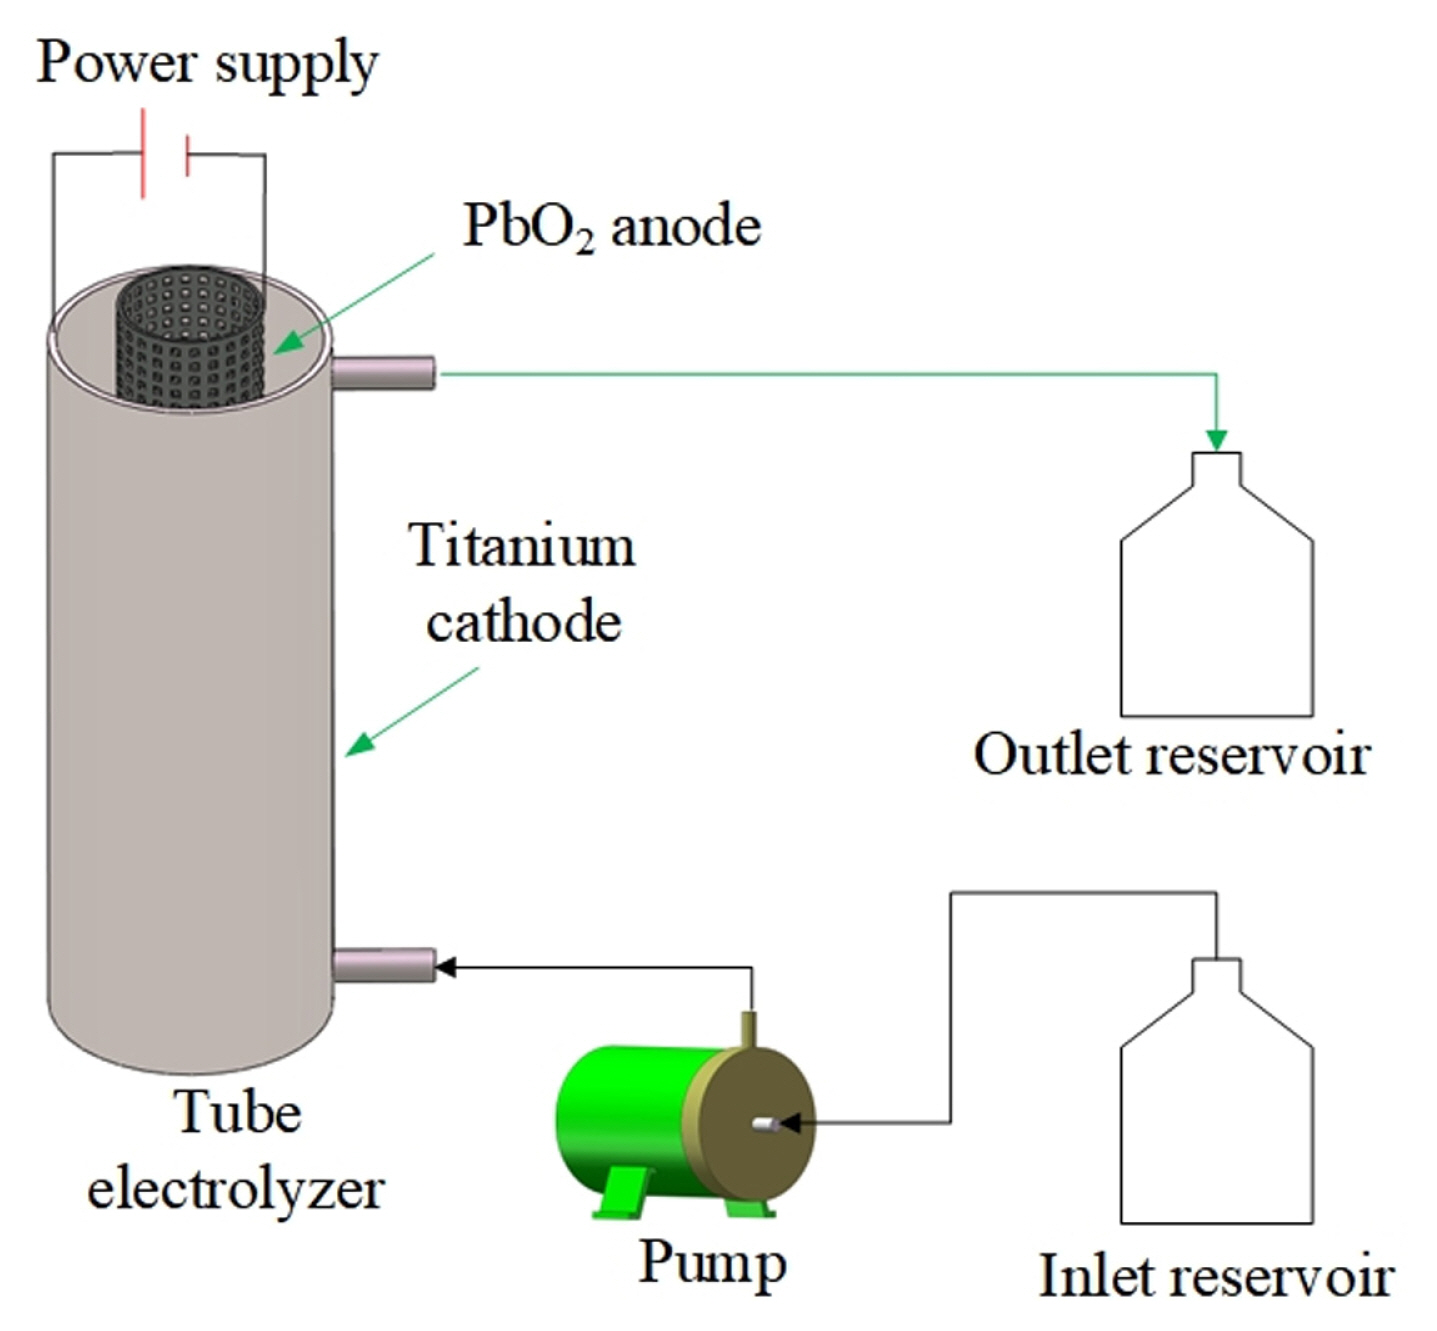
As shown in Fig. 1, the diagram of the experimental apparatus for the electrochemical degradation of the textile effluent consists of a self-made tube electrolyzer, a DC power supply (JK3060K) from Shenzhen Junke Instrument Technology Co., Ltd, and a magnetic pump (MP-10R) from Shanghai Xinxishan Bengye Co., Ltd. The PbO2 anode was utilized as the anode paired with the titanium cathode was located in the center of the tube electrolyzer. The interelectrode gap between the PbO2 anode and the titanium cathode was 13 mm. The PVC cylinder with the diameter of 12 mm was located in the center of the PbO2 anode.
2.3. Experimental design
All electrochemical experiments were conducted using the constant current density method. The electrolyte solution was continually pumped from the inlet reservoir to the tube electrolyzer and then flowed into the outlet reservoir when the initial pH, the electrolyte flow rates and the current densities were optimized. For the electrochemical degradation of the textile effluent one more time, the degraded textile effluent was pumped from the inlet reservoir to the tube electrolyzer for the electrochemical degradation again and then flowed into the outlet reservoir. The initial electrochemical reaction in the electrolyzer was operated at the electrolyte flow rate of 1.5 L minŌłÆ1 and the temperature from 30 to 35┬░C. The pH of the textile effluent was adjusted by the 0.1 mol LŌłÆ1 H2SO4 solution and the 0.1 mol LŌłÆ1 NaOH solution. The analysis samples were extracted at the electrolyzer outlet when each experiment was finished.
2.4. Analytical methods
The COD of each sample was measured by a spectrophotometer (DR3900, Hach, USA).
Current efficiency (╬Ę, %) that presents the utilization rate of the charge applied for electrochemical degradation, is calculated using Eq. (1):
where CODt and COD0 are the COD of textile effluent after electrolysis and before electrolysis, respectively, mg LŌłÆ1; F is the Faraday constant, 96485 C mo LŌłÆ1; v is the electrolyte flow rate, L minŌłÆ1; I is the working current, A; t is the total time when the constant current density is applied, s.
The energy consumption per kilogram of the COD for the textile effluent (We, kWh kgŌłÆ1) is calculated using Eq. (2):
where U is the cell voltage, V.
Corresponding to the energy consumption of the tube electrolyzer, the energy consumption per kilogram of the COD for the magnetic pump (Wm, kWh kgŌłÆ1) is calculated using Eq. (3):
where P is the power of the magnetic pump, 10 W.
There was not other heat energy used in the present experiments except for the electric power. Therefore, the carbon emissions per kilogram of the COD for the textile effluent (CE, kg CO2 kgŌłÆ1 COD) is accounted using Eq. (4):
where fe is the electricity emissions factor published in China in 2023, 0.5703 kg CO2 kWhŌłÆ1.
3. Results and Discussion
3.1. The effect of initial pH on electrochemical performance
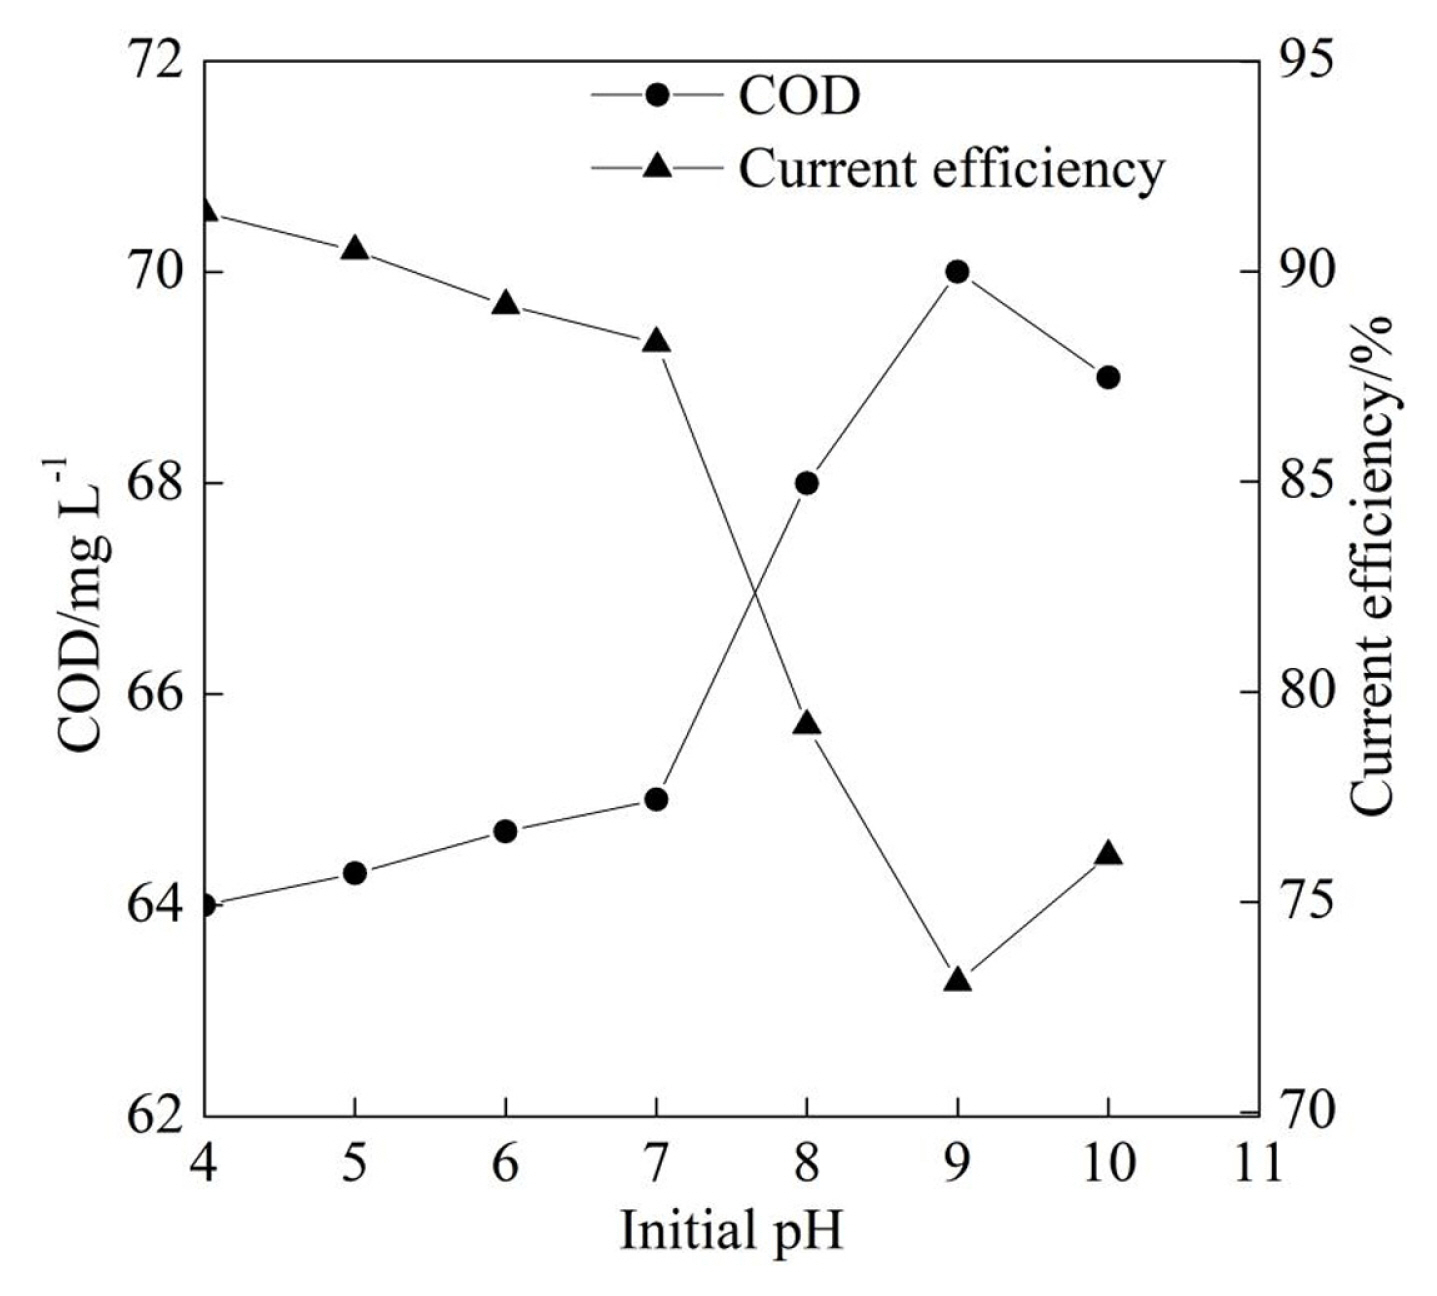
As shown in Fig. 2, the COD of the textile effluent gradually increased when the initial pH increased from 4.0 to 9.0 at the electrolyte flow rate of 1.5 L minŌłÆ1 and the current density of 10.0 mA cmŌłÆ2. The COD and the current efficiency at the original pH of 7.6 for the textile effluent were 65.0 mg LŌłÆ1 and 88.3%, respectively. The direct degradation of contaminants and the producing hydroxyl radicals (┬ĘOH) occurred on the PbO2 anode, which occurred at different pH conditions. As was shown in Table 1, there existed ClŌłÆ and SO4 2ŌłÆ in the textile effluent. The electrosynthesis of persulfate ion (S2O8 2ŌłÆ), the oxygen evolution reaction and the chlorine (Cl2) production reaction occurred at the anode. The reaction in the cathode was the hydrogen evolution. In acid electrolyte solution, reactions that occurred at the anode and cathode were as follows:
In alkaline electrolyte solution, reactions that occurred at the anode and cathode were as follows:
The same electrosynthesis reaction of persulfate ion in the anode occurs at different pH. The oxygen evolution on the anode and the hydrogen evolution in the cathode in the acid electrolyte solution with the pH below 7 were different from those with the pH above 7. Sulfuric acid (H2SO4) and sodium hydroxide (NaOH) were used to adjust the initial pH. Compared with the chlorine production reaction at pH below 7, HClO was generated by the reaction of Cl2 and OHŌłÆ at pH above 7.
The part of organics in the contaminants could be degraded into CO2, N2 and H2O with O2 evolution at the anode. The NH3ŌĆōN in the textile effluent was degraded to NH3 mainly by ┬ĘOH generated at the anode at first and then degraded to N2 and H2O by the ┬ĘOH [23]. Therefore, O2, Cl2, CO2, N2 and NH3 were expected to come out in the anode when the hydrogen was generated in the cathode. The gas generated in the anode and the hydrogen in the cathode flew though the same outlet out of the tube electrolyzer.
As was shown in Table 1, there existed Na+, ClŌłÆ and SO4 2ŌłÆ in the textile effluent. Therefore H+, Na+, ClŌłÆ and SO4 2ŌłÆ migrated between anode and cathode in acid electrolyte solution at pH below 7 while OHŌłÆ, Na+, ClŌłÆ and SO4 2ŌłÆ migrated between anode and cathode at pH above 7.
The low pH could contribute to the promotion of the direct degradation on the PbO2 anode and the hydroxyl radicals by indirect degradation reactions for the textile effluent [24]. In addition, the oxidizing specie, SO4 2ŌłÆ┬Ęcould be generated on the PbO2 anode surface at the low pH with the presence of sulfate ions, which was beneficial to improve the degradation efficiency of the textile effluent [25]. Besides, the oxygen evolution in the anode was enhanced with the increase of the electrolyte solution pH, which could cause the reduction of the effective electrochemical degradation area on the anode surface.
In the meantime, it could be seen from Fig. 2 that the COD of the textile effluent slightly reduced with the initial pH from 9.0 to 10.0, which was caused by the increase of the electrolyte solution conductivity. As shown in Fig. 2, the current efficiency gradually reduced with the initial pH from 4.0 to 9.0 and then slightly increased with the initial pH from 9.0 to 10.0. The change trend of current efficiency shown in Fig. 2 was in accordance with that analyzed by Eq. (1). Taking account of the cost of the H2SO4 solution and the NaOH solution in the industrial application, the initial pH of 7.6 was selected for the following experiments to reduce the cost of the H2SO4 solution and the NaOH solution added into the textile effluent in the industry.
3.2. The effect of electrolyte flow rate on electrochemical performance
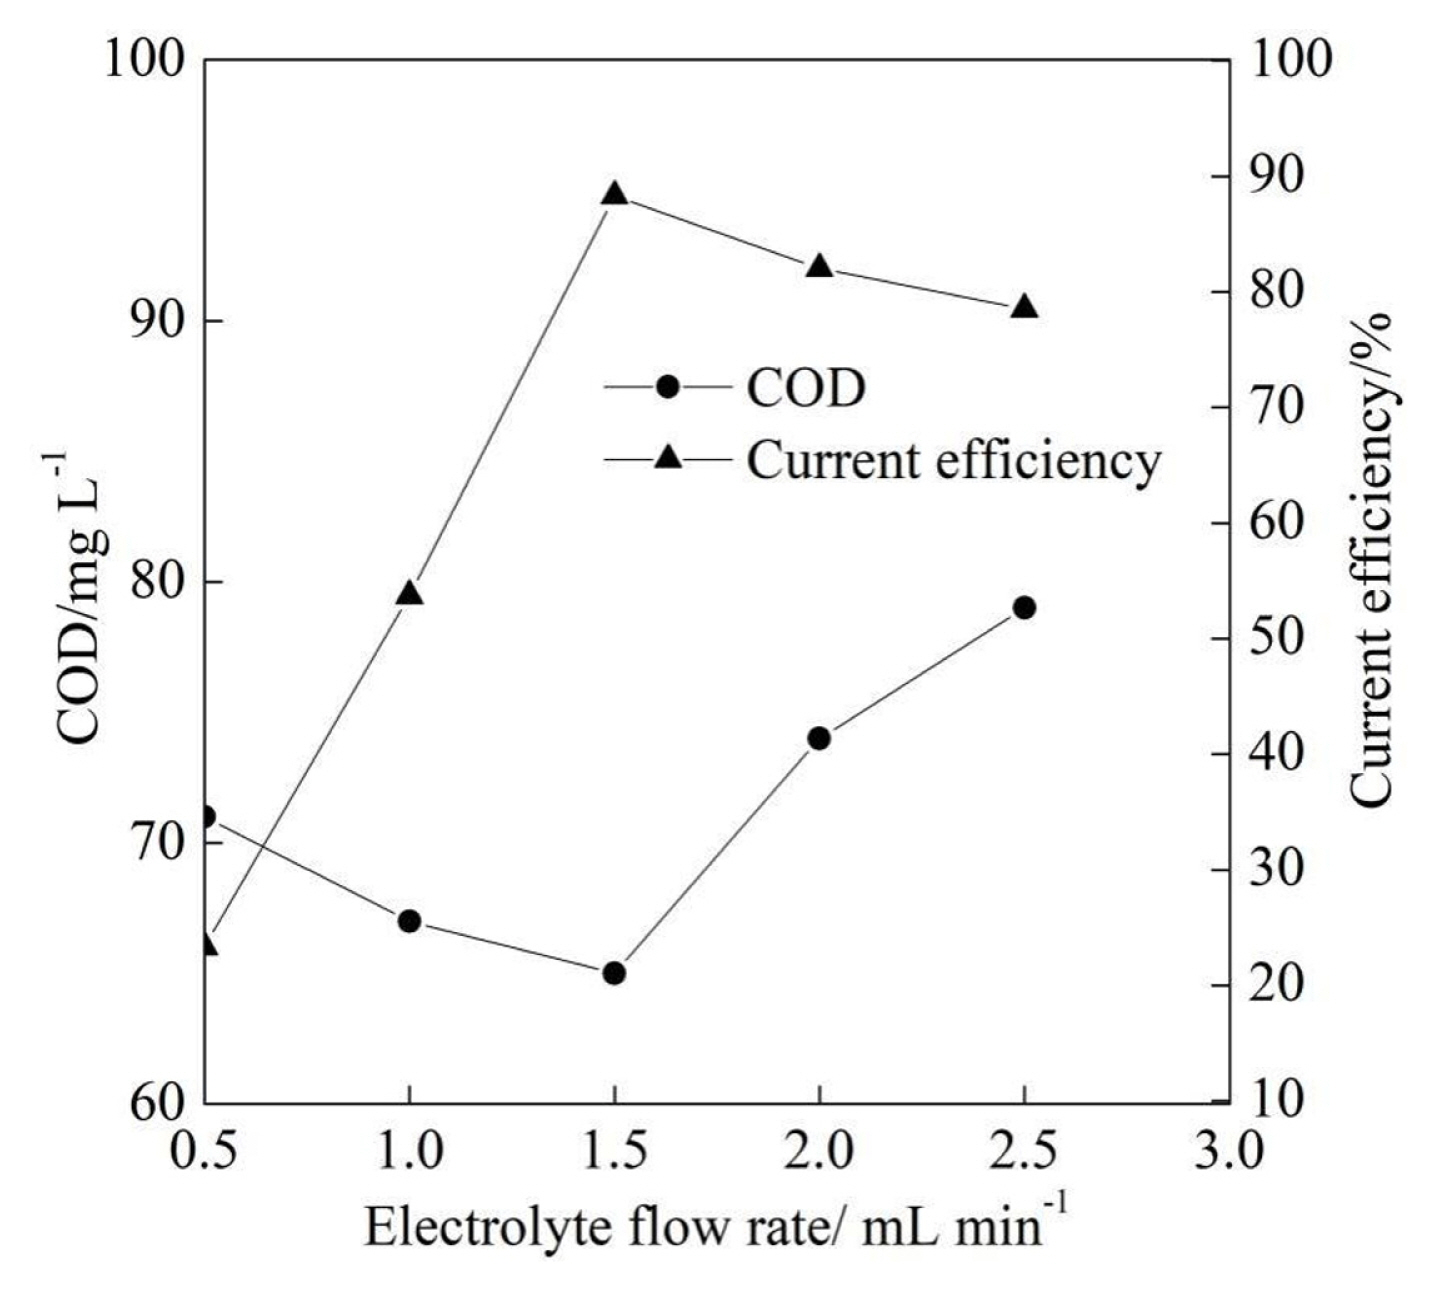
Fig. 3 demonstrates the COD and the current efficiency of the textile effluent at different electrolyte flow rates with the current density of 10.0 mA cmŌłÆ2 and the initial pH of 7.6. It can be seen from Fig. 3 that the COD after the electrochemical degradation gradually reduced at first and then increased with the increase of the electrolyte flow rate from 0.5 L minŌłÆ1 to 2.5 L minŌłÆ1. The COD reached its minimum of 65.0 mg LŌłÆ1 at the electrolyte flow rate of 1.5 L minŌłÆ1. The mass transfer was gradually enhanced when the electrolyte flow rate increased from 0.5 L minŌłÆ1 to 1.5 L minŌłÆ1 which was beneficial for the COD degradation. When the electrolyte flow rate was beyond the 1.5 L minŌłÆ1, the part of the textile effluent flowed out of the electrolyzer without electrochemical degradation because the electrolyte flow rate was beyond the maximum electrochemical oxidation rate on the PbO2 anode surface.
In addition, Fig. 3 illustrated that the current efficiency gradually increased at first and then reduced with the increase of the electrolyte flow rate from 0.5 L minŌłÆ1 to 2.5 L minŌłÆ1, which was influenced by the change trend of the COD. Although the increase of the electrolyte flow rate could enhance the mass transfer between the electrolyte and the anode surface improving the current efficiency to a certain extent, the reduction of the current efficiency was attributed to the degraded COD according to Eq. (1). Moreover, the current efficiency reached its maximum of 88.3% at electrolyte flow rate of 1.5 L minŌłÆ1. Therefore, the electrolyte flow rate of 1.5 L minŌłÆ1 was selected for the following experiments.
3.3. The effect of current density on electrochemical performance
Fig. 4 and Fig. 5 show the electrochemical performance of the textile effluent degradation with the current density ranged from 5.0 mA cmŌłÆ2 to 25.0 mA cmŌłÆ2 at the initial pH of 7.6 and the electrolyte flow rate of 1.5 L minŌłÆ1. As shown in Fig. 4, the COD gradually dropped from 82.4 mg LŌłÆ1 to 52.1 mg LŌłÆ1 with the increase of the current density from 5.0 mA cmŌłÆ2 to 25.0 mA cmŌłÆ2, which was due to the improvement of the electrochemical degradation rate of the COD on the anode surface with the increase of the current density. It can be seen from Fig. 4 that the current efficiency increased when the current density increased from 5.0 mA cmŌłÆ2 to 10.0 mA cmŌłÆ2, which was caused by the improvement of electrochemical degradation rate with increase of the current density. As shown in Fig. 5, the current efficiency gradually decreased with the current density from 10.0 mA cmŌłÆ2 to 25.0 mA cmŌłÆ2, which was attributed to the enhancement of the oxygen evolution reaction and the reduction of the effective electrochemical oxidation spots on the PbO2 anode with further increase of the current density.
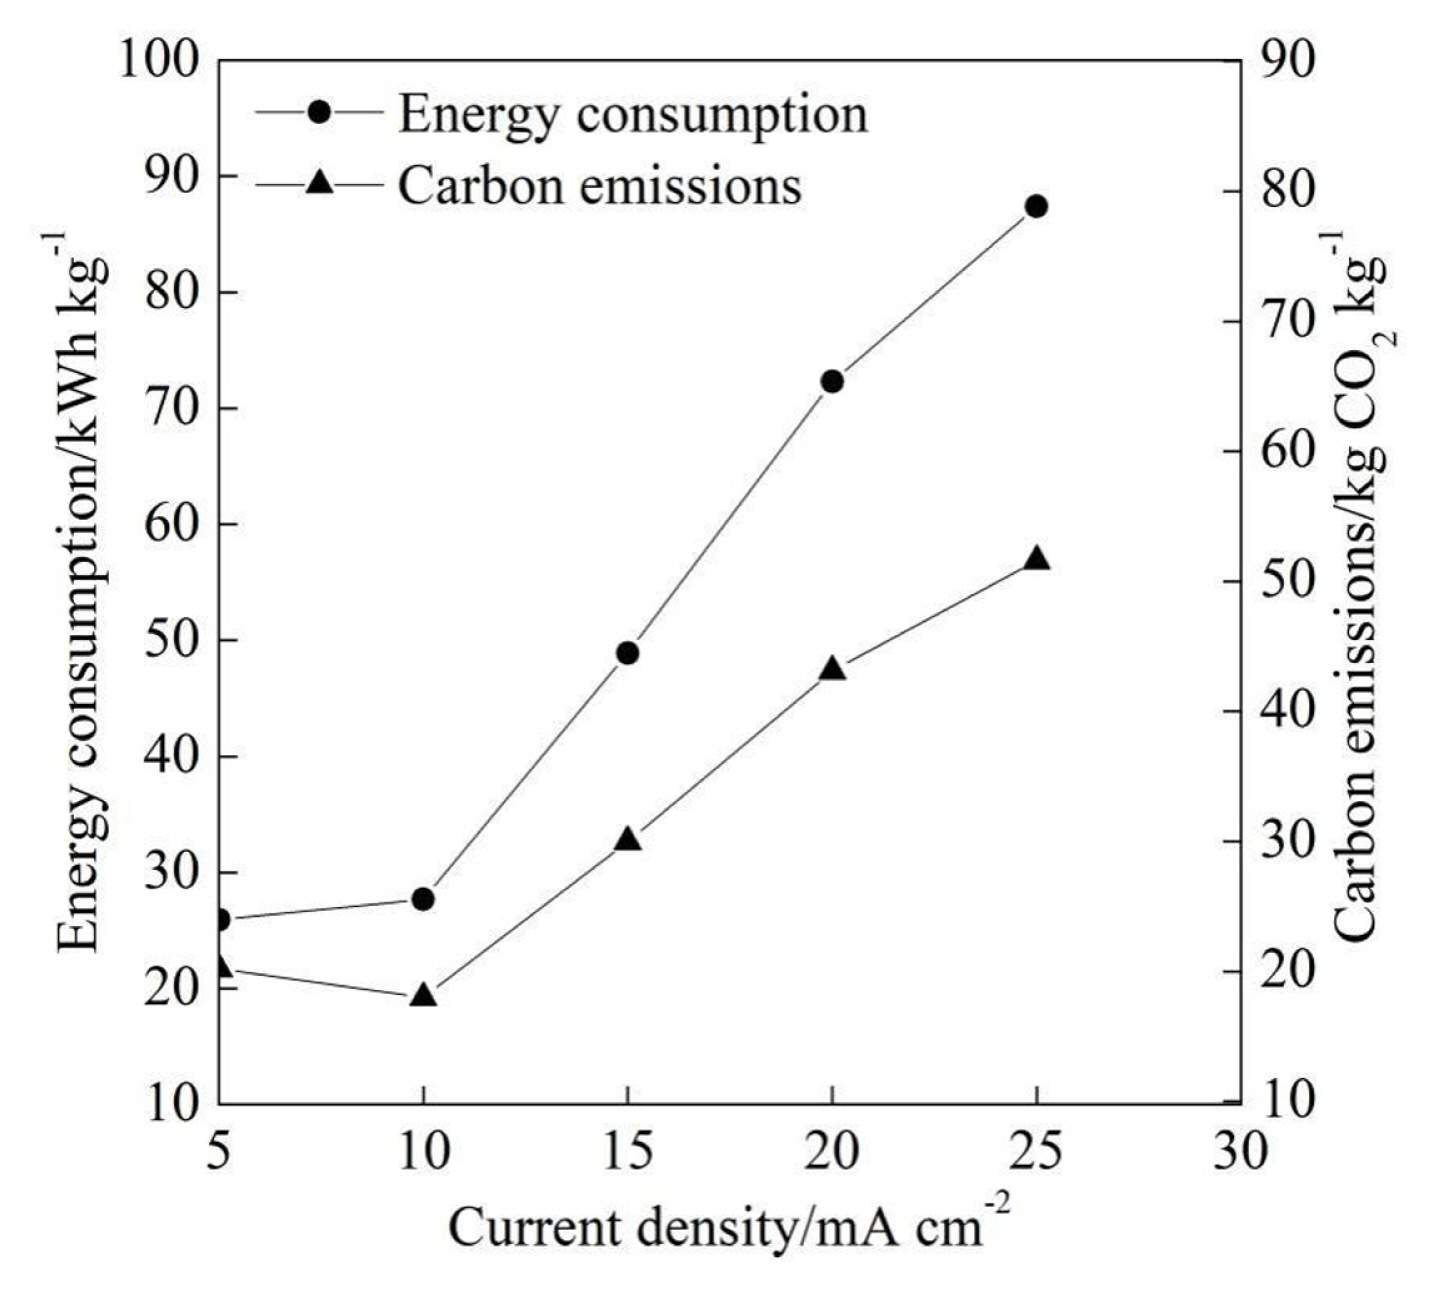
As shown in Fig. 5, the energy consumption of the tube electrolyzer per kilogram of the degraded COD increased slowly from 25.9 kWh kgŌłÆ1 to 27.7 kWh kgŌłÆ1 with the increase of current density 5.0 mA cmŌłÆ2 to 10.0 mA cmŌłÆ2 and then increased fast from 27.7 kWh kgŌłÆ1 to 85.3 kWh kgŌłÆ1 when the current density increased from 10.0 mA cmŌłÆ2 to 25.0 mA cmŌłÆ2. The higher degraded COD contributed to the slow increase of the energy consumption of the electrolyzer to a certain extent with the current density from 5.0 mA cmŌłÆ2 to 10.0 mA cmŌłÆ2 according to the Eq. (2). When the current density reached 10.0 mA cmŌłÆ2, the increase rate of the energy consumption was further improved by the decrease of the corresponding degraded COD reduction rate according to the Eq. (2). As Fig. 5 shows, it is apparent that an appropriate current density is significant to the improvement of the electrochemical performance.
It can be seen from Fig. 5 that the carbon emissions at the current density of 5.0 mA cmŌłÆ2 was slightly lower than that at the current density of 10.0 mA cmŌłÆ2, which was due to the fact that the corresponding carbon emissions of the magnetic pump at the current density of 5.0 mA cmŌłÆ2 was higher than that at the current density of 10.0 mA cmŌłÆ2 caused by the degraded COD according to Eq. (3). As shown in Fig. 5, the carbon emissions gradually increased when the current density increased from 10.0 mA cmŌłÆ2 to 25.0 mA cmŌłÆ2 because of the increase of the energy consumption according to Eq. (4). Besides, the direct greenhouse gas emissions could be negligible because the oxygen from the anode and the hydrogen from the cathode accounted for the vast majority of the gas generated in the electrochemical degradation of the textile effluent [26].
K. Ramesh et al. [27] performed the study on the electrochemical degradation of the textile effluent after the biological treatment with the initial COD concentration of 250 mg LŌłÆ1 in a small electrolyzer under batch mode by keeping a constant volume of wastewater in the reactor with the textile effluent prefiltered through a small sand filter to remove the suspended impurities prior to the electrolysis process. The COD reduction of 64% was obtained with the remaining COD of 90 mg LŌłÆ1, which was higher than the remaining COD of 65.0 mg LŌłÆ1 at the current density of 10.0 mA cmŌłÆ2 in the present study. Besides, the textile effluent was not pre-filtered prior to the electrochemical degradation process in the present study, which was closer to the actually industrial conditions of the textile effluent treatment.
J. Zou et al. [28] reported a complete removal of the COD for the real textile effluent using a bipolar boron-doped diamond anode with the initial COD concentration of 2154 mg LŌłÆ1 at the added NaCl concentration of 3 g LŌłÆ1 and electrolysis time of 3 h in a small electrolyzer. However, the addition of NaCl is seldom employed in the industrially electrochemical degradation of the textile effluent due to the cost of NaCl. In addition, it requires further researches on the decrease of the cost for the boron-doped diamond electrode because the cost of the boron-doped diamond electrode is higher than that of the PbO2 electrode in the industrial application.
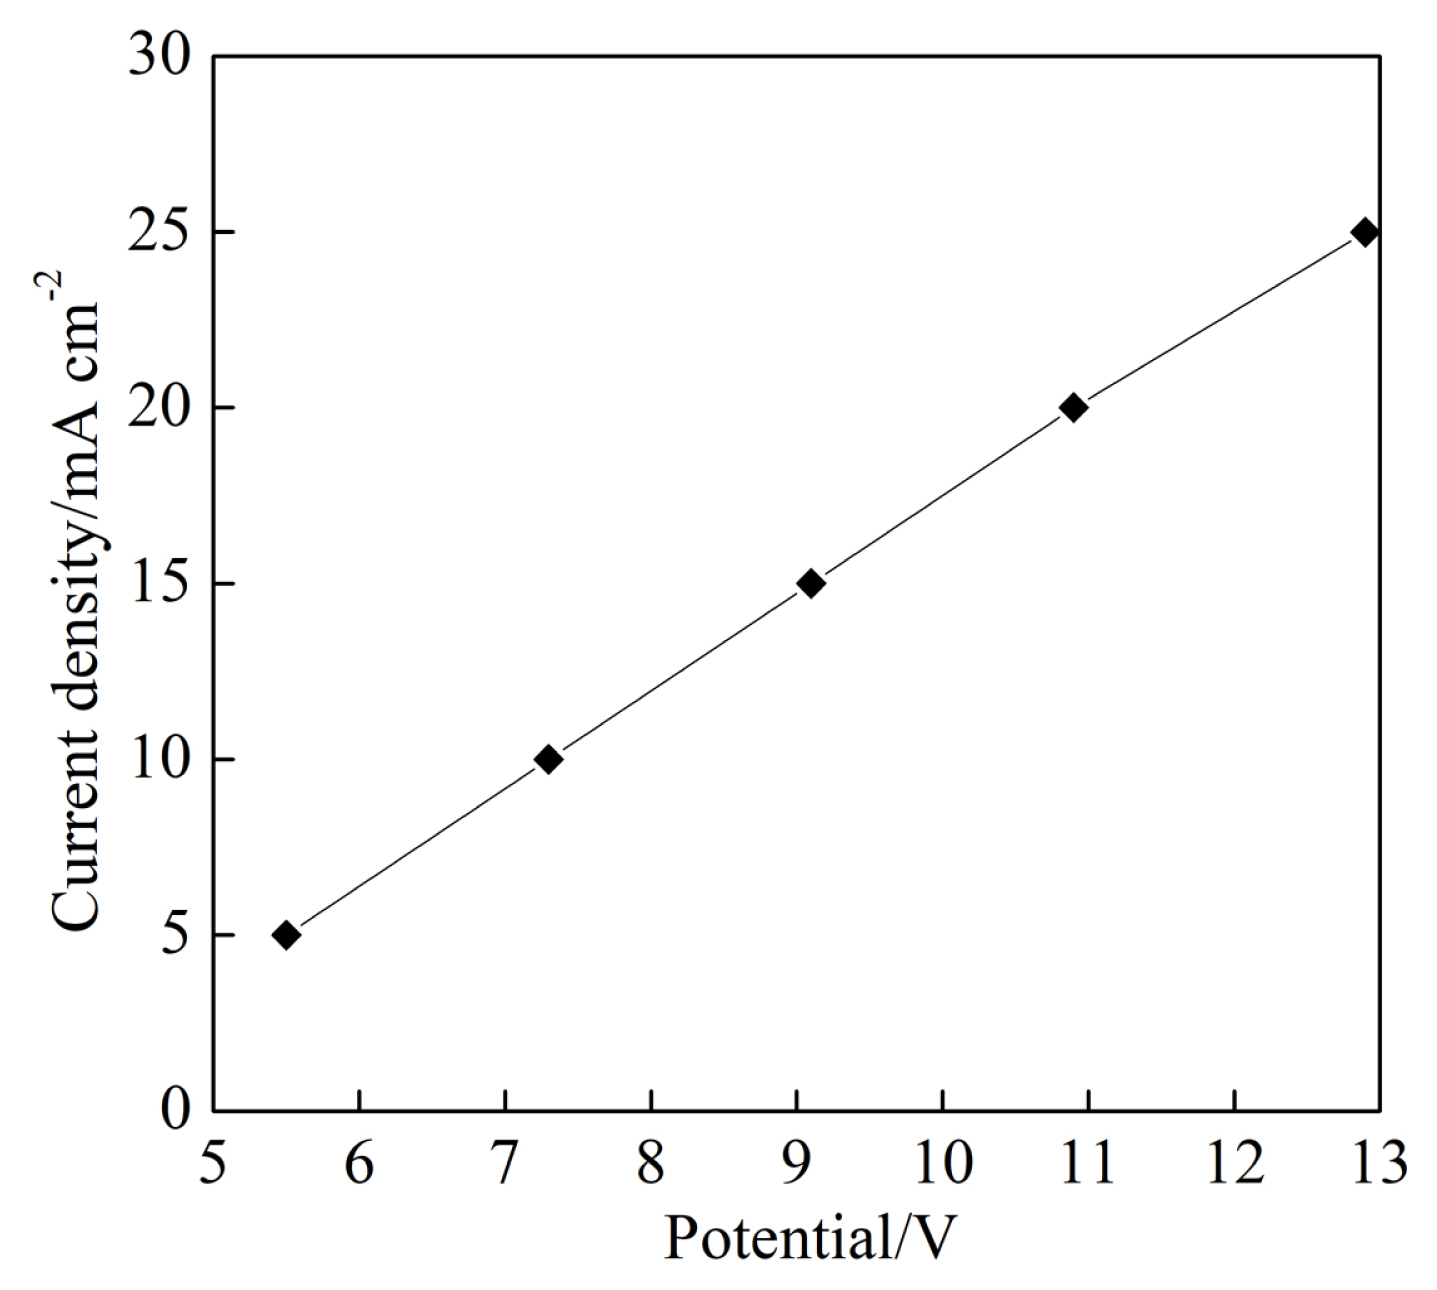
For the current density from 5.0 mA cmŌłÆ2 to 25 mA cmŌłÆ2, the current density as a function of potential was shown in Fig. 6 with the potential ranged from 5.5 V to 12.9 V at the initial pH of 7.6 and the electrolyte flow rate of 1.5 L minŌłÆ1. It can be seen from Fig. 6 that there was nearly a linear relationship between current density and potential. Current density of 10.0 mA cmŌłÆ2 was obtained at the potential of 7.3 V.
It can be seen from Fig. 4 that the COD and the current efficiency reached their minimum and maximum at the current density of 10.0 mA cmŌłÆ2, respectively. The minimum COD of 65.0 mg LŌłÆ1 was lower than 80 mg LŌłÆ1 that was the direct discharge limit of the COD for the textile effluent in China. Therefore, the current density of 10.0 mA cmŌłÆ2 at the potential of 7.3 V was selected for the following experiments of electrochemical degradation time.
3.4. The time of electrochemical degradation on electrochemical performance
Fig. 7 shows the electrochemical performance with the time of the electrochemical degradation from 1 to 5 at the initial pH of 7.6, the electrolyte flow rate of 1.5 L minŌłÆ1 and the current density of 10.0 mA cmŌłÆ2. As shown in Fig. 7, there was a clear fall in the COD and the COD reached to the lowest point of 22.0 mg LŌłÆ1 from 65.0 mg LŌłÆ1. However, the decrease rate of the COD gradually reduced with the increase of the electrochemical degradation time. It was obvious that the increase of the electrochemical degradation time contributed to the gradual reduction of degradable organics concentration in the electrolyte solution, which could reduce the electrochemical degradation rate of the COD. It can be seen from Fig. 7 that the current efficiency gradually decreased from 88.3% to 12.1% due to the decrease of the electrochemically degraded COD reduction rate according to the Eq. (1).
4. Conclusions
The COD of the textile effluent was reduced from 94.0 mg LŌłÆ1 to 65.0 mg LŌłÆ1 with the current efficiency of 88.3%, the energy consumption of 27.7 kWh kgŌłÆ1 (per kilogram of degraded COD) and the carbon emissions of 18.0 kg CO2 kgŌłÆ1 (per kilogram of degraded COD) by the commercial PbO2 mesh cylinder anode and the titanium cylinder cathode in the tube electrolyzer at the initial pH of 7.6, the electrolyte flow rate of 1.5 L minŌłÆ1 and the current density of 10.0 mA cmŌłÆ2. The COD of the textile effluent could drop to 22.0 mg LŌłÆ1 after 5 times of the electrochemical degradation, which met the direct discharge limit of the COD for the textile effluent in China. The experimental results indicated that the PbO2 mesh cylinder electrode could effectively reduce the COD of the textile effluent at initial pH without the addition of NaCl or Na2SO4, which suggested that the electrochemical degradation of the textile effluent using PbO2 mesh cylinder electrode in the tube electrolyzer would be an effective and economic method in the industrial application.