1. Introduction
Textile industry consumes immense amounts of process water with chemicals annually and a large quantity of the textile dyes are discharged into water sinks through the textile effluent [1]. The textile effluent is characterized by intense color and high organic load such as dyes, which might cause severe problems to human health and aquatic life [2]. In order to obey increasingly rigid environmental regulations, many technologies have been used to treat the textile effluent before disposal, such as biological, chemical, physical and electrochemical oxidation processes [3].
Physical treatments are usually used to separate the pollutants in solid or suspended solid states of the textile effluent. Chemical treatments are effective for chemisorption and physisorption of pollutants by chemicals, such as flocculants, when the electrostatic property of pollutants is compatible with the flocculants [4]. The further treatments are required for the two methods because pollutants are only transformed physically from its initial liquid phase into solid phase [5]. Biological methods are based on pollutant degradation by microorganism, which requires certain biodegradability of the textile effluent with a large spacious land [6].
Electrochemical oxidation is a more promising method to degrade dye pollutant in textile effluent based on the formation of hydroxy radical (OH·) as the oxidator, which is widely developed in recent years and highly effective in the treatment of textile effluent [7]. Electrochemical oxidation of pollutants is achieved by direct [8] or indirect oxidation [9]. Electrode materials play a significant role in influencing the efficiency of the electrochemical degradation process. Many electrodes have been investigated to electrochemical oxidation of organic wastewater [10–11], such as dimensionally stable anodes (DSA), PbO2 electrode, doped PbO2 electrode, boron-doped diamond (BDD) electrode and RuO2 electrode [12–14]. Although electrochemical properties of Ti-based PbO2 electrode could be greatly improved by introducing metal or non-metallic into PbO2 active layer such as Mo [15], Ni [16], F [17], it requires to reduce their price and further improve their corrosion resistance for the industrialized application of the textile effluent treatment [18,19]. So far, PbO2 electrode is regarded as a potential anode material for the industrialized application with high oxygen evolution, low cost, good conductivity and strong corrosion resistance [20].
Many researches have focused on the textile effluent with hundreds of COD [21], the simulated wastewater with a single component such as acid orange 7 and other synthetic textile effluents containing reactive dyes and assisting chemicals [22–24]. However, the textile effluent with dozens of COD is usually generated near the process end in the treatment plants, which often needs further treatments to reduce its COD. Besides, NaCl or Na2SO4 is usually introduced in the effluent for further improve the electrochemical treatment performance or improve the conductivity of the textile effluent [25,26]. However, the introduction of NaCl or Na2SO4 increases the price in the industrially electrochemical treatment of the textile effluent. In addition, NaCl may produce the chloride in the electrochemical oxidation processes, which needs to be further treated [27].
Therefore, real textile effluent with dozens of COD was electrochemically degraded with the commercial PbO2 electrode as the anode and the stainless steel electrode as the cathode in a self-made electrolytic cell in the present study. The COD, the current efficiency and the energy consumption under different initial pH, electrolyte flow rates and cell voltages were investigated to optimize the electrochemical degradation conditions of the real textile effluent.
2. Experimental
2.1. Materials and chemicals
The commercial PbO2 electrode was purchased from Baoji Zhiming Special Metal Co., Ltd. PbO2 was electrodeposited on the titanium mesh with the mesh of 5 and the titanium wire diameter of 1 mm, where the thickness of its PbO2 film was 1 mm. The stainless steel plate was Wuxi Hangluda Special Steel Co., Ltd. Sulfuric acid (H2SO4) was of analytical grade and purchased from Weisi (Beijing) Experimental Supplies Co., Ltd.
The textile effluent was obtained at the outflow of the sedimentation after the biological treatment from a textile effluent treatment plant in Heibei province. The composition of textile effluent was complex and dependent on the production schedule because the effluent originated from the different textile units. Therefore, its exact composition was unknown. Some physico-chemical characteristics of the real textile effluent was shown in Table 1.
2.2. Experimental apparatus
The diagram of the experimental apparatus for the electrochemical degradation of the textile effluent is shown in Fig. 1 that consists of a self-made organic glass cuboid cell, a PbO2 anode, a stainless steel cathode, a DC power supply (LDX-C5010) from Shanghai Shuxin Electric Technology Co., Ltd, a peristaltic pump (BT100-02) from Baoding Qili Precision Pump Co., Ltd. The thickness of the stainless steel cathode is 1 mm. The electrode dimensions are 50 mm × 80 mm with the interelectrode gap of 5 mm and the effective electrolytic area of 35 cm2.
2.3. Experimental design
All electrochemical experiments were conducted using the constant voltage method using the same collected textile effluent to avoid compositional and concentration variations. The electrolyte solution was continually pumped from the inlet reservoir to the electrolytic cell and then flowed into the outlet reservoir. The initial electrochemical reaction in the electrolytic cell was operated for 60 min at the electrolyte flow rate of 50 mL min−1 and the temperature ranging from 30°C to 35°C. The pH of the textile effluent was adjusted by the 0.1 mol L−1 H2SO4 solution. The analysis samples were extracted at the electrolytic cell outlet when each experiment was finished.
2.4. Analytical methods
Samples of 2 mL were added in the prefabricated pipe and then digested for 2 h at 150°C. After the samples reached the ambient temperature, the COD of each sample was read at 620 nm with a spectrophotometer (DR3900, Hach, USA) after their temperature reached the ambient temperature.
Current efficiency (η, %) that presents the utilization rate of the charge applied for electrochemical oxidation, is calculated using Eqn. (1):
where CODt and COD0 are the COD of textile effluent after electrolysis and before electrolysis, respectively, mg L−1; I is the working current, A; v is the electrolyte flow rate, mL min−1; t is the total time when the constant cell voltage is applied, s; F is the Faraday constant, 96485 C mol−1.
The experimental energy consumption per kilogram of the COD for the textile effluent (W, kWh kg−1) is calculated using Eqn. (2):
where U is the constant cell voltage, V.
3. Results and Discussion
3.1. The effect of initial pH on electrochemical performance
Fig. 2 shows that the electrochemical performance of the textile effluent degradation with initial pH ranged from 3.0 to 11.0 at the electrolyte flow rate of 50 mL min−1, the cell voltage of 4.5 V and the electrolysis time of 60 min. The COD and the current efficiency at initial pH of 7.0 were 31.5 mg L−1 and 74.2%, respectively. Since the initial pH of 7.0 was nearby the original pH of 7.2 for the textile effluent, the corresponding experimental results at initial pH of 7.0 were valuable to the electrochemical performance of the textile effluent degradation with its initial pH of 7.0. It can be seen that the COD of the textile effluent gradually increased with the increase of the initial pH. The increase of the electrolyte solution pH was beneficial for the enhancement of oxygen evolution in the anode, which reduced the effective electrochemical oxidation spots on the PbO2 anode [28]. On the one hand, the direct oxidation on the PbO2 anode and indirect oxidation reactions by the hydroxyl radicals for the textile effluent were promoted at the low pH [29]. On the other hand, the oxidizing specie SO4·−, was generated on the PbO2 anode surface with the presence of sulfate ions in the electrolyte as seen in reaction 1 and reaction 2 [30], which contributed to the oxidation/degradation of the textile effluent.
Therefore, the COD of the textile effluent after electrochemical degradation gradually increased with the increase of the initial pH as shown in Fig. 2. In the meantime, the reduction of the degraded COD caused the increase of the current efficiency according to Eqn. (1), which the change trend of current efficiency was consistent with as shown in Fig. 2. Therefore the initial pH of 3.0 was selected for the following experiments.
3.2. The effect of electrolyte flow rate on electrochemical performance
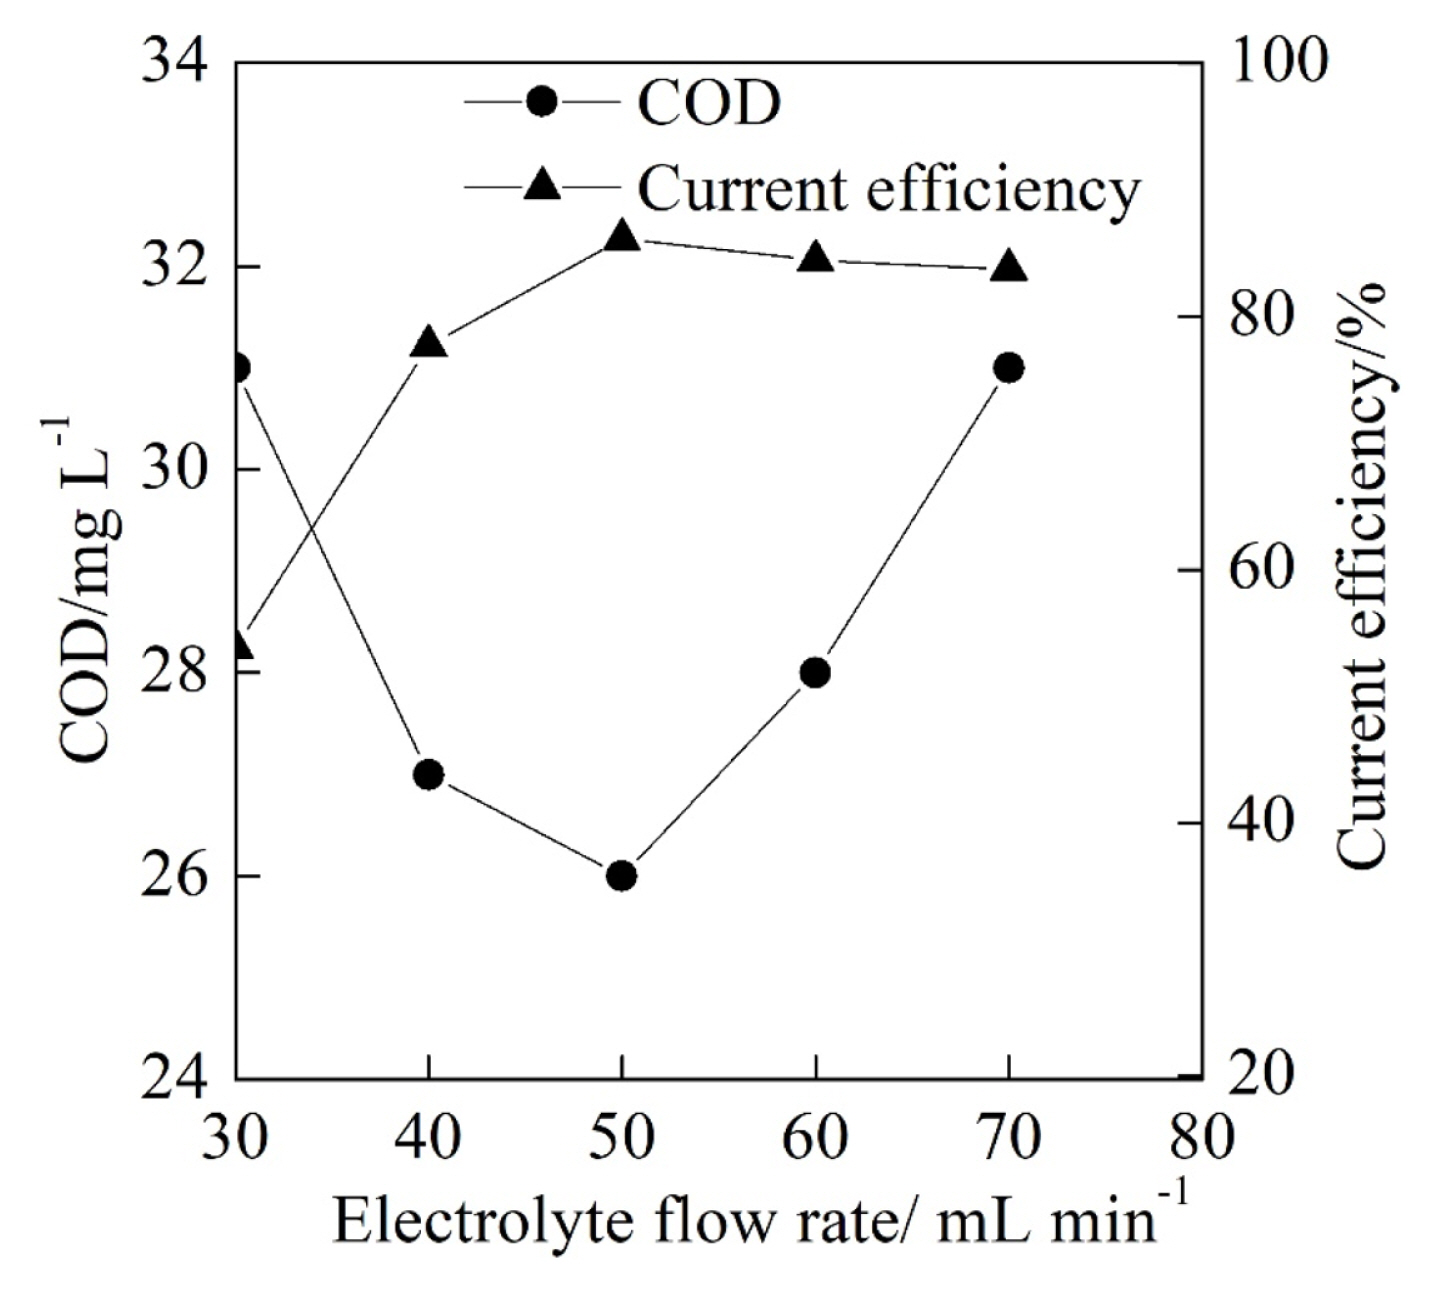
Fig. 3 illustrates that the COD and the current efficiency of the textile effluent at different electrolyte flow rate with the cell voltage of 4.5 V, the initial pH of 3.0 and the electrolysis time of 60 min. As shown in Fig. 3, the COD after the electrochemical degradation reduced at first and then gradually increased with the increase of the electrolyte flow rate from 30 mL min−1 to 70 mL min−1. As the electrolyte flow rate from 30 mL min−1 to 50 mL min−1, the mass transfer became more sufficient, which was favorable for the COD degradation. When the electrolyte flow rate was beyond the 50 mL min−1, the electrolyte flow rate was beyond the maximum electrochemical oxidation rate on the PbO2 anode surface, which caused that the part of the textile effluent flowed out of the electrolytic cell without electrochemical degradation. As a result, the COD reached its minimum of 26.0 mg L−1 at the electrolyte flow rate of 50 mL min−1.
Moreover, it can be seen from Fig. 3 that the current efficiency increased at first and then gradually reduced with the increase of the electrolyte flow rate from 30 mL min−1 to 70 mL min−1, which was influenced by the change trend of the COD. The increase of the electrolyte flow rate and the degraded COD were attributed to the reduction of the current efficiency with the electrolyte flow rate from 30 mL min−1 to 50 mL min−1 according to Eqn. (1). In addition, the mass transfer between the electrolyte and the anode surface also played a significant role in the increase of the current efficiency. When the electrolyte flow rate increased from 50 mL min−1 to 70 mL min−1, the reduction of degraded COD resulted in a little bit reduction of the current efficiency. Besides, the current efficiency reached its maximum of 86.1% at electrolyte flow rate of 50 mL min−1 that was selected for the following experiments of the electrolyte flow rate.
3.3. The effect of cell voltage on electrochemical performance
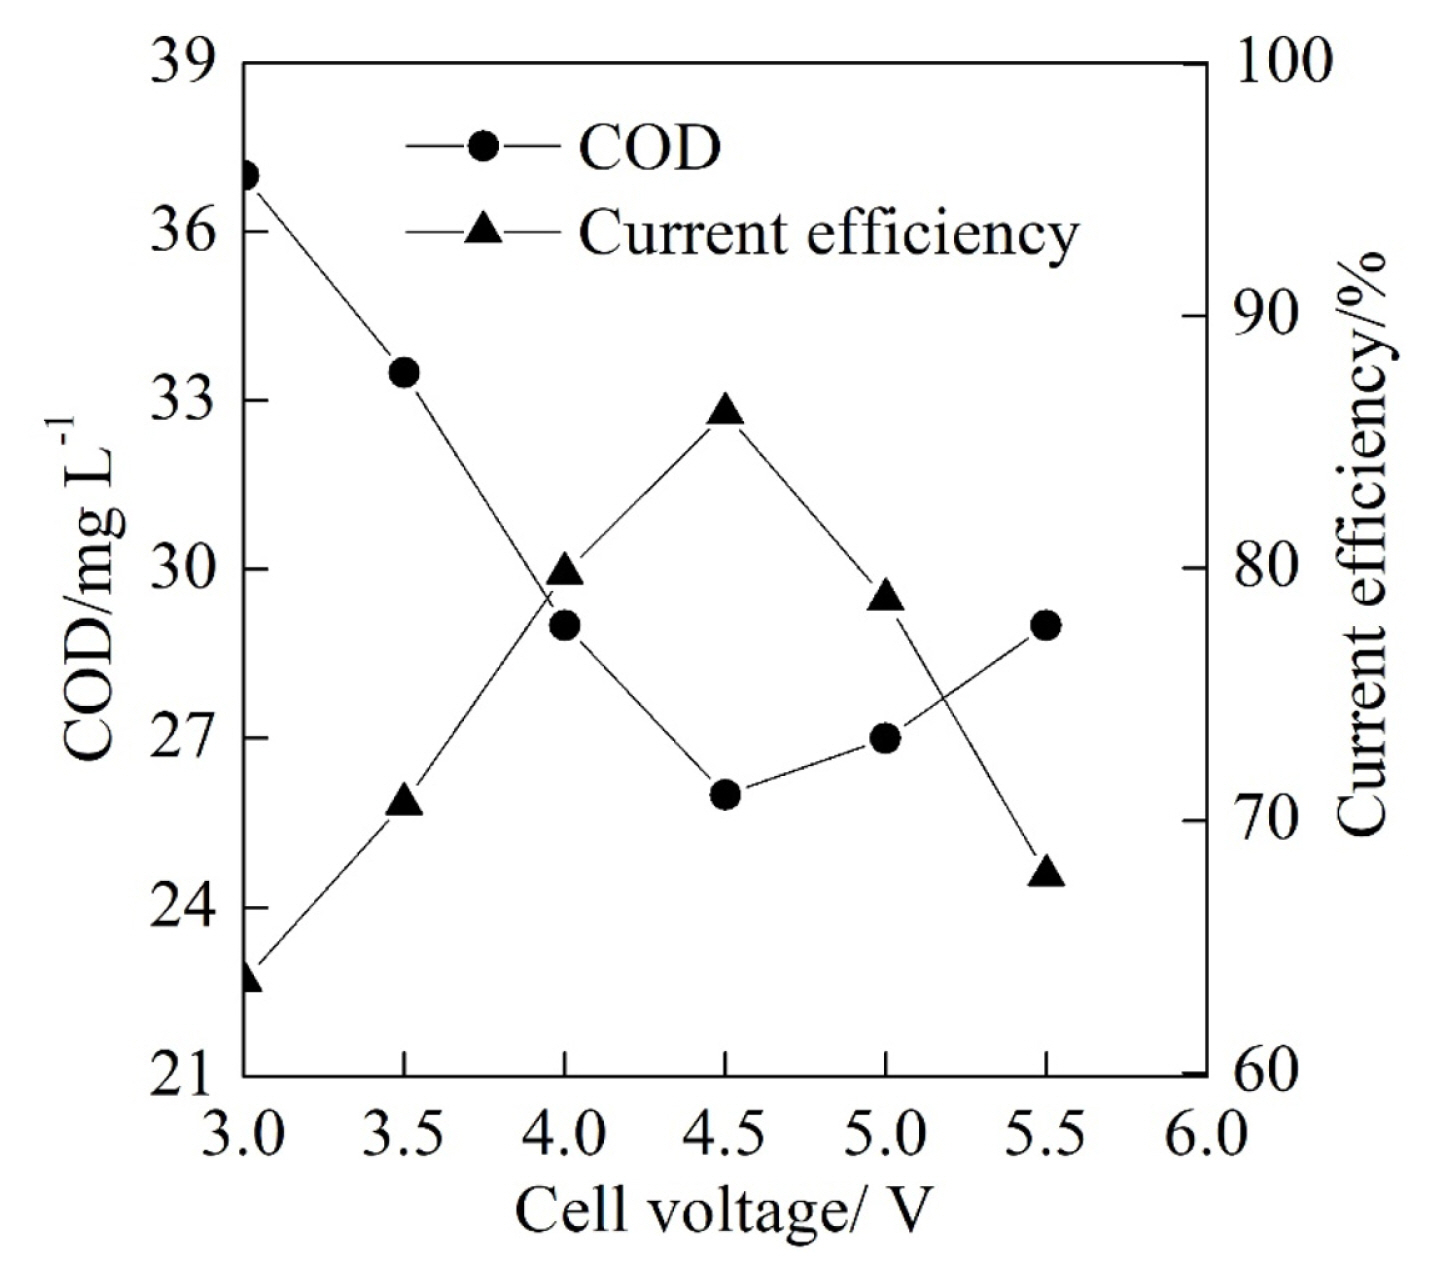
The electrochemical performance of the textile effluent degradation was shown in Fig. 4 and Fig. 5 with the cell voltage ranged from 3.0 V to 5.5 V at the electrolyte flow rate of 50 mL min−1, the initial pH of 3.0 and the electrolysis time of 60 min. As shown in Fig. 4, the COD reduced at first and then gradually increased while the current efficiency increased at first and then gradually reduced with the increase of the cell voltage. The COD and the current efficiency reached their minimum of 26.0 mg L−1 and maximum 86.1% at the cell voltage of 4.5 V, respectively. It can be calculated that the corresponding COD removal rate was 53.6% at the cell voltage of 4.5 V. With the increase of the cell voltage from 3.0 V to 4.5 V, the current density of the PbO2 anode was increased, which increased the electrochemical degradation rate of the COD on the anode surface. However, the further increase of the cell voltage from 4.5 V to 5.5 V facilitated the oxygen evolution reaction and reduced the effective electrochemical oxidation spots on the PbO2 anode, which resulted in the increase of the COD and the reduction of the current efficiency.
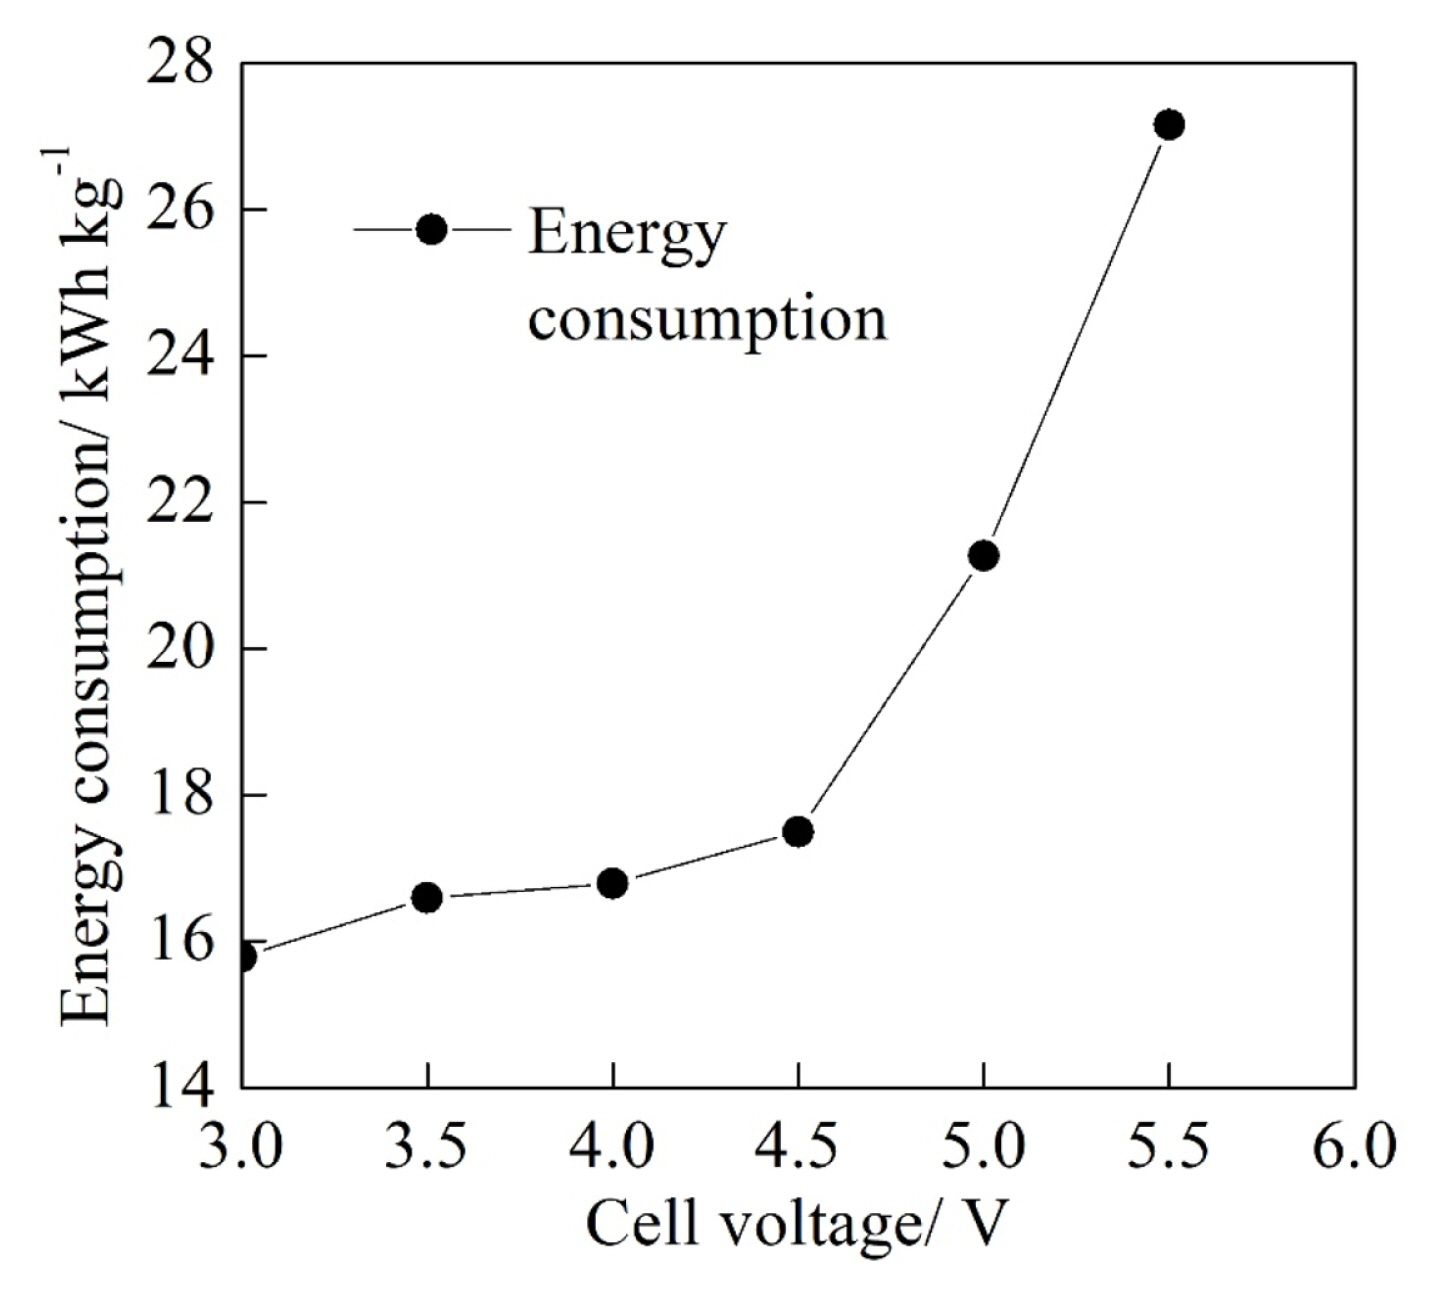
In the meanwhile, it can be seen from Fig. 5 that the energy consumption per kilogram of the degraded COD increased slowly from 15.8 kWh kg−1 to 17.5 kWh kg−1 with the increase of cell voltage 3.0 V to 4.5 V and then increased fast from 17.5 kWh kg−1 to 27.2 kWh kg−1 when the cell voltage increased from 4.5 V to 5.5 V. The increase of the cell voltage could contribute to the increase of the energy consumption according to the Eqn. (2). When the cell voltage increased from 3.0 V to 4.5 V, the increase of the current efficiency lowered the increase rate of the energy consumption to a certain extent. In addition, the increase of the energy consumption became fast with the reduction of the current efficiency when the cell voltage increased from 4.5 V to 5.5 V. Therefore, an appropriate cell voltage is significant to the improvement of the electrochemical performance. Although the energy consumption at the cell voltage of 4.5 V was not the lowest compared with those at other cell voltages, the COD was lower at the cell voltage of 4.5 V with the higher current efficiency when the other experimental conditions were the same. Therefore, the cell voltage of 4.5 V was the superior cell voltage condition for the experimental system.
A. Mukimin et al. [31] decreased the COD of textile wastewater by 59% using the self-fabricated Ti/PbO2 cylinder electrode with NaCl concentration of 4000 mg L−1. In the presence of NaCl containing chloride, hydroxyl radical chlorine could be generated on the surface of the anode, which was beneficial for the degradation of organic matters [32]. However, the presence of NaCl could chlorinated organic compounds in the electrochemical degradation process and introduced new organic pollutants to the textile effluent [33], which was detrimental to the industrial end treatment of the textile effluent. Besides, the fabricated Ti/PbO2 electrode in the laboratory requires further optimization of the fabrication technology before its application in the industry.
Y.A. Oktem et al. [34] carried out the comparative ozonation experiments for synthetic dyeing wastewater samples containing both chloride and sulfate to increase the biodegradability of the wastewater. Although the results showed that the presence of sulfate could increase the biodegradability of the synthetic dyeing wastewater and decrease the acute toxicity, the unit prize of sodium sulfate was higher and its higher prize imposed a hamper to the switch from sulfate to chloride for the introduction to the textile effluent.
4. Conclusions
The COD of the real textile effluent was reduced from 56.0 mg L−1 to 26.0 mg L−1 with the current efficiency of 86.1% and the energy consumption of 17.5 kWh kg−1 (per kilogram of degraded COD) using the commercial PbO2 anode and the stainless steel cathode at the initial pH of 3.0, the electrolyte flow rate of 50 mL min−1, the cell voltage of 4.5 V and the electrolysis time of 60 min. The experimental results indicated that the PbO2 electrode could further effectively reduce the COD of the textile effluent without the addition of NaCl or Na2SO4, which suggested that the electrochemical degradation of the textile effluent using PbO2 electrode would be an effective and economic method in the industrial application.