


1. Introduction
Cyclic voltammetry is the most useful technique for electrochemical experiments because it can be carried out very easily and the cyclic voltammogram (CV) obtained therefrom includes rich information about the electrochemical reactions that are characterized by the relationship between the potential and the current. Even though the i-E (current-potential) curve appears monotonic, several important parameters are involved, as shown in the following equation of a reversible faradaic reaction,
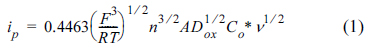
where ip is the peak current; F, the Faraday constant; R, the gas constant; T, the temperature; n, the number of electrons transferred; A, the electrode area; Dox,the diffusion coefficient of an oxidized species; CO* , the concentration of the oxidized species; and ╬Į, the scanrate as conventionally mentioned in a textbook [1].
However, the drawback of such an information-rich and easy to perform technique is the laborious analysis required to resolve the plots that appear simple but are complex in reality. One of the examples is performing the same experiments whilst varying only the scan rate. Fig. 1 shows a good example of finding the diffusion coefficient of an oxidized species (Dox) from the slope of the cathodic peak currents in Fig. 1(b) [2]. In the same way, ╬▒, n, and bulk concentrations can be evaluated as demonstrated in the literature [3-4].
Figure┬Ā1.
(a) Simulated cyclic voltammograms with increasing potential scan rates (in the direction of the arrow). Simulation conditions: k0=1.0 cm/s, ╬▒ = 0.5, n=1, COx= 1 mM, CRed= 0 mM, DOx= 5├Ś10ŌłÆ6cm2/s, scan rate = 10 mV/s ŌłÆ 3.2 V/s. (b) Plots of cathodic and anodic peak currents of CVs when the switching potentials (E╬╗) are ŌłÆ0.2, ŌłÆ0.4, and ŌłÆ1.0 V vs. E0.
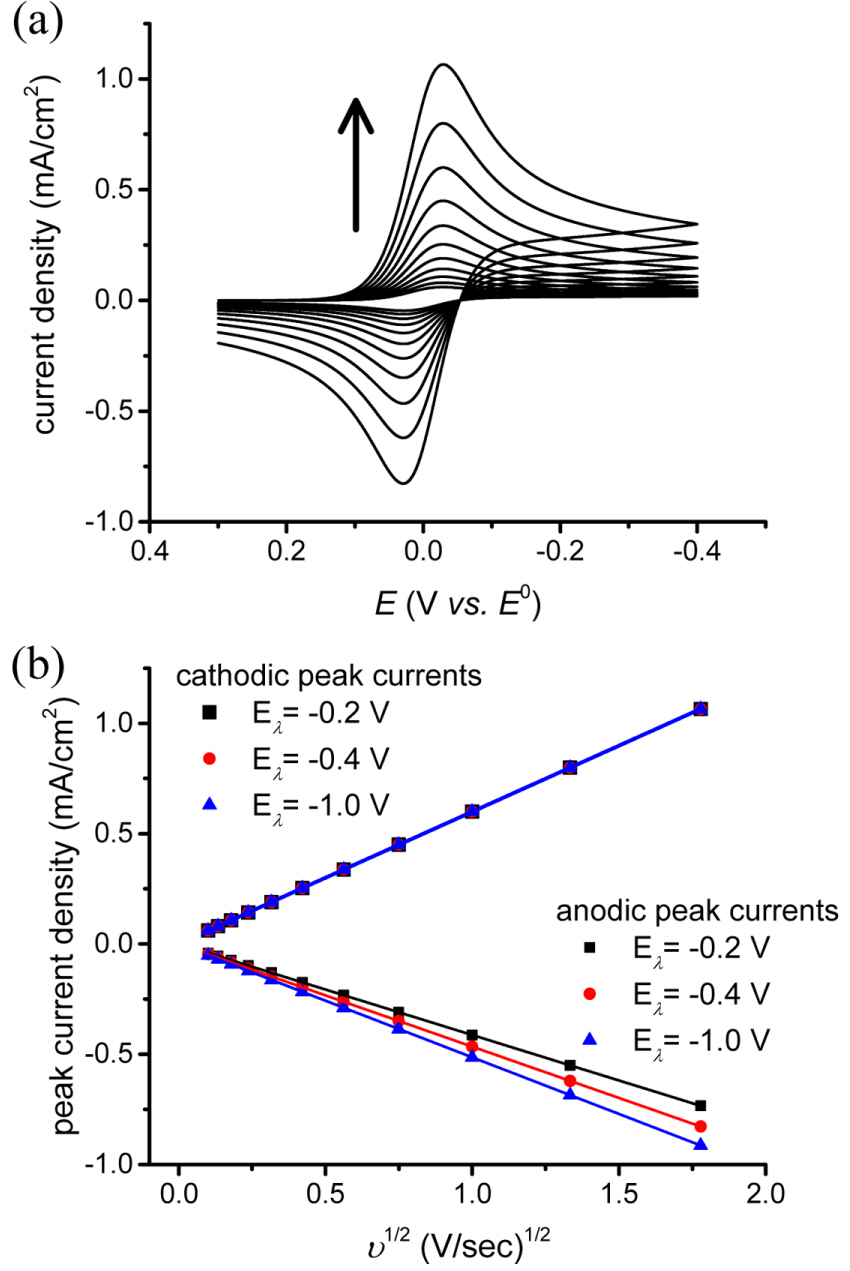
It is interesting that while the CV comprises forward and reversed potential scans, there are only a few studies on the reverse currents, except for those examining the reversibility of the electrochemical reaction of interest [5]. One of the possible reasons for this is the effect of the switching potential (E╬╗) on the reverse current. Fig. 1(b) compares the anodic peak currents obtained with E╬╗ = ŌłÆ0.2 V, ŌłÆ0.4 V, and ŌłÆ1.0 V vs. E0, respectively. Even though the forward scans give the same peak current values, the reversal scans do not. Thus, we could speculate that all the plots have strong linear relationships with ╬Į1/2, as seen in eq. (1); yet the exact values of parameters cannot be determined without information that would have to be obtained by conducting other experiments.
Nevertheless, an equation found in the literature [1,6] describes the ratios of the forward and reverse current peaks of a CV. When only the oxidized species (Ox) is present and its cathodic peak current (ipc) is generated during the forward linear potential sweep, the reversal anodic peak current (ipa) should be measured from the baseline of the decaying curve (refer to ipa in Fig. 5). A Nernstian wave with stable products will give ipa /ipc = 1, regardless of E╬╗. However, obtaining a baseline for measuring ipa is not always possible. In such cases, the baseline can be estimated by the following equation:
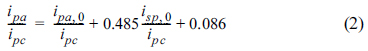
Even though eq. (2) provides a good approximation for measuring the reversal peak current, the linear algebraic equation over-simplifies the voltammetric curve, even if the i-E curve does not appear linear. This means that the tolerance of deviation should be taken into account.
Here, we propose a new equation that provides more accuracy by describing the current relationships through a quadratic algebraic equation. In order to acquire the equation, CV simulations were carried out by varying the parameters in eqs. (1) and (2), and by numerical analysis with varying currents.
2. Experimental Section
2.1 Simulation
The finite element method (FEM) was employed to conduct the digital simulation of CVs as has been described elsewhere [7-10]. To summarize, the molecular species Ox and Red and their concentrations Cox and Cred were digitized as finite elements of distance (d) and time (t) to form CO(d,t) and CR(d,t). For a convenient calculation in MATLAB, they were framed in a 2D-matrix, and redefined as CO(x,y) and CR(x,y) [10]. Here, x and y are dimensionless parameters defined by x = d/Δd, and y = t/Δt, respectively, as is frequently done in electrochemistry simulations [1,7-10].
On the electrode surface, the balance between the rate of charge transfer and the flux of Ox and Red is calculated by the following equation with kf and kb as the rate constants of the forward and backward reactions, and DM, a dimensionless diffusion coefficient calculated by DΔt/Δx2
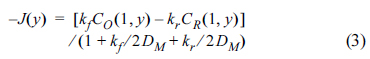
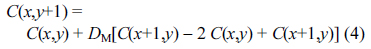
In the bulk solution, Ox and Red molecules diffuse in and out according to the concentration gradient. It is formulated by FickŌĆÖs laws and calculated in the matrix as shown below:
Finally, the current was calculated by re-dimensionalizing the flux, J(y).
2.2 Fitting procedure
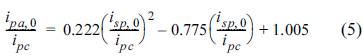
The quadratic equation was obtained by fitting the calculated currents to a quadratic equation. The fitting was done by a pre-defined function in Matlab. The code is as follows:
P = polyfit(isp,0 / ipc, iap,0 / ipc, 2).
2.3 Cyclic voltammetry experiments
A conventional 3-electrode electrochemical cell was used. The working, counter, and reference electrodes were Au disk, Pt mesh, and Ag|AgCl, respectively. The electrolyte solution consisted of 5 mM ferricyanide (Sigma Aldrich), 100 mM KNO3 (Sigma Aldrich) as the supporting electrolyte, and doubly distilled water as the solvent. Linear sweep and cyclic voltammetry experiments were carried out using SP200 (Bio-Logic). The voltammograms were recorded vs. a home-made Ag|AgCl reference electrode at a scan rate of 20 mV/sec.
3. Results and Discussion
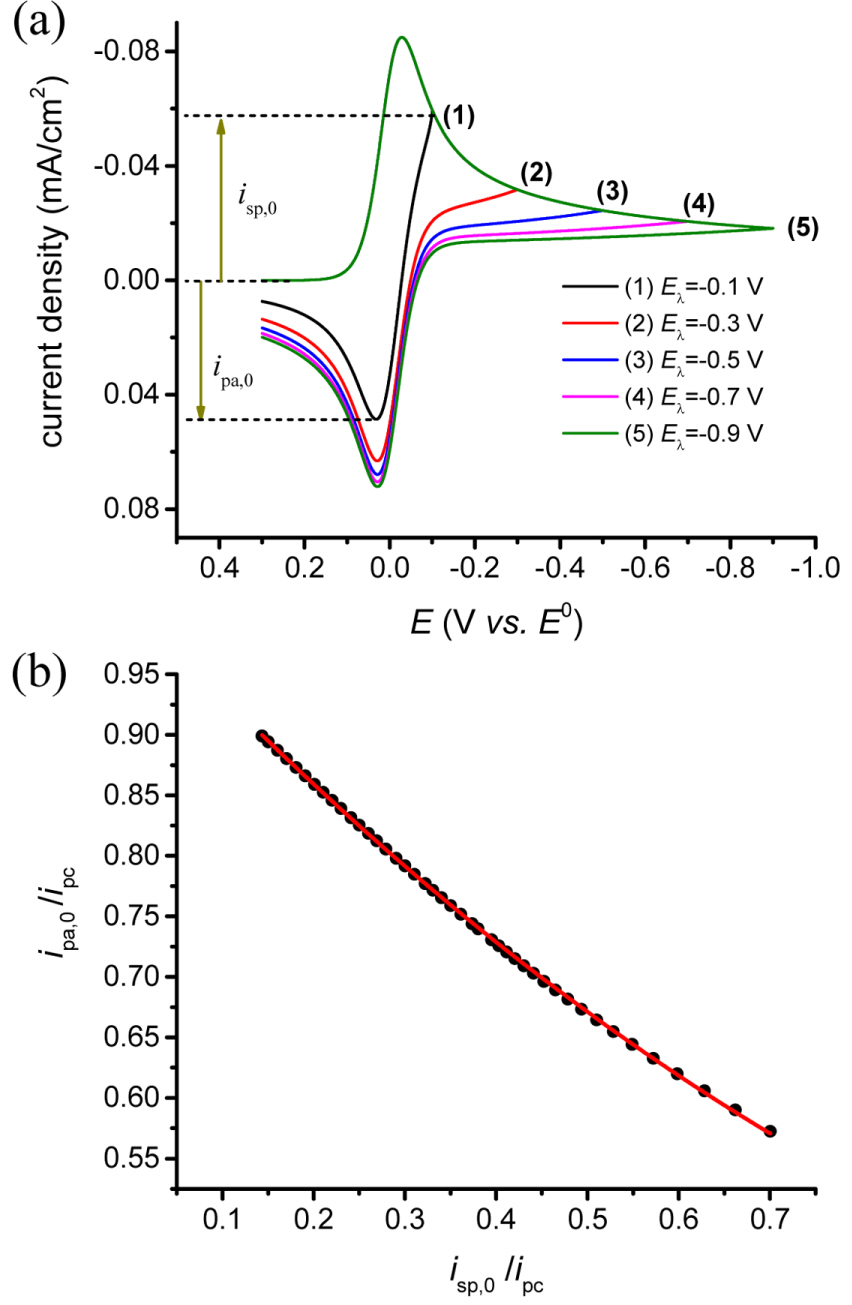
Fig. 2(a) shows the change in the reverse current with switching potential (E╬╗). As E╬╗ increases (negatively), the currents at E╬╗ (isp,0) decay downwards along the curve. Meanwhile, the uncorrected anodic peak current (ipa,0) increases in the anodic direction. Both isp,0 and ipa,0 are normalized by the cathodic peak current (ipc) and are plotted in Fig. 2(b). Thus, fitting to a quadratic algebraic equation provides a good result.
Figure┬Ā2.
(a) Simulated cyclic voltammograms with increasing E╬╗ from ŌłÆ0.1 to ŌłÆ0.9 V vs. E0. The definitions of isp,0 and ipa,0 are graphically presented for easy understanding. (b) Plots of isp,0 and ipa,0 (normalized by ipc) are fitted to a quadratic equation (red solid line) by eq. (5).
Additional simulations with different diffusion coefficients give the same results. If the baseline at the potential of the anodic peak for measuring iap is iap,1, iap = iap,0 + iap,1, then iap,0 is replaced with iap ŌłÆ iap,1 in eq. (5). If products are stable and no additional reaction is involved, ipa /ipc = 1, regardless of E╬╗. Finally, we reach an equation that can calculate the virtual baseline current (iap,1) from the current at the switching potential (isp,0), irrespective of when the potential scan is reversed, as long as the current decays sufficiently, which is assumed to be around 70 % of the peak current of the forward sweep.
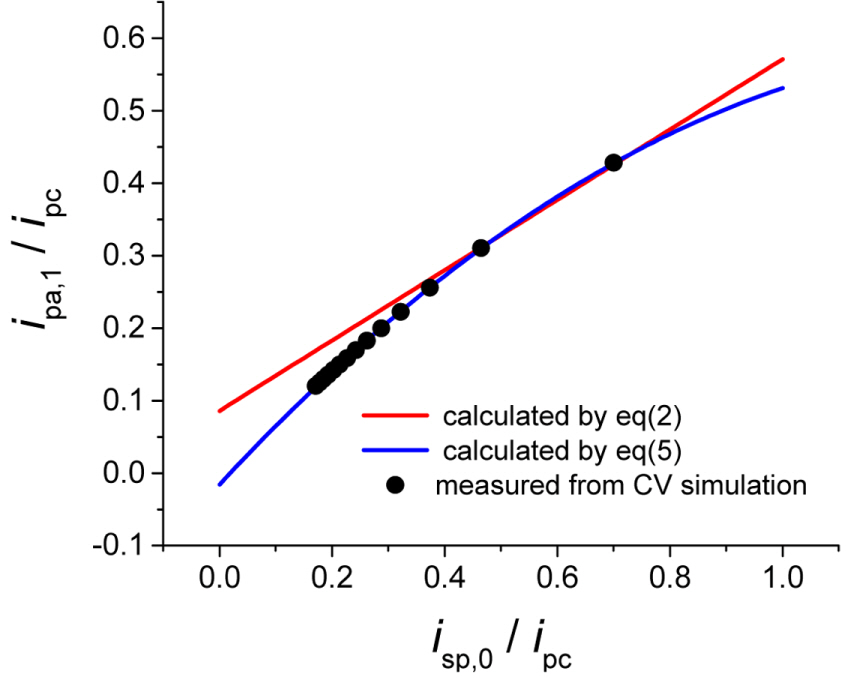
The new equation is compared with the existing one, eq. (2). Fig. 3 shows the baseline currents calculated according to isp,0/ipc changing from 0.70 to 0.00. In a real system, the potential sweep can be applied within a range of ŌłÆ2 V to +2 V vs. E0 in order to avoid interfering with faradaic reactions such as electrolysis of the solvent. Thus, we can practically consider the variance of isp,0 /ipc from 0.14 to 0.70. In the figure, the calculated values by both equations are almost in agreement with each other for isp,0 /ipc from 0.45 to 0.70 which corresponds to 210 mV to 100 mV away from E0. However, when the potential shifts further, the old formula deviates from the theoretical values while the new one does not. Therefore, the new equation is confirmed to provide more accurate virtual baseline currents for measuring the anodic peak current.
Figure┬Ā3.
The red and blue lines are calculated by eq. (2) and (5), respectively, with isp,0 changing from 0.0 to 1.0. The filled circles are obtained from the CV simulations by increasing E╬╗ from ŌłÆ0.1 to ŌłÆ2.0 V vs. E0.
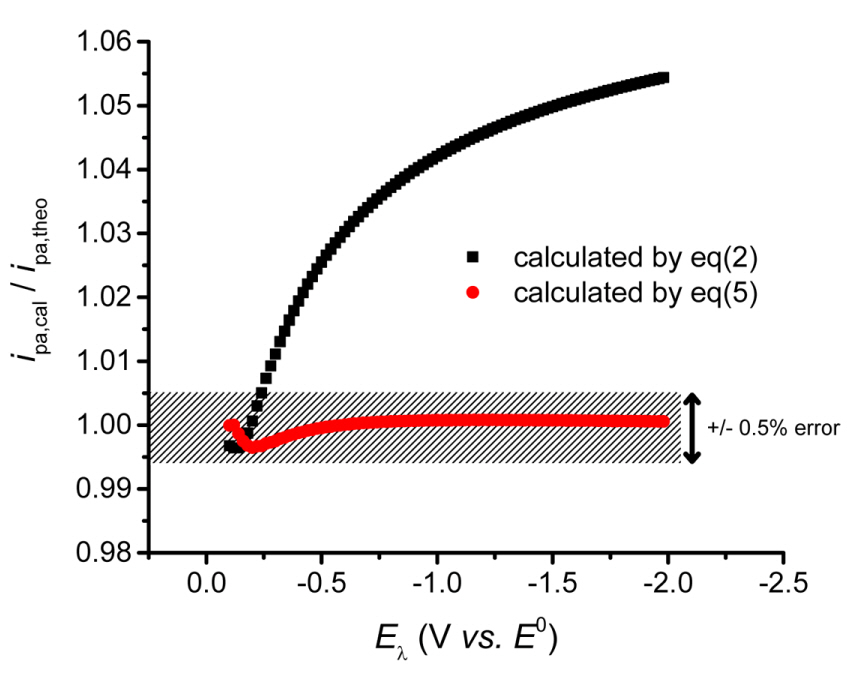
The anodic peak current estimated using the equations are compared with those measured using theoretically simulated cyclic voltammograms. Fig. 4 plots the values of ipa,eq(2)/ipa and ipa,eq(5)/ipa. Here, ipa,eq(2) and ipa,eq(5) are the estimated values using eqs. (2) and (5), respectively, and ipa is the theoretical value. In other words, the estimated currents are normalized by the theoretical currents. Both equations provide good approximations, but when the over-potential increases, eq. (2) shows an increasing deviation from the theoretical values. Meanwhile, eq. (5) keeps ipa,eq(5)/ipa = 1 even though the potential increases within the tolerance at less than ┬▒ 0.5%. This confirms that the new equation provides a more accurate baseline for measuring the peak current of the reverse scanning curve.
Figure┬Ā4.
ipa,eq(2) and ipa,eq(5) are ipa measured from the baseline currents calculated by eqs. (2) and (5) are normalized by ipa,theo . They are plotted along the values of E╬╗. The shaded zone covers ┬▒ 0.5% of relative error from the true value (1.00).
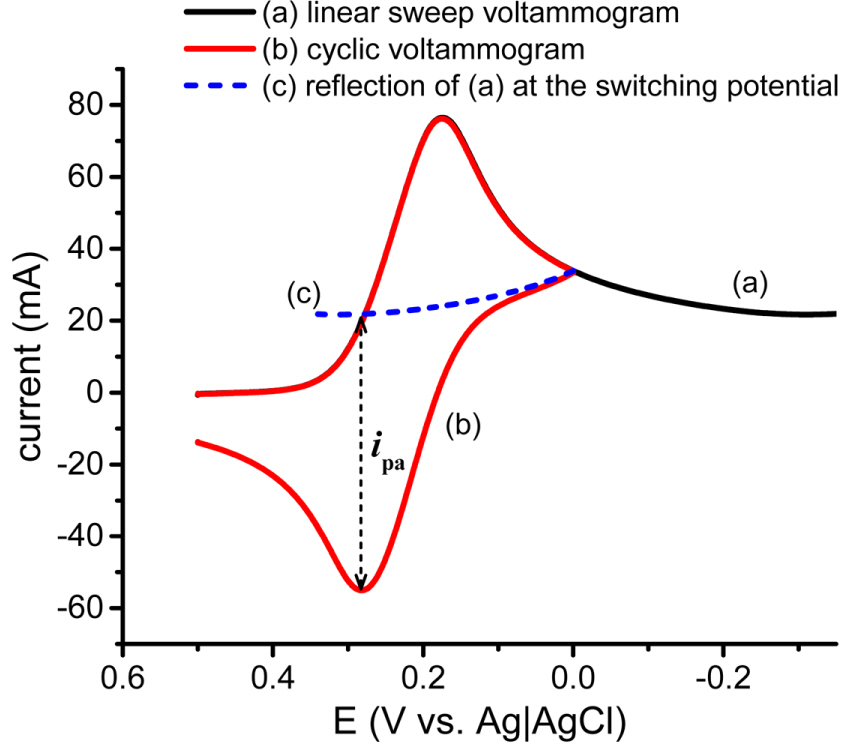
A practical application of this method is demonstrated with an aqueous solution of ferricyanide and the experimental results are shown in Fig. 5. Curve (a) is made by a linear sweep of potential from 0.30 to ŌłÆ0.35 V vs. Ag|AgCl and curve (b) is recorded with a cyclic potential scan switched at 0.00 V vs. Ag|AgCl. Curve (c) is the baseline current extracted from the current of curve (a) decaying continuously from the switching potential of curve (b). It is observed that until the potential reaches the switching potential (0.00 V), curves (a) and (c) are identical, which confirms the validity of curve (c) as a baseline for curve (b), though it is estimated from curve (a). Eventually, the value of ipa /ipc is measured to be 1.008 which is slightly higher than the ideal value of 1.000 for a reversible faradaic reaction. At the same time, the value of ipa /ipc is measured with the virtual baseline current to be 1.007 which is almost the same as the measured one. Both values have < 1% error and the error may be caused by the non-faradaic current such as the charging current for the electric double layer. On the other hand, the old equation calculates 1.014 which is very close to 1.007 but not as accurate as 1.008.
Figure┬Ā5.
(a) A linear sweeping voltammogram and (b) a cyclic voltammogram an aqueous solution of 5.0 mM ferricyanide at a scan rate of 20 mV/s. (c) a baseline curve made by the mirror image of curve (a) around E╬╗ of curve (b). ipa is measured from the baseline curve to the uncorrected peak current as shown by the arrow.
4. Conclusion
We have explained how a new equation was developed from CV simulations and confirmed its validity with experimental results. The new equation describes that the currents at the scan-switching potential and the reversal peak potential are related to each other through a quadratic algebraic equation, providing a virtual baseline current for correcting the measured peak current to a true value. Both simulation and experimental results confirm that the correction is quite accurate; the error is less than ┬▒ 0.5%.
The proposed method will be successfully applied to cases where making a baseline is impossible because a high over-potential may activate interfering reactions such as the electrolysis of solvents or supporting electrolytes. In those cases, the potential sweep should be switched back to an appropriate potential; even then acquisition of the baseline current curve by the further potential may become experimentally impossible. At such moments, our equation can provide a virtual baseline to approximate the true reversal peak current. Our proposed method is expected to be valuably utilized in such restricted experimental conditions.


