1. Introduction
The pistachio processing industry is a rapidly growing industry in Turkey. In 2020, 293,376 tons of pistachios were produced in Turkey. With this production amount, Türkiye became the 3rd pistachio exporter [1]. Most pistachio production is done in the USA and Iran. Pistachio is processed with a dry system in these countries. Pistachio is a kind of nut with rich nutrients, containing 5.6% water, 19.6% protein, 53.2% fat, 19% carbohydrate, and 2.6% ash in its composition [2]. It produced approximately 6m3 of wastewater per ton of processed pistachio in the industry. The produced wastewater was directly discharged to the sewage system [3]. This situation has caused approximately 1,780,000 m3 of wastewater per year. Wastewater rich in organic content was produced when processing pistachio. Therefore, treatment of this wastewater may carry some difficulties due to high chemical oxygen demand (COD), total organic carbon (TOC), and total phenol (TP) content.
EC is a water treatment process that involves the application of electric current across metal electrodes to remove various contaminants. EC is an established wastewater treatment method that has been widely explored for a broad range of wastewater pollutants due to its ease of operation, versatility, eco-friendly nature, and low footprint [4]. EC is one of the treatment methods that can be used to remove high organic pollutants. EC was tested successfully to treat fluoride [5], polyvinyl alcohol [6,7], phenol [8], tannery [9], arsenic [10], humic substance [11], hydroquinone [12], and boron [13]. EC has also been proposed to treat various food industry wastewaters such as card boast [14], offset printing wastewater [15], landfill leachate [16], drinking water [17,18], textile wastewater [19], and olive mill wastewater [20].
EC consists of an in-situ generation of coagulants by an electrical dissolution of iron or aluminum electrodes. The metal ions generation takes occurs at the anode; hydrogen gas is released from the cathode. The hydrogen gas would also help to float the flocculated particles out of the water, and therefore, the process is sometimes named electroflocculation [21]. Typically, aluminum, iron, carbon, mild steel, graphite, and titanium plates are used as electrodes in the EC process. Iron and aluminum have been reported to be very effective and successful in pollutant removal at favorable operating conditions. In the case of aluminum, the main reactions are as follows:
Anode:
Cathode:
In the solution:
Amorphous Al(OH)3(s) flocks with large surface areas formed in aluminum anode are active in rapidly adsorbing of soluble organic compounds and trapping colloidal particles. They are easily separated from the aqueous medium by sedimentation or H2 flotation [22,23].
The originality of this study aimed to achieve complete treatment of pistachio processing wastewater. In the literature, studies carried out with electrochemical treatment methods have the feature of pre-treatment [24–26]. In the study, the system was operated in continuous mode. This system is a more realistic system for real industrial wastewater treatment. This study feature has brought a new perspective to the literature on this wastewater treatment. Aluminum was used as the anode material, and stainless steel was used as the cathode in the tubular reactor. The effects of initial pH, flow rate, current density, and supporting electrolyte type and concentration on the COD and TP removal efficiency were investigated.
The originality of this study aimed to achieve complete treatment of peanut processing wastewater. In the literature, studies carried out with electrochemical treatment methods have the feature of pre-treatment. In the study, the system was operated in continuous mode. This system is a more realistic system for actual industrial wastewater treatment. This study feature has brought a new perspective to the literature on this wastewater treatment.
2. Experimental
Wastewater samples used in the present study were obtained from a local pistachio processing plant with a daily capacity of 15 tons and producing approximately 90 m3 of wastewater daily in the city of Gaziantep (Turkey). Wastewater was filtered using a screen filter to remove large suspended solids before being used for the subsequent studies. Results of the chemical analysis of PPIW are given in Table 1. The pH of the wastewater was adjusted to the required value using 0.1 N nitric acid and sodium hydroxide. All chemicals were at analytical grade and supplied by Merck. COD and TP were determined as proposed by standard methods [27].
The removal efficiency [28] in PPIW treated by EC is calculated as follows:
where C0 is the initial COD and TP value (mg/L), Ct is the COD and TP value at t time.
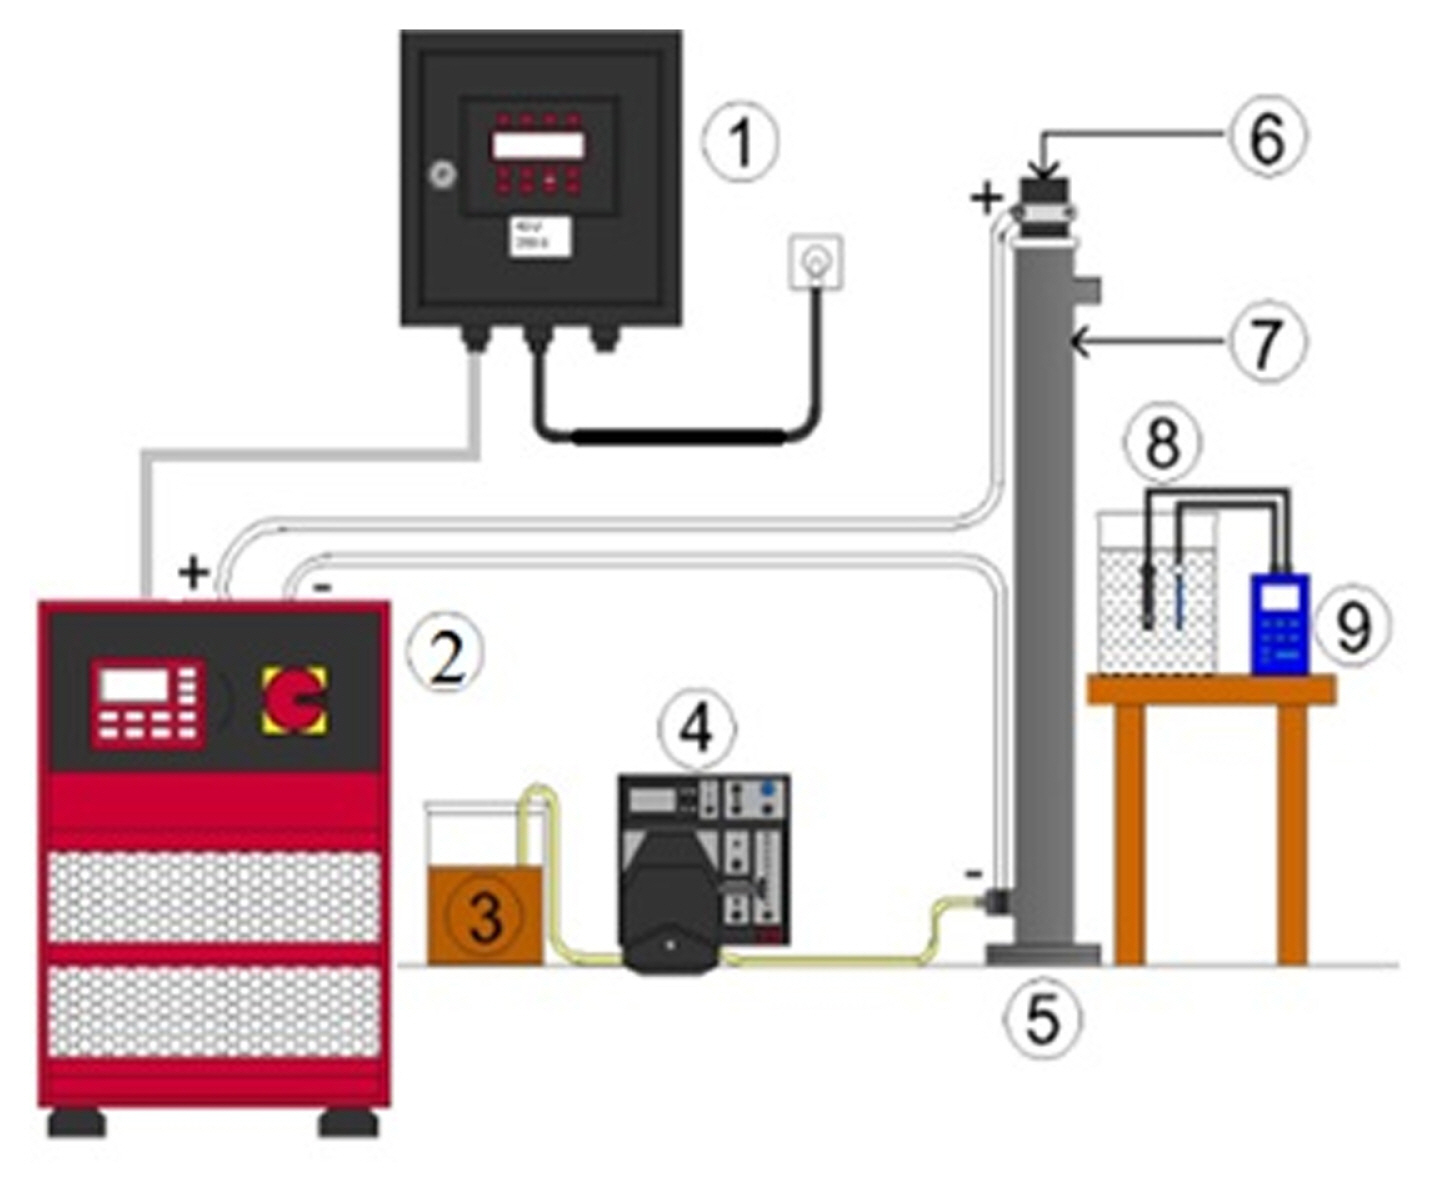
In the continuous EC systems, a tubular reactor with a total volume of 500 mL was used. It consisted of a telescopic stainless-steel cathode with an inner diameter of 60 mm and an aluminum anode with an outer diameter of 50 mm. A Chroma brand digitally controlled direct-current power supply (62024P-40-120 model 0–40 V, 1–120 A) supplied the required power. A WTW brand multi-meter was used to measure wastewater’s the pH, conductivity, and temperature at the beginning of the reaction and to read these values instantly during the reaction. The total surface area of the electrodes was 1400 cm2. The distance between the electrodes was 5 mm. The experimental setup is given in Fig. 1.
These experiments examined the effect of flow rate, initial pH value of the wastewater, current density, and supporting electrolyte type and concentration as wastewater parameters. The parameters that affect the EC process in removing COD and TP are shown in Table 2.
3. Results and Discussion
3.1 Effects of initial wastewater pH value
Initial pH values of 4, 5.2, 6, 7, and 8 were selected in the study to investigate the effects of initial wastewater pH values on COD, TP, energy consumption, effluent water temperature, and effluent water pH values. A current density of 10.5 mA/cm2 and a 25 mL/min flow rate were kept constant. In the experiments conducted in a 500-mL reactor with a 25 mL/min flow rate, wastewater stayed in the reactor for 20 minutes. At the end of this reaction time, the highest COD and TP removal efficiency was obtained at the pH value of 5.2, which is the natural pH value of wastewater. These results are shown in Fig. 2. In order to understand how to achieve the best COD and TP removal efficiency, it is important to examine the pH values of the effluent water. As seen in Fig. 2, the change of each initial pH value at the end of the reaction is given.
The highest Al(OH)3 formation level in the aqueous solution occurs in the pH interval of 6–8 [32]. The reason for obtaining the highest COD and TP removal at the initial pH level of 5.2 was that the pH value for the effluent water was in the optimum range for Al(OH)3 formation. COD and TP removal efficiencies decreased at pH values over and under 5.2. This result may be explained by the amphoteric nature of Al(OH)3, which cannot turn into its insoluble species at lower and higher pH values [33]. The literature features studies on different wastewaters with the method of EC, which investigated the effects of pH on COD and TP removal. Experimental conditions and removal efficiencies obtained from these studies are given in Table 3 [31–39].
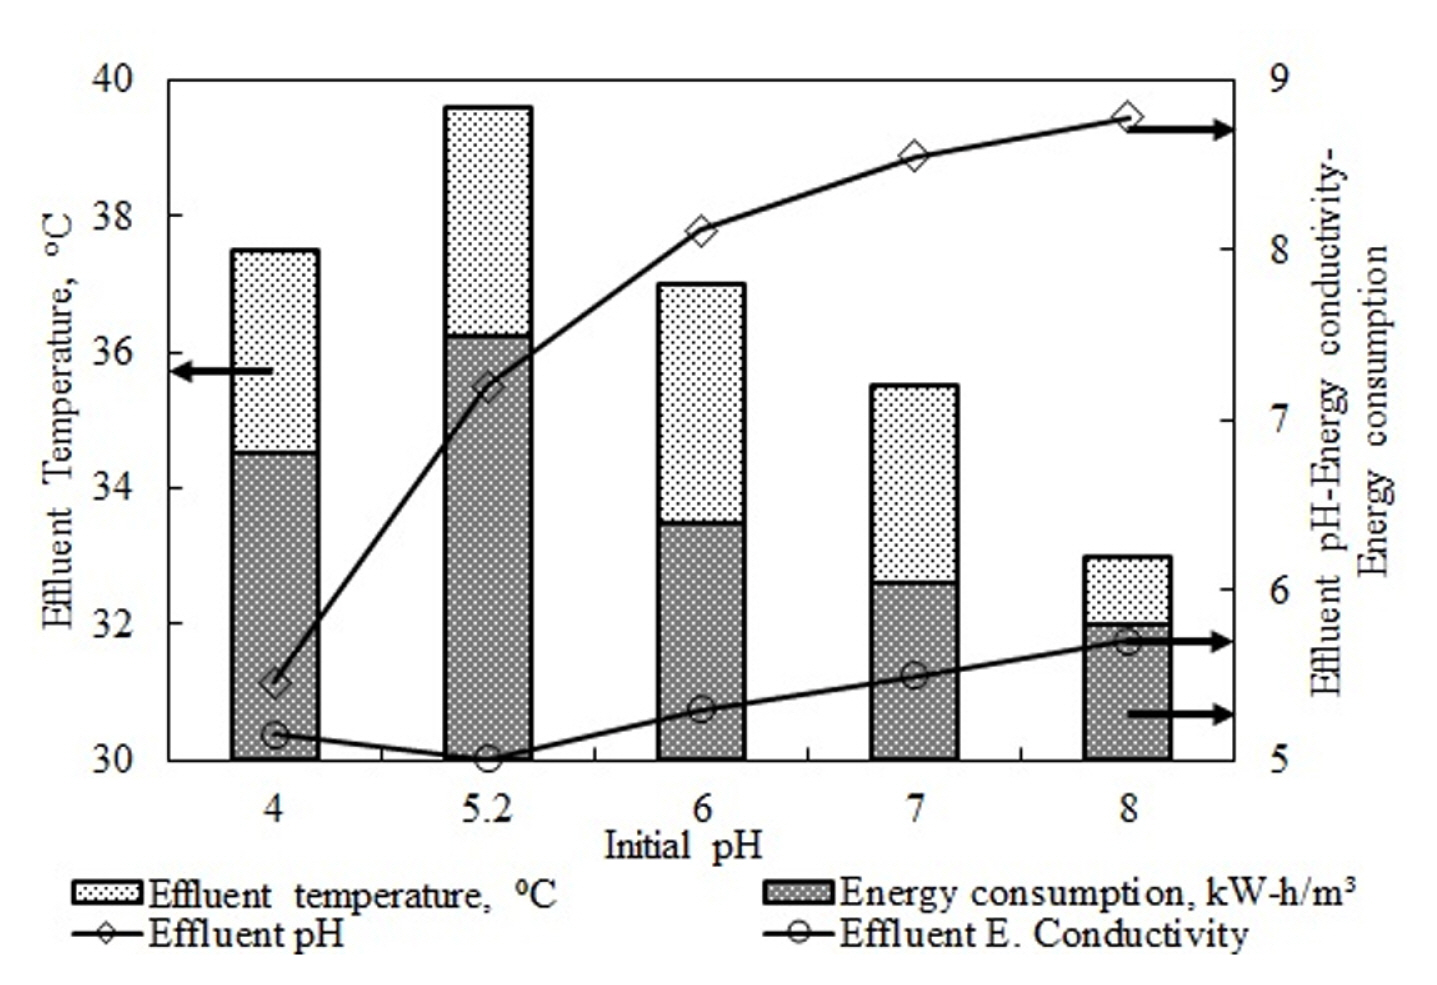
According to Table 3, while there were different COD and TP removal efficiencies in terms of differences in the type of wastewater, current density, and changes in the type of supporting electrolytes, all studies reported the optimum pH value as neutral. This complies with the optimum effluent pH value obtained in this study. These studies explained finding the optimum pH in the range of 6–8 as this range is the one that is necessary for Al(OH)3 formation, and the species with weak flocking properties and different solubility tendencies than Al(OH)3 among Al species are dominant outside this pH range. Fig. 3 shows the energy consumption and effluent water temperature values based on initial pH values.
The figure shows that both parameters changed based on the electrical conductivity value of the wastewater. The electrical conductivity found as 4.85 mS/cm for the wastewater at its natural pH value of 5.2 was lower than the values recorded at other pH values. The addition of acid and base to adjust the pH value increased the conductivity of the wastewater. The reason for this was the ions that were released as a result of the dissolution reactions of the base and the acid, as seen below.
Increased electrical conductivity of the wastewater reduces the voltage necessary for the constant current density applied to the system [40].
where Energy Consumption (kW h/m3) is electrical energy consumption, V is voltage (V), I applied current (A), t is treatment time (h), υ is the net reactor volume (wastewater volume in the reactor) (m3).
Eq. 8 shows that the increased voltage led to a linear increase in energy consumption. Considering these, as increased electrical conductivity will lead to reduced voltage, it is expected that the highest energy consumption would be at the natural pH value of the wastewater. Fig. 3 shows that the energy consumption decreased at the pH values where electrical conductivity was high. Increases in electrical conductivity led to a reduction of the resistance that is formed in the electrical field [40]. Increased electrical resistance increases effluent water temperatures as the energy applied to the system is converted into heat. This situation may be seen clearly in the electrical conductivity and effluent water temperature data in Fig. 3.
3.2 Effects of flow rate
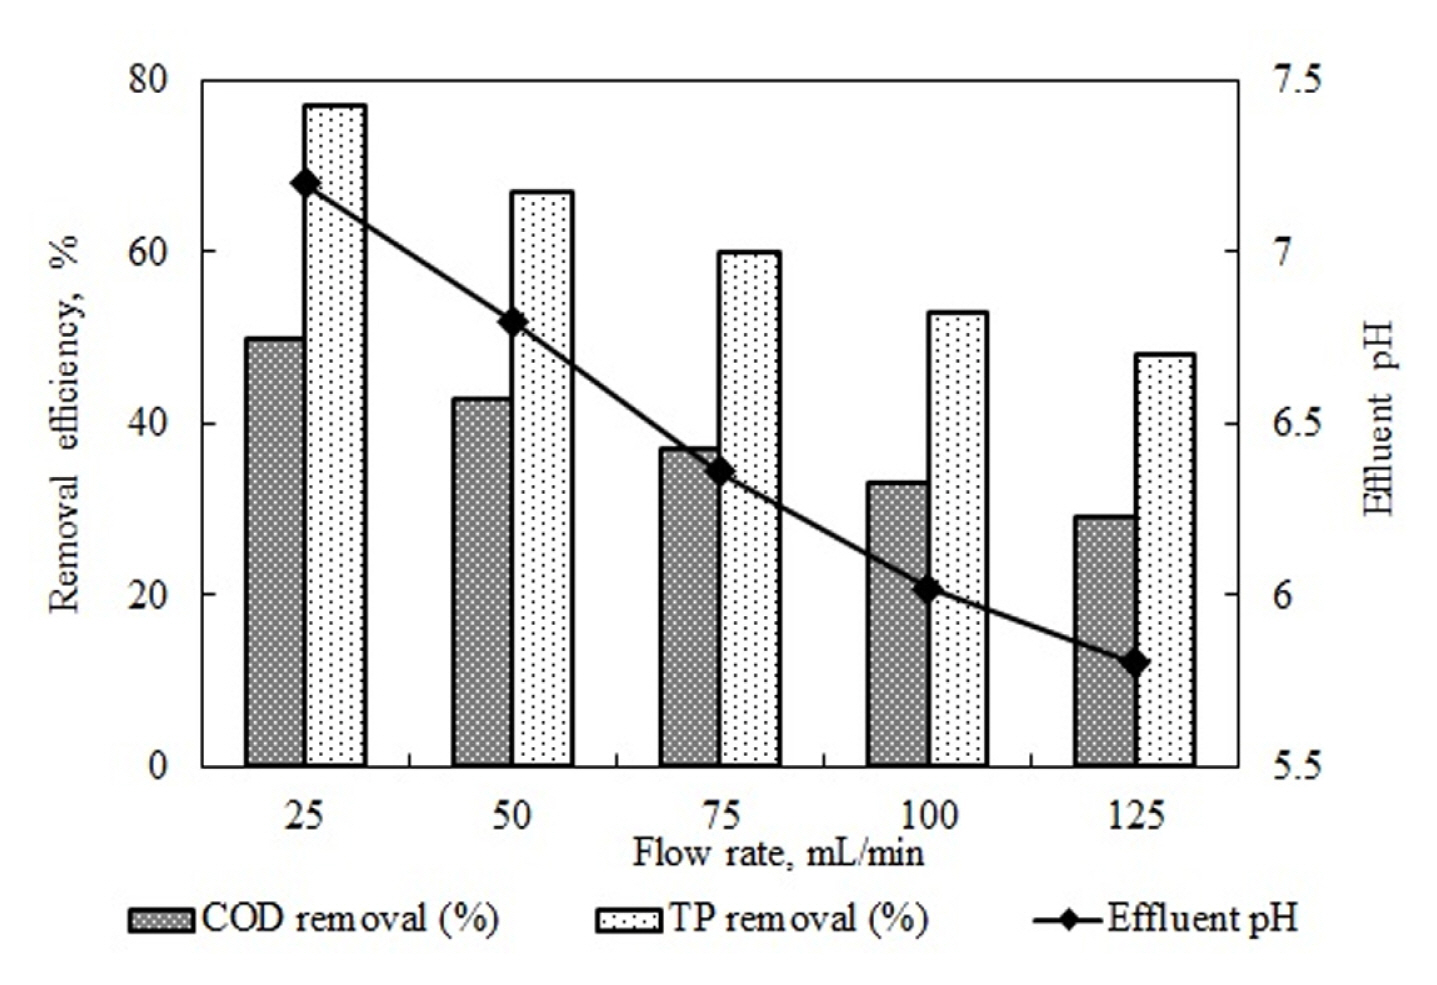
Experiments were conducted at 25–125 mL/min flow rates to investigate the effects of flow rate on COD and TP removal efficiency in peanut processing industry wastewater. These experiments were run at a setting with a current density of 10.5 mA/cm2, the natural pH value of wastewater at 5.2, and without a supporting electrolyte. In the 500 mL reactor, while the hydraulic retention time at a flow rate of 25 mL/min was 20, it was 10 min for 50 mL/min, 6.67 min for 75 mL/ min, 5 min for 100 mL/min, and 4 min for 125 mL/min. By increasing the retention time of the wastewater in the reactor from 4 min to 20 min, not only does the amount of coagulant substance electrochemically dissolved under constant current density increase but also the time the wastewater is exposed to the electrical field increases. The results are shown in Fig. 4.
As seen in Fig. 4, increased flow rate led to reductions in COD and TP removal efficiency. As the flow rate-dependent amount of Al(OH)3 flocks decreased, COD and TP removal efficiency levels decreased as its contact with the pollutant was reduced. The increased flow rate in the reactor reduced the dissolution of Al+ ions electrochemically, and therefore, the formation of Al(OH)3 and the hydrolysis of the water in the cathode region, leading to a decrease in the rise of pH values. While the pH value of the effluent water at the 25 mL/min flow rate was 7.2, this value dropped to 5.8 at the 125 mL/min flow rate. This reduced the reactor’s retention time and prevented the pH range necessary for Al(OH)3 formation. Therefore, reductions in COD and TP removal efficiencies may be explained as a function of both decreased retention time and failure to achieve a suitable pH range. Table 4 outlines studies that investigated the treatment of different wastewaters using continuous EC processes [19,33,41–47].
While the studies were conducted at different current densities, flow rates, and optimum pH values, the common characteristic was that the optimal removal efficiency was achieved at the lowest flow rates. The results obtained here were in parallel with the literature. The changes in the post-reaction effluent water temperature and energy consumption values in experiments that investigated the effects of flow rate on COD and TP removal efficiencies are shown in Fig. 5.
Increased flow rate leads to reductions in energy consumption, effluent water temperature, and electrical conductivity. The reason for the significant decrease in energy consumption values by increased flow rate, according to Eq. 8, came from the linear relationship between energy consumption and retention times. As the increased flow rate led to a reduction in retention time, it led to reaching lower energy consumption values under the same current density. This was an expected result. Differences in the effluent temperature values were also caused by the changes in the electrical resistance that took place due to changes in retention time. Decreased retention time as a result of high flow rates leads to reduced conversion of the total energy given to the system into heat energy as it leads to a reduction in the electrical resistance under constant current density. This situation led the effluent water temperature values to stay lower. The electrical conductivity value decreased although this decrease was not significant because disintegration of the pollutants decreased due to reduced retention times.
3.3 Effects of current density
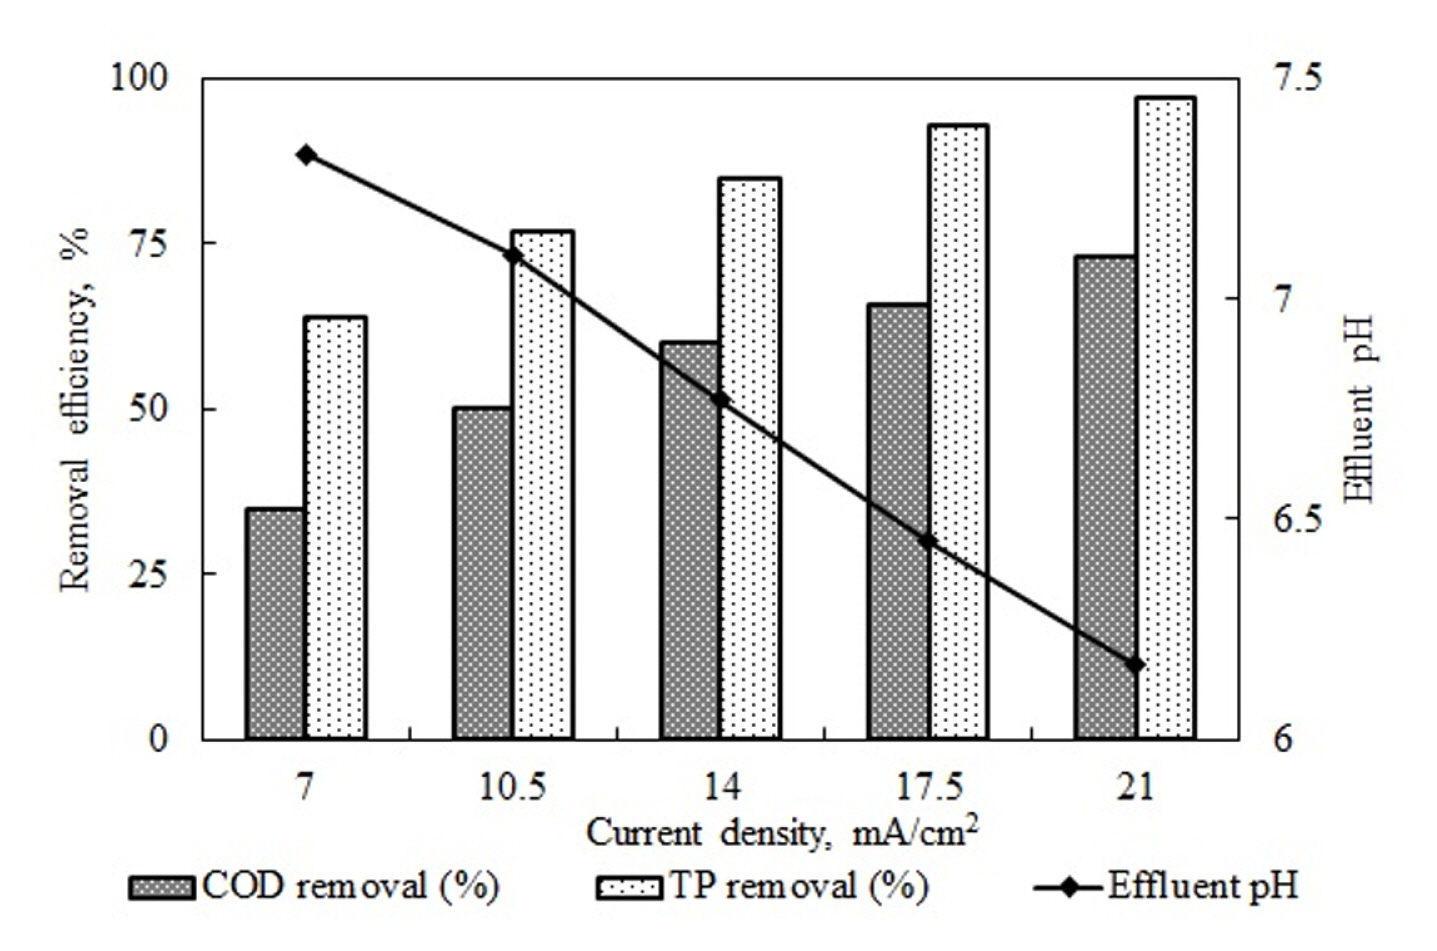
The continuous EC experiments were run at 7–21 mA/cm2 to investigate the effects of current density on COD and TP removal efficiency, energy consumption, and effluent water temperature. The study held concentrations of 16500 mg/L COD and 4000 mg/L TP, a natural pH value of 5.2, and a 25 mL/min flow rate, corresponding to a 20-minute retention time as constants. While the removal efficiency reached 35% COD and 64% TP at a current density of 7 mA/cm2, it reached 75% COD and 97% TP at a current density of 21 mA/cm2.
The numerical results showed that increased current density led to an increase in removal efficiencies. According to Faraday’s law
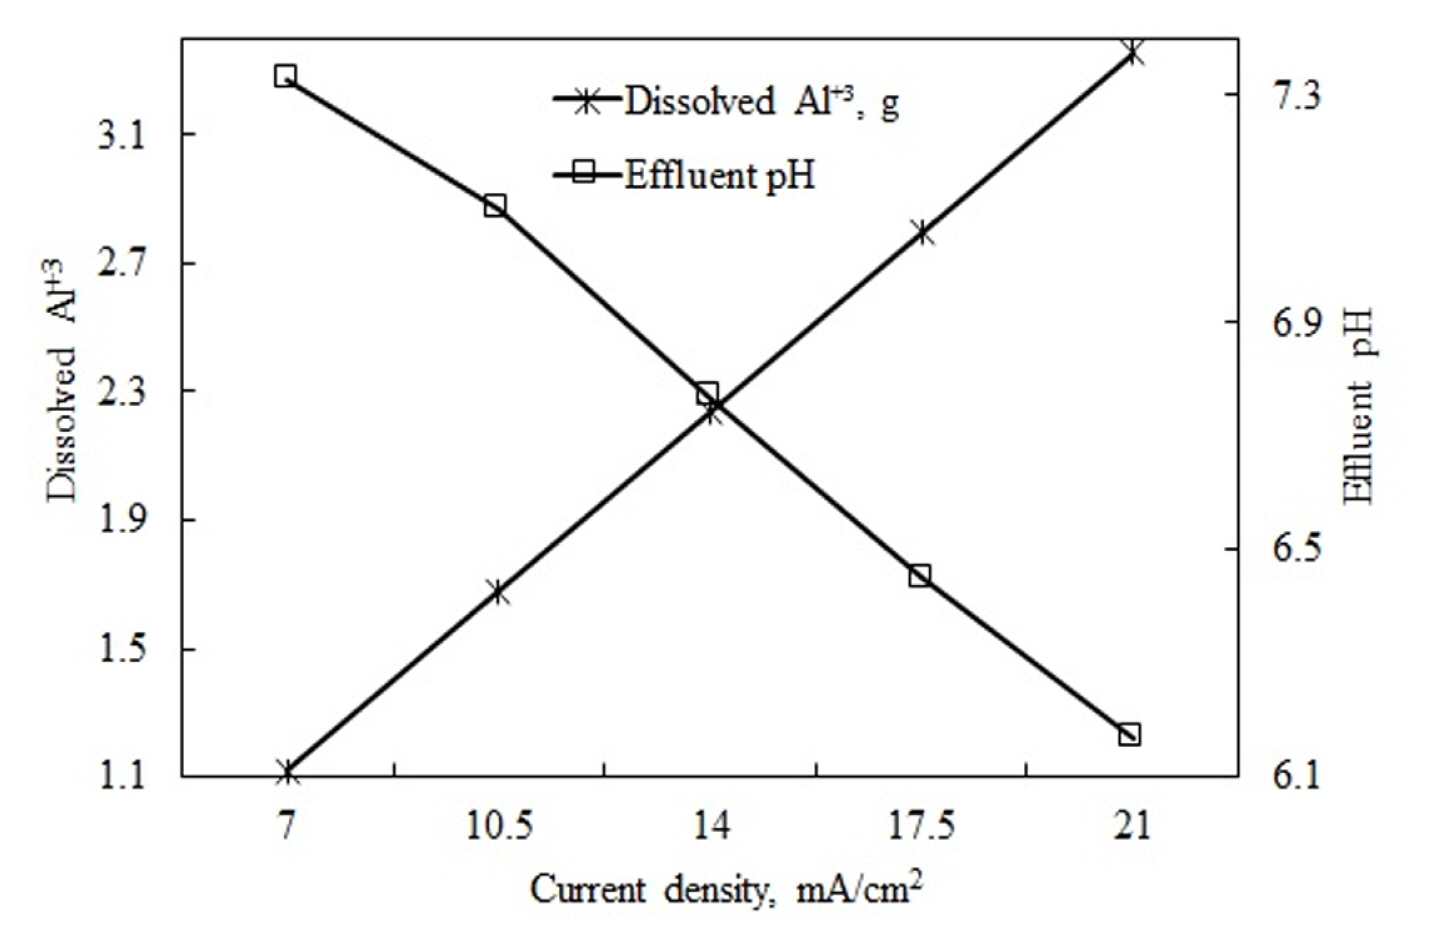
m is the coagulants released from the anode (g), I is the current applied in amperes, t is the electrolysis time (second), Ma is the molecular weight (26.98 g/ mol), Z is the number of electrons, and F is Faraday’s constant (96487 C/mol). The substance amount was determined using this equation. As seen in Eq. 9, the increased current density theoretically increases the amount of coagulants. As the increased coagulant quantity contacted the constant amount of pollutant more, the removal efficiency increased accordingly. Fig. 6 shows that the changes in effluent water pH remained in the range of 7.3–6.2 in all current densities. Fig. 7 shows the quantities of theoretically dissolved Al3+ and effluent pH values.
According to the data, for all theoretically dissolved Al3+ quantities, the pH value was in the range of 6–8, which is the optimum range of Al(OH)3 formation. In this case, it is seen that increased current density led more Al3+ to turn into Al(OH)3. The increased current density in the suitable pH range led to increases in pollutant removal efficiencies as it led to the formation of higher quantities 1of coagulant substances. Table 5 outlines investigating current density’s effects on pollutant removal efficiencies in continuous and batch EC processes [48–55].
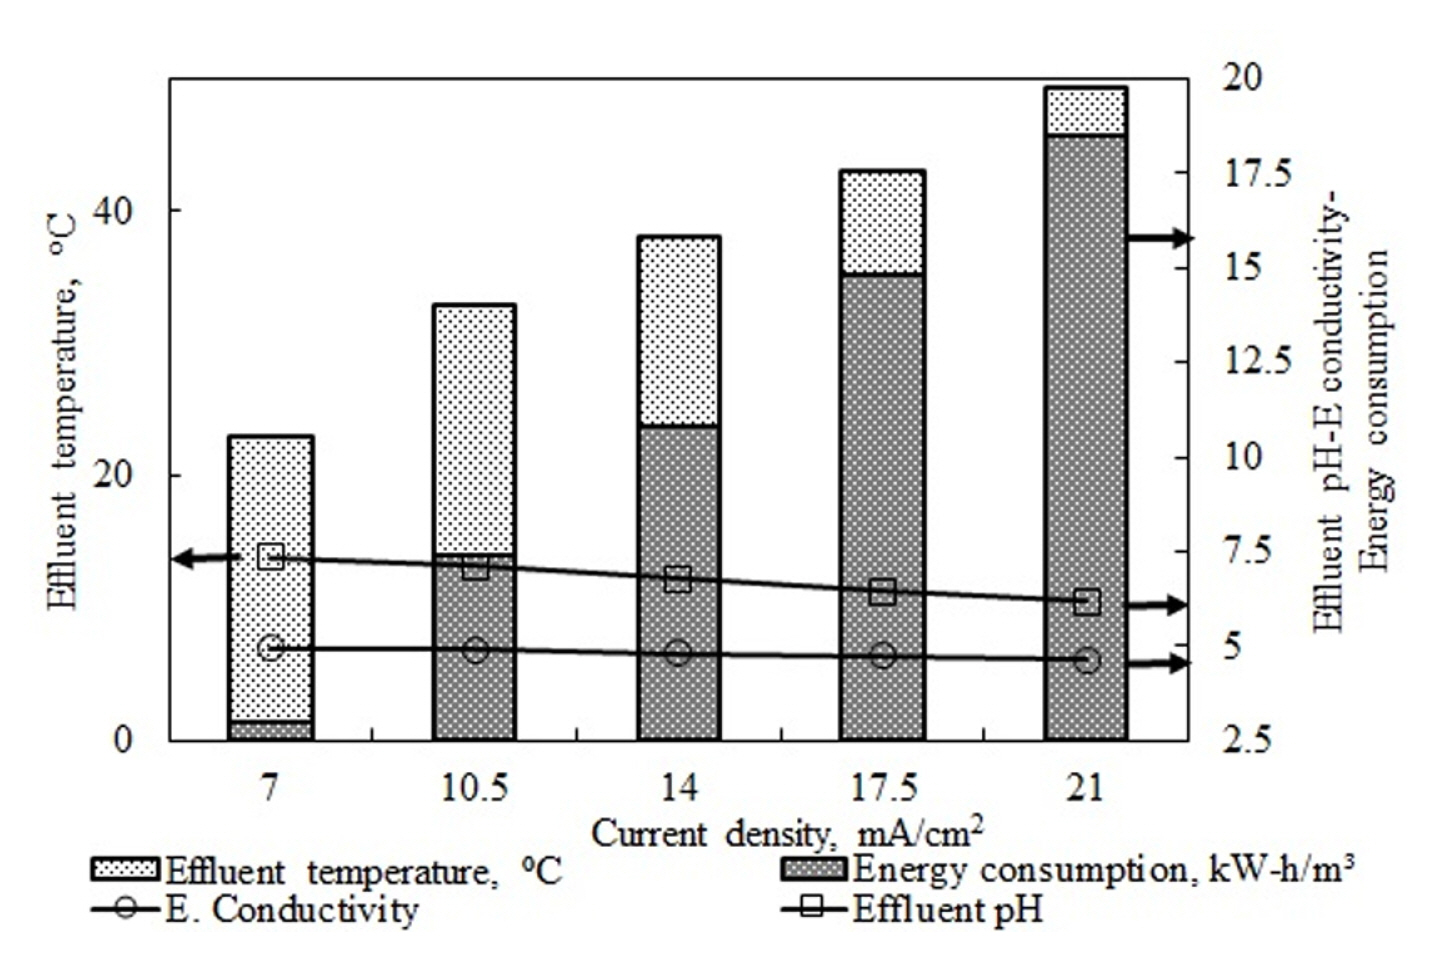
In these studies, different current density ranges were used for different types of pollutants. In two studies, while increasing current density up to a point led to increased removal efficiency, using higher current densities led to a decrease. The authors did not explain the reason for this. The studies cannot be interpreted as the effluent water pH values were not provided. In the other reviewed studies, increased current density values positively affected pollutant removal efficiency. The best removal efficiency values were all obtained at the highest current density values. The results of this study also showed that increased current density led to increases in COD and TP removal efficiencies. Fig. 8 shows the post-reaction changes in the effluent water temperature values and energy consumption in experiments investigating the effects of current density on COD and TP removal efficiencies.
Fig. 8 shows that increased current density led to a significant increase in energy consumption. Increasing the current density in wastewater with constant electrical conductivity led to increases in the voltage values applied to the system. As seen in Eq. 8, increases in the current and voltage values on the right side of the equation by increases in current density led to a significant increase in energy consumption values. The energy consumption at a current density of 7 mA/cm2 was 3 kW h/m3, while it was measured at 21 mA/cm2 as 18.5 kW h/m3. The numerical results also supported the situation described above. Increases in the current density led to an increase in effluent water temperature values as it increased the electrical resistance in the system. This may be seen in Fig. 8. The initial pH value of the wastewater was held constant at 5.2 in experiments that investigated current density. The initial electrical conductivity value in all experiments at this pH value was the same and it was measured as 5.2 mS/cm. Effluent water electrical conductivity values decreased as a result of increased current density. It is believed that this was caused by increased current density, which led to higher removal of pollutants in experiments that were run in pH intervals suitable for Al(OH)3 formation, and the quantity of ions in the solution decreased. While an effluent water conductivity value of 4.95 mS/cm was obtained at the current density of 7 mA/cm2 where the lowest COD and TP removal was achieved, this value was found as 4.65 mS/cm at the current density of 21 mA/cm2 where the highest removal values were obtained.
3.4 Effects of type and concentration of supporting electrolyte
To determine the effects of the type of supporting electrolyte on COD and TP removal efficiency in peanut processing wastewater, NaCl, NaNO3, and Na2SO4 were used as supporting electrolytes. The supporting electrolyte concentration in type determination experiments was kept in the range of 10–100 mM for each type of salt. The experiments held a current density of 10.5 mA/cm2, 25 mL/min flow rate, and an ambient pH value of 5.2 as constants. Among the investigated types of supporting electrolytes, the best COD and TP removal efficiencies were obtained. This is shown in Table 6.
As seen in the table, while NaNO3 usage decreased the removal efficiencies of both COD and TP, increased NaNO3 concentration did not affect removal efficiencies. The main reason for the unaffected removal efficiency values was that effluent water pH values increased and remained over the pH range necessary for Al(OH)3 formation. Increased concentration of NaNO3 reduced the energy consumption values as it increased the quantity of ions in the solution and, therefore, electrical conductivity. Using Na2SO4 as a supporting electrolyte decreased the COD and TP removal efficiency significantly compared to the case where no supporting electrolyte was used. Increased Na2SO4 concentration led to an increase in the rate of reduction of removal efficiency. As reported by the studies of Maitlo et al. and Eryuruk et al., this is caused by the passivation on the anode surface created by SO42− ions [40,56]. Although it contained more ions than the other types of supporting electrolytes with the same molar mass, it had higher energy consumption values, as seen in Table 6, which supports the explanation of anode passivation. The removal efficiencies obtained in the experiments with NaCl were higher than those in the cases where no supporting electrolytes were used.
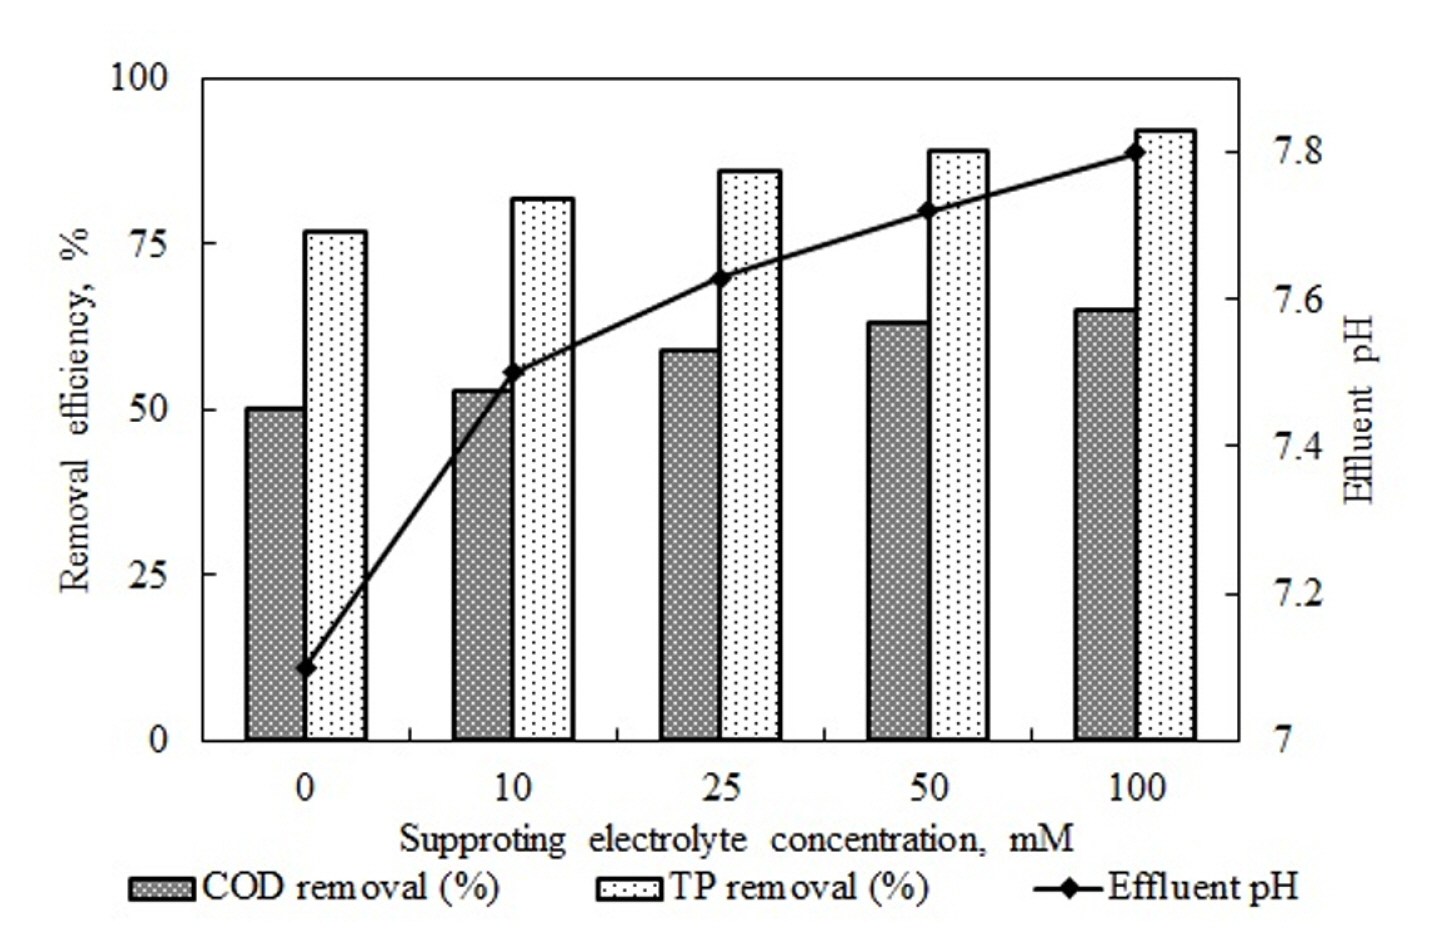
As seen in Fig. 9, removal efficiency values for COD and TP increased in line with increased NaCl concentration. Increases in NaCl concentration not only increased the electrical conductivity of the wastewater they also increased the conversion of the Cl− ion into oxidants with high oxidation capacity as a result of the following reactions in the electrical field.
Anodic reactions:
Solution reactions:
Cathodic reactions:
In addition to the coagulation mechanism of the pollutant, this situation also contributed to its conversion into stable end products by oxidation. As seen in the figure, an increase in the concentration of supporting electrolytes led to an increase in the effluent water pH value. The decomposition of oxidants resulting from the reaction shown as 2.16 leads to an increase in the pH value. Table 7 shows EC studies using supporting electrolytes [56–62].
As seen in the table, different types and concentrations of supporting electrolytes were used for different wastewater. The most frequently utilized types of supporting electrolytes were NaCl, Na2SO4, and NaNO3, which were also used in this study. NaCl was usually reported as the type of supporting electrolyte which provides the best removal efficiency. This was shown in the table’s column of optimum supporting electrolyte type. This study obtained similar results. It was seen that increased NaCl concentration increased the removal efficiency [60–62]. The decrease in COD and TP removal efficiency observed in this study by using the supporting electrolyte Na2SO4 was also supported in previous studies in the literature [40,56]. Fig. 10 shows the energy consumption values calculated with the help of voltage values that arose in the system under constant current density values in the experiments investigating the effects of NaCl concentration and the electrical conductivity values based on increases in effluent water temperature and concentration.
While the energy consumption value in the experiments that did not use supporting electrolytes was 7.4 kWh/m3, this value was calculated as 1.8 kW h/ m3 at a 100 mM NaCl concentration. An increase in the concentration of the supporting electrolyte also led to an increase in the electrical conductivity of the wastewater. This situation led to a decrease in the voltage applied to the system, and therefore a reduction in energy consumption values under constant current.
4. Conclusions
Consequently, the parameters of pH, flow rate, current density, and type and concentration of supporting electrolytes, which affect the treatment of peanut processing wastewaters via continuous EC processes, were investigated, and the following results were obtained.
In the experiments where the initial pH value was investigated, the best COD and TP removal efficiency values were obtained at the natural wastewater pH value of 5.2. Removal efficiency decreased in pH values under and over this. The highest energy consumption value was found at the natural pH value of the wastewater with the lowest electrical conductivity. While this situation seems to contradict the principle of maximum removal efficiency – minimum energy consumption, there was no large difference among the energy consumption values as the natural conductivity of wastewater is a high value of 4.9 mS/cm.
The effects of flow rate on removal efficiencies were investigated by keeping the current density of 10.5 mA/cm2 and the pH value of 5.2 constant. It was observed that increased flow rate decreased COD and TP removal efficiency as it reduced the retention rate of the wastewater, and the best removal efficiencies were found to be 50% and 77% for COD and TP, respectively. These results were obtained optimally at a of 25 mL/min flow rate. Increases in the retention time in the reactor led to a decrease in both the energy consumption values and the effluent water pH values.
The flow rate of 25 mL/min and the pH value of 5.2 were held constant, experiments were run at the current rates of 7, 10.5, 14, 17.5, and 21 mA/cm2, and it was found that increased current density led to an increase in removal rates of COD and TP as it increased the quantity of dissolved coagulants. As the pH values for all current density values in the study were in the range suitable for Al(OH)3 formation, increases in current density led to increases in COD and TP removal efficiency. Energy consumption values increase exponentially as both the current and accordingly the voltage values increase. While energy consumption was 3 kW h/m3 for 7 mA/cm2, it rose to 18.5 kW h/m3 for 21 mA/cm2. While the dramatic increase in energy consumption values led to an increase in removal efficiency value, it showed that current density cannot be increased without a limit.
The flow rate of 25 mL/min, pH of 5.2, and current density of 10.5 mA/cm2 was held constant, and experiments were carried out for types and concentrations of supporting electrolytes. The highest COD and TP removal efficiency values were found in the supporting electrolyte of NaCl. Increases in NaCl concentration affected the removal rates positively.
As a result of the study, considering the optimum removal efficiencies of COD and TP, the suitable values were selected as pH 5.2, flow rate of 25 mL/min, current density of 10.5 mA/cm2, and supporting electrolyte of 25 mM NaCl. The study obtained removal rates of 60% COD and 90% TP in these conditions, with an energy consumption rate of 4.2 kW h/m3. Based on the optimum results, it was concluded that the system may be used for the treatment of TP and pretreatment of COD. Among the parameters examined, current density is the parameter that most affects pollutant removal efficiency and energy consumption. Increasing current density increases removal efficiency and energy consumption at optimum pH and flow rate. Therefore, excessively increasing the current density is unacceptable, considering the operating costs.