1. Introduction
Polymer electrolyte membrane fuel cells (PEMFCs) have gained interest as a viable alternative energy source due to their temperature operation and suitability for powering electronic devices and vehicles [1ŌĆō4]. Among the various types of PEMFCs, direct alcohol fuel cells (DAFCs) utilize alcohol as a fuel source, offering advantages such as high energy density, a low environmental impact, and the use of renewable fuels. DAFCs are a modified version of PEMFCs that primarily employ ethanol and methanol instead of hydrogen gas. Alcohol is obtained through various methods and is a promising candidate for power generation. With the DAFC technology, producing electricity using alcohol as a fuel could become more accessible and efficient [5,6]. DAFCs employ electrodes coated with electrocatalysts, facilitating alcohol oxidation at the anode and oxygen reduction at the cathode. The convenience and cost-effectiveness of PEMFCs make them appealing for replacing internal combustion engines in various applications.
In DAFCs, co-catalysts are necessary to enhance the sluggish kinetics of alcohol oxidation at the anode. Nevertheless, the electrocatalysts utilized in DAFCs must exhibit high reactivity, long-term stability, and cost-effectiveness [7,8]. Carbon-supported platinum (Pt/C) is a common electrocatalyst in DAFCs in DAFCs but is susceptible to fuel impurities and corrosion, which necessitate high platinum loading and resulting in high costs [1,9,10]. Researchers have explored alternative approaches to address these challenges, including alloying with multi-metallic Pt and PtRu-based composites electrocatalysts with nonŌĆōnoble transition metals such as Ni, Co, Fe, Cu, W, Sn, and Mo. These non-noble transition metal-based electrocatalysts have been demonstrated to improve catalytic activity and stability, offering a potential solution to the limitations of Pt/C electrocatalysts [11ŌĆō13].
Transition metals have been extensively studied as support electrocatalysts in DAFCs due to their ability to resist CO poisoning and reduce the cost of Pt loading. Incorporating a second or third oxophilic metal, such as Mo, can improve CO tolerance through a bifunctional process [14ŌĆō18]. Molybdenum (Mo) is a new type of advanced electrocatalyst (EC) that has shown promise for use in fuel cells, metal-air batteries, and supercapacitors. Molybdenum has an oxyphilic nature and can exist in multiple oxidation states, making it a desirable candidate for co-catalyst materials that promote CO oxidation at a lower potential. Mo-based electrocatalysts (Mo-ECs) exhibit remarkable catalytic activity, durability, tunability, and reduced potential for water dissociation. These properties make Mo-ECs superior to pure catalysts while being cost-effective [1,2].
Interestingly, Mo alloyed with Pt exhibits more accessible water dissociation abilities than pure Pt [19]. MultiŌĆōmetallic composite nanostructures have gained interest due to their improved electrocatalytic performance compared to commercial Pt/C [20,21]. MolybdenumŌĆōbased electrocatalyst nanomaterials, collectively referred to as Mo-ECs, including PtŌĆōMo alloys, Molybdenum oxide (MoOx), Molybdenum carbide (MoC or Mo2C), Molybdenum nitride (MoN), molybdenum sulfide (MoS2), and graphene/CNTs supported Mo nanostructures (Graphene/CNTs/Mo). It significantly reduces the onset potential and dramatically increases the power and current densities. This study aims to investigate various Mo-ECs used as support catalysts in DAFCs,
Over the past two decades (1998ŌĆō2022), extensive research has been conducted on various Mo-ECs as co-catalysts for potential use in DAFCs. These investigations have led to significant advancements in synthesis techniques and resulted in notable scientific breakthroughs, particularly in the development of highly stable enriched Pt and PtŌĆōfree Mo-ECs for DAFCs. This report critically evaluates the design and development of Mo-ECs for their specific application in direct alcohol fuel cells (DAFCs). Our investigation focuses on the electrocatalytic processes of Mo-ECs, particularly methanol oxidation and ethanol oxidation, aiming to understand their importance within the context of DAFCs comprehensively. This report does not cover electrocatalytic reactions such as the hydrogen evolution reaction (HER), hydrogen oxidation reaction (HOR), and oxygen evolution reaction, as they are not directly involved in DAFCs. Furthermore, this report includes a comprehensive analysis of the structural, spectroscopic, and electronic properties of Mo-ECs electrocatalysts utilizing advanced characterization techniques such as Fourier transform infrared spectroscopy (FTIR), X-ray diffraction (XRD), X-ray photoelectron spectroscopy (XPS), and X-ray absorption spectroscopy.
2. Components of direct alcohol fuel cells
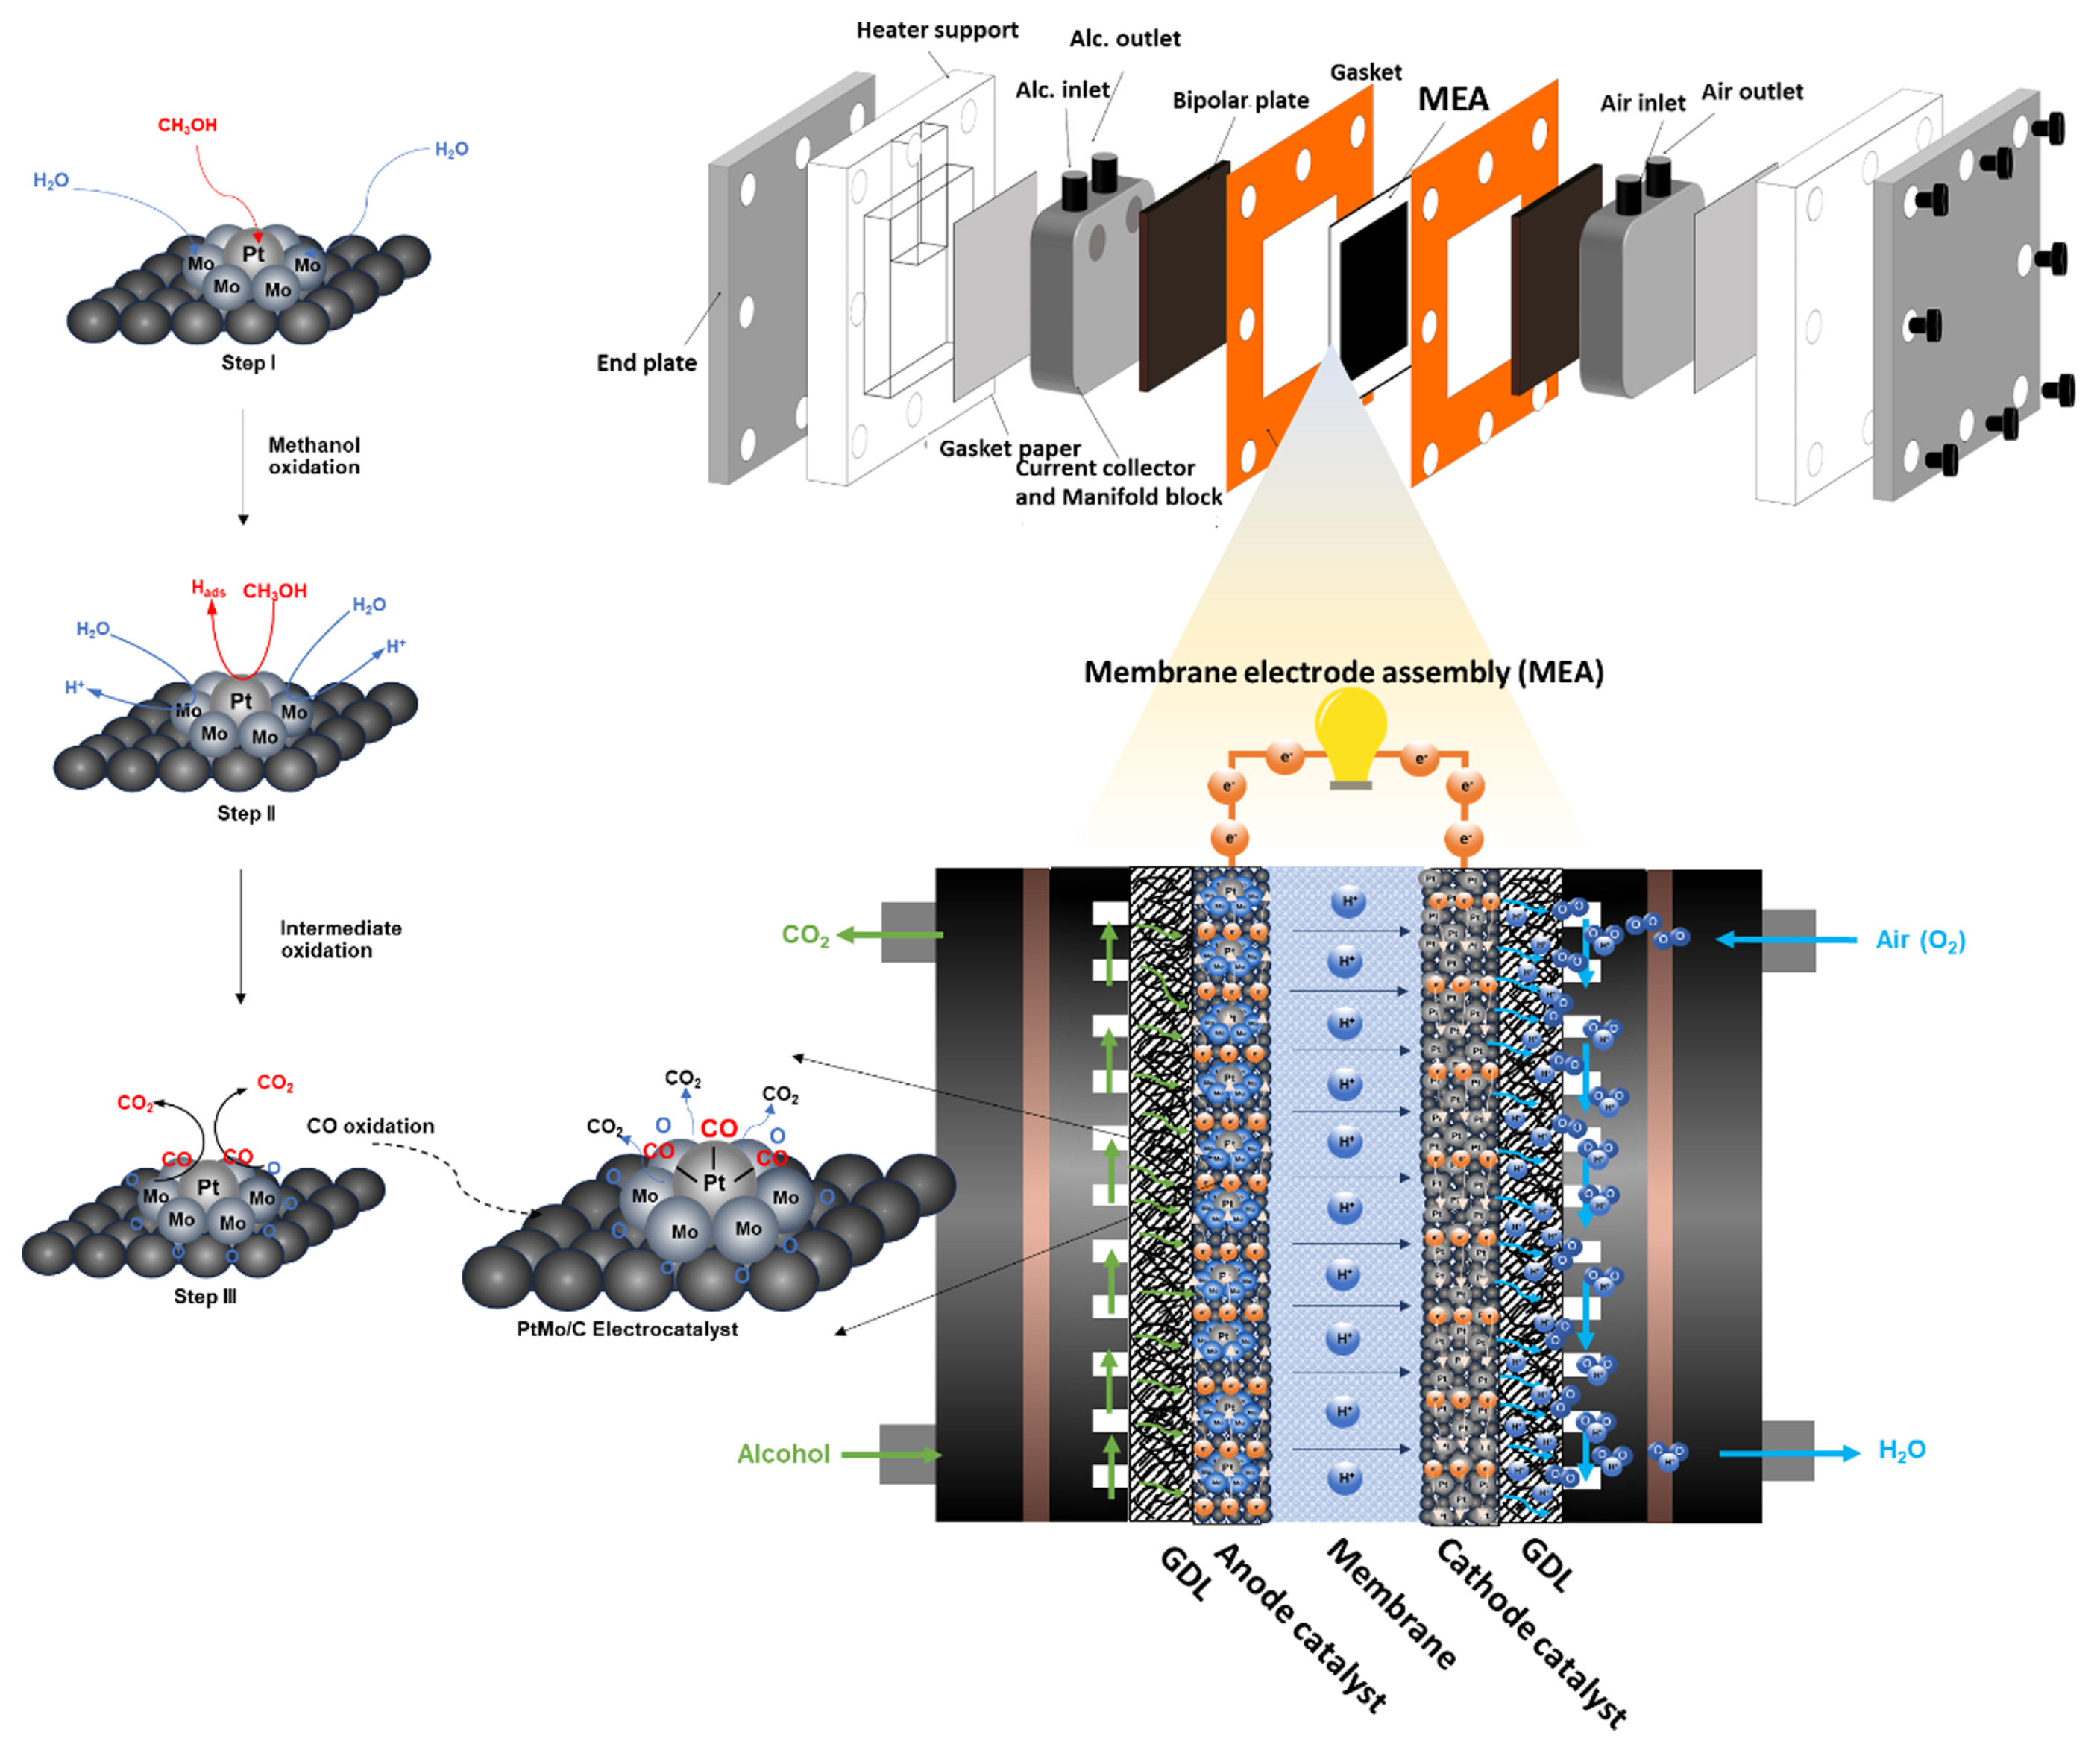
The basic components of DAFCs include the membrane electrode assembly (MEA), bipolar plate, gasket, and current collector and end plate. A schematic diagram of DAFCs component is presented in Fig. 1. The heart of a DAFCs is MEA, which comprises three primary components including membrane and gas diffusion layer (GDL) and catalyst layer. Typically, these components are compacted into 5-layers sandwich as follows:
The membrane, placed at the core of MEA sandwich, acts as the selective passage of protons (H+) and facilitates electrochemical reactions between hydrogen and oxygen. The gas diffusion layer (GDL) is a porous material that assists in transporting reactants and products, prevents direct contact between the electrodes and reactants, and manages water during electrochemical reactions. The catalyst layers consist of two electrodes: (i) the anode catalyst, which is the negative electrode, initiates the alcohol oxidation reaction. (i) the cathode catalyst, which is a positive electrode, serves an oxygen reduction reaction. The direction of a half and total redox reaction of alcohol in a DAFCs is as follows:
In addition, other components are critical for achieving maximum potential. Bipolar plates, placed on both sides, serve to separate individual cells in a fuel cell, provide a conductive path for electrons, and include flow fields for reactants as well as coolant channels to maintain stack integrity. A current collects the electrons generated by the electrochemical reaction and transfers them efficiently to the external circuit, which requires excellent electrical conductivity and durability. The endplate is a crucial component that is placed at the end of the cell. The key function is providing uniform pressure distribution, reducing contact resistance, and providing structural support.
3. Bifunctional mechanism
The bifunctional mechanism in electrochemistry refers to a phenomenon where catalytic reactions occur simultaneously at the same electrode but involve different catalytic sites with distinct electrochemical properties. These processes are interdependent, meaning the rate of one reaction can impact the other. In DAFCs, two electrochemical processes occur during the alcohol oxidation reaction (AOR): the adsorption/desorption of intermediate species and water at one active site and the alcohol oxidation at different active sites on the same electrocatalyst surface. For example, in the case of methanol oxidation with Mo-ECs (as illustrated in Fig. 2), the process involves the conversion of reactants (methanol) into intermediates (such as CO) and ultimately into products (such as CO2). This complex reaction pathway gives rise to various intermediates formed through different pathways [2,5]. During alcohol oxidation, full oxidation can occur through deprotonation or the absorption of hydroxyl groups by the intermediate species. These processes involve the interplay of different active sites on the electrocatalyst surface.
Fig. 2 presents a summary of the oxidation reaction of methanol by Mo-ECs in DAFCs. The deprotonation of methanol (path 1) is a sixŌĆōelectron process in which six pairs of protons and electrons are released during the conversion of methanol to CO2. As in path 2, different complex species are formed by the abstraction of proton H+ and the adsorption of OHŌłÆ ions [6]. Typically, methanol molecules can be activated via hydrogen abstraction from either carbon or oxygen atoms at the catalyst surface. Continuous abstraction of hydrogen/protons can create a large number of intermediate species, including formaldehyde (HCHO), formyl (CHO), formic acid (HCOOH), and carbon monoxide (CO).
Typically, methanol oxidation can be described in four steps. In the first step, methanol molecules adsorb onto the catalyst surface through the carbon atom, facilitated by Pt sites and water molecules by MoŌĆōsites. The second step involves the oxidation of the adsorbed methanol and water molecules at their respective sites. The PtŌĆōMo electrocatalyst breaks water molecules into hydroxyl groups (OHŌłÆ) and hydrogen ions (H+), which are then adsorbed on the Mo and Pt surfaces. During the reaction, partially oxidized methanol intermediates, mainly CO, are adsorbed on the Pt surface. However, the strong affinity of CO towards the Pt surface decreases the active surface area for further oxidation of methanol. In step three, the Pt and Mo active sites nearby bind the CO and OH species. Finally, in the fourth step, CO is oxidized by the OH species, forming CO2 and water as the final products of methanol oxidation. The hydrogen ions from water dissociation react with the electrons from methanol oxidation to form water. In this bifunctional mechanism, the Pt sites serve as methanol adsorption sites, while the Mo sites facilitate water dissociation and promote the reaction between hydroxyl groups and methanol. These two active sites work together to improve the efficiency and selectivity of the methanol oxidation reaction (MOR). The Mo sites are crucial in minimizing the formation of undesired intermediate products, such as formaldehyde and formic acid, during methanol oxidation.
The overall reaction for ethanol oxidation using a PtŌĆōMo electrocatalyst based on a bifunctional mechanism is shown in Fig 3. The typical electrochemical conversion of ethanol to CO2 involves five steps. Firstly, the Pt facilitates the breaking of the CŌĆōC bond in ethanol, which is the rate-limiting step in the reaction, whereas the activation of H2O oxidized to OHŌłÆ species on the Mo-site is the rate-determining step [7]. In the first step, ethanol is adsorbed dissociative on the Pt surface, which is observed at a low potential [8]. In step 2, dissociative adsorbed ethanol molecules are transformed into intermediate species, such as acetaldehyde, by abstracting proton/electron pairs from the ethanol molecules. In step 3, OH species at the active Mo sites facilitated the oxidation of acetaldehyde to acetic acid (Eq. 4). In step 4, the partially dehydrogenated ethanolic species undergo CŌĆōC bond cleavage with the formation of PtŌĆōCO and a methoxy linkage (MoŌĆōCH3OH) (Eq. 5) [9]. The PtŌĆōsites initiate the cleavage of the CŌĆōC bond and the formation of CO species from the intermediate species, as shown in the following reaction [10]:
In the final step, the PtŌĆōMo alloy can suppress CO poisoning, a common issue with other electrocatalysts. CO poisoning occurs when CO molecules adsorb onto the catalyst surface and block the Pt active sites (PtŌĆōCO), thereby reducing electrocatalytic activity. The active sites (MoŌĆōOH and PtŌĆōOH) on the PtŌĆōMo electrocatalysts effectively oxidized CO molecules and CH3OH via the abstraction of proton/electron pairs, preventing the accumulation of CO species on the catalyst surface.
According to existing research, in monometallic Pt/C catalysts, CO is produced as an intermediate species that blocks the active site and restricts the rate of methanol oxidation in the anode because of its relatively high stability [11,12,22]. Mo-based electrocatalysts serve as sites for the oxidation of methanol and water. A key aspect of their bifunctional mechanism is the presence of numerous active sites on their surfaces capable of adsorbing methanol and facilitating its oxidation. These active sites typically consist of MoŌĆōOH [8,13ŌĆō15], MoOx(OH) [15ŌĆō18], HxMoOx [16,20,23,24], MoŌĆōOŌĆōMo, Mo2CŌĆōOH, MoS2ŌĆōOH [21] groups that can form strong chemical bonds with methanol [17]. The oxidation process commences when a methanol molecule adsorbs onto an active site on the surface of Mo nanoparticles. It is also worth noting that the spectroscopic data suggest that the Mo surface atoms have multiple O and OH ligands at all potentials, which effectively oxidize CO on neighboring Pt sites. This results in a bifunctional mechanism similar to that observed for PtŌĆōRu alloys. However, the O/OH ligands on the surface are insufficient for CO oxidation. They must react with CO and quickly regenerate via extraction from H2O. Another mechanism that may contribute to CO oxidation is the reactivity of CO adsorbed on the Pt sites, possibly through an electronic interaction between Pt and Mo. It is probable that both mechanisms play a role or are interconnected. In the case of Mo-based electrocatalysts, methanol oxidation occurs through a bifunctional mechanism, which can be expressed as follows [14,15,25,26].
4. CV analysis of alcohol electrooxidation reaction
Cyclic voltammetry (CV) is a crucial tool for investigating the electrooxidation of alcohols and is widely employed in fuel cell testing to evaluate catalyst efficiency in promoting fuel oxidation or oxygen reduction. This technique involves applying voltage cycles to an electrochemical cell containing the electrocatalyst and fuel cell electrolyte and recording the resulting current response as a function of voltage, referred to as a CV curve. By comparing the CV curves of different catalysts, researchers can gain insight into the electrochemical behavior of the catalysts and identify the most effective catalysts for fuel cell applications. This section presents a detailed discussion of factors influencing the electrooxidation performance of alcohols, including Mo content/composition, carbon support, scan rate, electrolyte/alcohol concentration, and ageing.
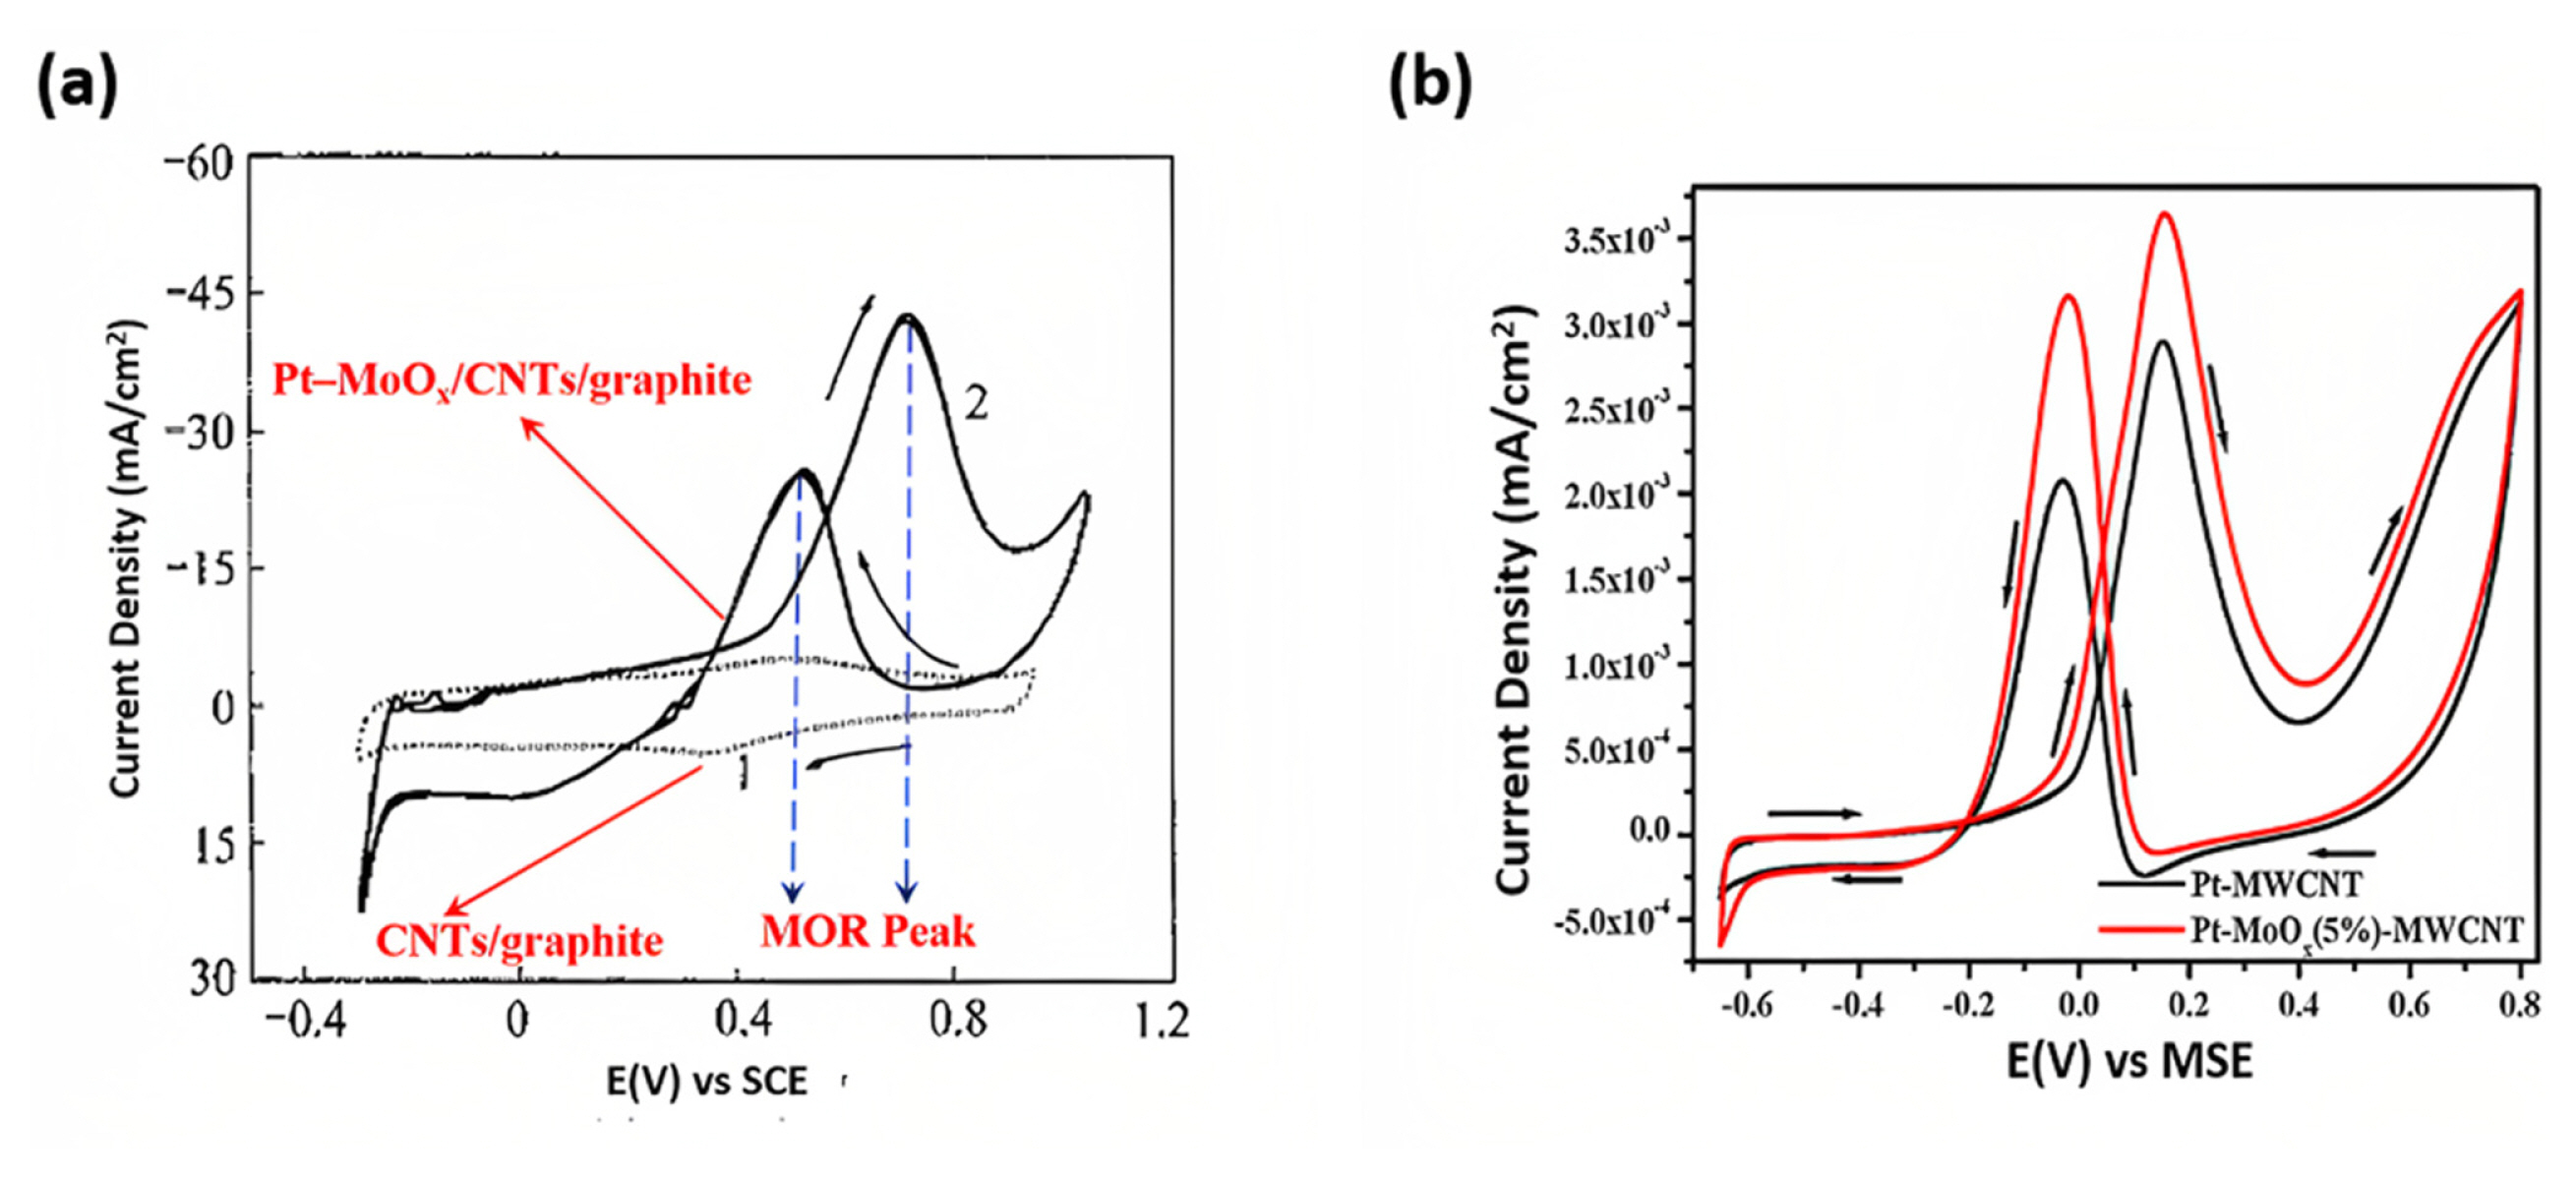
A typical CV curve of alcohol oxidation exhibits a large background current because of the doubleŌĆōlayer capacitance caused by the high surface area of the carbonaceous materials such as (graphene/CNTs structure) [17]. The redox peaks between 0.3 V and 0.5 V correspond to the redox behavior of carboxylic acid groups such as ŌłÆCOOH and ŌłÆOH. Furthermore, no current peak for alcohol oxidation is observed. Fig. 4(a) indicates that the CNT/graphene electrode did not possess significant electrocatalytic activity [17]. Fig. 4(b) represented the CV curve for methanol oxidation using the Pt/MWCNTs. Adding Mo in Pt/MWCNTs significantly improved the alcohol oxidation activity by the bifunctional mechanism [18].
In contrast, the CV curve of the Pt/Mo-ECs shows an intense peak in both forward and backward scans positioned at 0.7ŌĆō0.9 V and 0.3ŌĆō0.5 V, respectively, within the potential window of 0.0ŌĆō1.2 V, as for reference from the previous studies [27ŌĆō29]. The alcohol oxidation region can be divided into four peaks in forward and backward scans at around 0.0ŌĆō0.3 V, 0.3ŌĆō0.6 V, 0.6ŌĆō0.9 V, and 0.6ŌĆō0.3 V, respectively. As the potential scans in the forward direction of 0.0ŌĆō0.3 V, the electrocatalyst is in a metallic state and is active for methanol, ethanol, and hydrogen adsorption, corresponding to the minimal non-zero current density [27]. At 0.3 V, water molecules dissociate on the electrocatalyst surface to form the active oxidant ŌĆ£ŌłÆOHŌĆØ, which species is responsible for oxidizing the adsorbed methanol or intermediate carbonaceous species such as CH3OH, CO, HCHO, and CHO, leading to an increase in current until the potential reaches the peak current. At the peak current, the electrocatalyst surface is fully oxidized, and it is no longer active for the oxidation of carbonaceous species, resulting in a decrease in current until 0.9 V. Beyond this potential, the current gradually increased because of the oxidation of carbonaceous species on the oxide form of the catalyst (PtO, PdO, PtMoOx, and PtRuO) at a high potential. As the potential was scanned back, the re-adsorption of the carbonaceous species increased the current in the backward scan until it reached a peak. Beyond this potential, the surface was recovered to the metallic surface, supplying more active sites for methanol/carbon species oxidation (0.6ŌĆō0.4 V). However, this potential is too low to allow the dissociation of the water molecules into active oxidants. The small oxidation peak in the backward scan implies that the backward oxidation peak during the MOR was not due to the oxidation of the CO residue. However, the shape and nature of alcohol oxidation in the CV curve are highly affected by various factors such as morphological/ structural properties of the catalyst, concentration of alcohol/electrolytic solution, Pt/Mo ratio, scan rate, and carbon support. In this section, important pioneering results are discussed. Table 1 presents the alcohol oxidation results of Mo-ECs for DAFCs used in the past two decades.
4.1 Mo content
Grgur et al. [30] found that the characteristics of the Pt75Mo25 surface in terms of oxidation of H2/CO mixtures are surprisingly similar to those of Pt50Ru50 alloy. These intriguing characteristics arise from the distinct electrochemistry of ruthenium (Ru) and molybdenum (Mo) [30]. The investigation of CO tolerance of PtMo alloys in the presence of reformate gas (H2/CO: 100 ppm) showed two CO stripping peaks at 0.45 V and 0.65 V, indicating that CO adsorbed on Pt sites was oxidized by oxygenated species activated at neighboring Mo atoms. However, complete stripping can only be achieved at a high overpotential, E > 0.55 V, on the Pt sites between CO and PtŌĆōOH [31]. In a typical AOR process, Mo mediates oxygen transfer to CO, reducing alcohol oxidation peak and onset potential [28]. The onset potential of CO oxidation on Mo-modified Pt(332) was observed at 0.15 V and the main peak at 0.3 V [23]. Mo causes a shift in the onset potential for the oxidation of adsorbed CO to lower potentials (around 0.15 to 0.2 V) compared to Sn [32]. However, at these low potentials, only approximately 10% of the adsorbate is oxidized, and the main oxidation peak remains largely unaffected [32]. In contrast, Ru competes with CO oxidation and oxygen transfer to Pt via a bifunctional mechanism. To improve the performance of Mo as co-catalysts, researchers tried to optimize the Mo content in different chemical compositions with Pt. Anjos et al. [8] prepared PtMo (80:20 and 50:50) bimetallic electrodes using an arcŌĆōmelting furnace technique. Ethanol was detected during the positive CV scan. The onset potential for the oxidation of the alcohol was approximately 0.3 V vs. RHE, with a decrease in the hydrogen region attributed to the adsorption of organic species. Adding Mo causes a shift in ethanol oxidation toward less positive potentials, with MoŌĆōmodified electrodes exhibiting higher activities of up to 0.75 V vs. RHE. In comparison, PtŌĆōMo (50:50) electrocatalysts had lower current densities than PtŌĆōalone after this potential, likely due to fewer PtŌĆōOH sites for the oxidative removal of adsorbed CO. The enhanced activity of PtŌĆōMo (80:20) is possibly due to an increase in the electrode surface roughness caused by the dissolution of Mo surface atoms or the modification of the electronic structure of Pt. The high catalytic activity of PtMo (80:20) may be attributed to the enhanced roughness of the electrode surface caused by the dissolution of Mo in the solution. The presence of the Mo a modified electrode led to a shift in the ethanol oxidation peak positions to lower positive potential [8].
Lima et al. [33] initially categorically investigated methanol oxidation using PtRuŌĆōX (X = Au, Co, Cu, Fe, Mo, Ni, Sn, and W) ternary metallic electrocatalysts. Comparative studies showed that polyaniline PtRuMo is the most efficient anode co-catalyst with electrooxidation potential under 0.5 V vs. RHE under stationary conditions. The current density of PAni/PtRuMo was ten times higher than that of the PAni/PtRu counterpart in the same potential window [33]. The encouraging results demonstrate that Mo atoms as a ternary catalyst at a weight ratio close to 5% have achieved a single cell potential of 0.55 V after 5 min of 1.0 M methanol oxidation. CV results were used to compare the performance of the PAni/PtRuMo anodes with that of other electrocatalysts, specifically PAni/PtRu.
The results indicated that the PAni/PtRuMo ternary system exhibits superior catalytic performance, producing higher current densities across the potential range of 0.0ŌĆō0.65 V vs. RHE [33]. The impact of Mo introduction on PtRu/C electrocatalysts for the oxidation of ethanol and methanol was further studied by Neto et al. [34]. Researchers synthesized two PtRuMo catalysts with the composition of PtRuMo (1:1:0.5) and PtRuMo (1:1:1), respectively. They found that adding Mo to the catalyst improved its performance, especially for ethanol oxidation. In addition, the amount of Mo is important, as the catalystŌĆÖs performance is much poorer when the amount of Mo is 0.5 compared to Mo at 1. Because Mo is a good promoter for ethanol oxidation, and a higher amount of Mo leads to better catalyst performance.
Adding Mo with the thermal treatment at 300┬░C in a hydrogen atmosphere leads to improve the catalyst performance. This is because thermal treatment can activate the catalyst and improve its surface properties [34]. Adding Mo to the PtŌĆōRu electrocatalyst enhanced the oxidation of 1.0 M ethanol and methanol and facilitated the breaking of the CŌĆōC bonds. An increase in the oxidation current above 0.5 V was observed as the concentrations of methanol and ethanol increased, but this increase was not proportional. It indicates the adsorption of alcohol on the catalyst surface, which leads to catalyst poisoning [34]. Jaksic et al. [35,36] reported that electrocatalytic activity depends on Mo oxidation; lower oxidation states, such as MoO2 or Mo(IV) and MoO2(OH) or Mo(V), tend to exhibit higher conductivities and higher electrocatalytic activities than higher oxidation states, such as MoO3. The latter can significantly reduce the number of active catalytic sites and decrease the catalytic activity under methanol oxidation [32,33,35,36]. Guill├®nŌĆōVillafuerte et al. [19] found that increasing the Pt content in Pt/Mo2C@MoO3/C catalysts shifts the maximum current density generated during methanol oxidation towards less positive potentials. The impact of Pt loading (5, 20, and 30 wt.%) on the electrocatalytic oxidation of adsorbed CO for Pt/X@MoO3/C and Pt/C catalysts. The increase in Pt loading while keeping the Pt particle sizes consistent. As a result, the number of exposed Pt atoms increases in active sites for alcohol oxidation proportionally with the Pt loading [19].
The inclusive behavior of the third metal promoted the generation of a more electroactive surface and conductive pathways on the rGO sheets. The synergic effect of conductive rGO and well-dispersed third metal (Ru, W, Sn, Cu, Co, Ni, and conducting polymer) involves a faradic process of inserting hydrogen at neighboring Mo sites HyW(Mo)O3: 0<y<1 [15,38,39], excellent electrically conducive for charge transfer during the oxidation [37]. The strong oxidation peaks attributed to the anchoring of hydrogen-terminated from the Pt surface by the rGO-supported metal nanoparticles increased both active sites and electrical conductivity. The synergistic effect of Mo4+ and Co4+ ions, active edge sites of MoS2/CoS2, and the conductivity and structure of rGO facilitated charge transfer, leading to a maximum power density of 19 mW cmŌłÆ2 at 60┬░C for MoS2/CoS2/rGO [40]. Padmini et al. [41] investigated a conductivity-tailored PtNi/MoS2 3D nanoflower catalyst prepared via Sc doping. It was found that electrocatalytic activity toward the EOR using PtSc0.5Ni/MoS2@graphene exhibited a mass activity of 3579 mA mgŌłÆ1. This mass activity value is notably higher, 1.73 times greater than PtNi/MoS2@graphene, 2.98 times greater than Pt@graphene, and 4.68 times greater than commercial Pt/C. The enhanced electrocatalytic performance of PtSc0.5Ni/MoS2@graphene can be attributed to the relatively slower reduction kinetics of Sc3+ ions compared to Pt2+. This difference in reduction kinetics results in a more uniform distribution of catalyst components, ultimately enhancing the electrocatalytic activity of PtNi for the EOR. Moreover, in practical application, PtSc0.5Ni/MoS2@graphene demonstrated an impressive power density of 51.70 mW cmŌłÆ2 in an ethanol fuel cell operating at 50┬░C. This power density surpassed previous reported values, highlighting its exceptional performance. In contrast, the commercial Pt/C catalyst exhibited a significantly lower power density, approximately 3.7 times less than that of PtSc0.5Ni/MoS2@graphene [41].
Wang et al. [13] investigated the impact of different Pt/Mo ratios on the methanol oxidation of PtMoOx/C. They claimed the best Pt/Mo atomic ratio of 1.5 to 2.0 yields better methanol oxidation results. The methanol oxidation CV curve for Pt/Mo (atomic 1.5ŌĆō2.0) demonstrates one oxidation peak in the forward scan at 0.18 V (scan range ŌłÆ0.8 to 0.4 V), and an oxidation peak at approximately 0.02 V was observed.
The oxidation peak observed at about 0.18 V on the Pt/MoOx/GC electrode indicates that methanol oxidation is controlled by diffusion. Dissociative adsorption occurred during methanol oxidation, forming adsorbed intermediates (CHxOad; x = 1ŌĆō3) and strongly bound adsorbed CO species. When converting intermediates into CO2 as the final product, the adsorbate must react with adjacent adsorbed oxygen-containing species such as OHad or water in aqueous solutions (Eq. 6 and 7). This study suggests that Pt/MoOx/GC electrodes possess bifunctional characteristics, making them excellent methanol electrooxidation catalysts [15].
Lee et al. [14] examined the effect of adding Mo to PtSn using Pt/C prepared via a conventional chemical reduction method. It indicates that the mass and specific activity of the EOR decreased in the following order: PtSnMo0.6/C > PtSnMo0.4/C > PtSn/C > Pt/C. Moreover, the study investigated methanol electrooxidation under a 0.5 M NaOH electrolyte solution, which exhibited two peaks: the oxidation of methanol (0.45 V, forward) and the oxidation of carbonaceous species formed during the forward oxidation scan, as well as the removal of oxide catalyst (0.4 V, backward) [42,43]. Dai et al. [44] suggested that the reduction in the peak intensity indicates a weaker interaction between the oxygen species and the Pt surface [44,45]. The single-cell performance of PtSn/ and PtSnMo0.6/C was evaluated at 65 and 90┬░C. The open circuit voltage was 0.50 and 0.70 V, respectively. The cell exhibited the maximum output power density values of 14.3 and 25.7 mW cmŌłÆ2, respectively, at 65 and 90┬░C compared to 6.7 and 17.8 mW cmŌłÆ2, since the Sn and Mo are in an unalloyed phase, where enhancement of EOR activity is attributed from the bifunctional mechanism (Pt-SnO2 and Pt-MoOx) on the oxidation of alcohol [14]. Another study by Jeon et al. [25] demonstrated that the Pt45-Ru45Mo10/C had the lowest mass loading and specific activity for methanol electrooxidation compared to other catalysts. However, this particular catalyst displayed a 56% improvement in the specific ethanol electrooxidation activity. This finding is consistent with previous research suggesting that adding Mo to PtRu/C can enhance EOR catalytic activity but contradicts the results obtained for MOR.
4.2 Mo composition
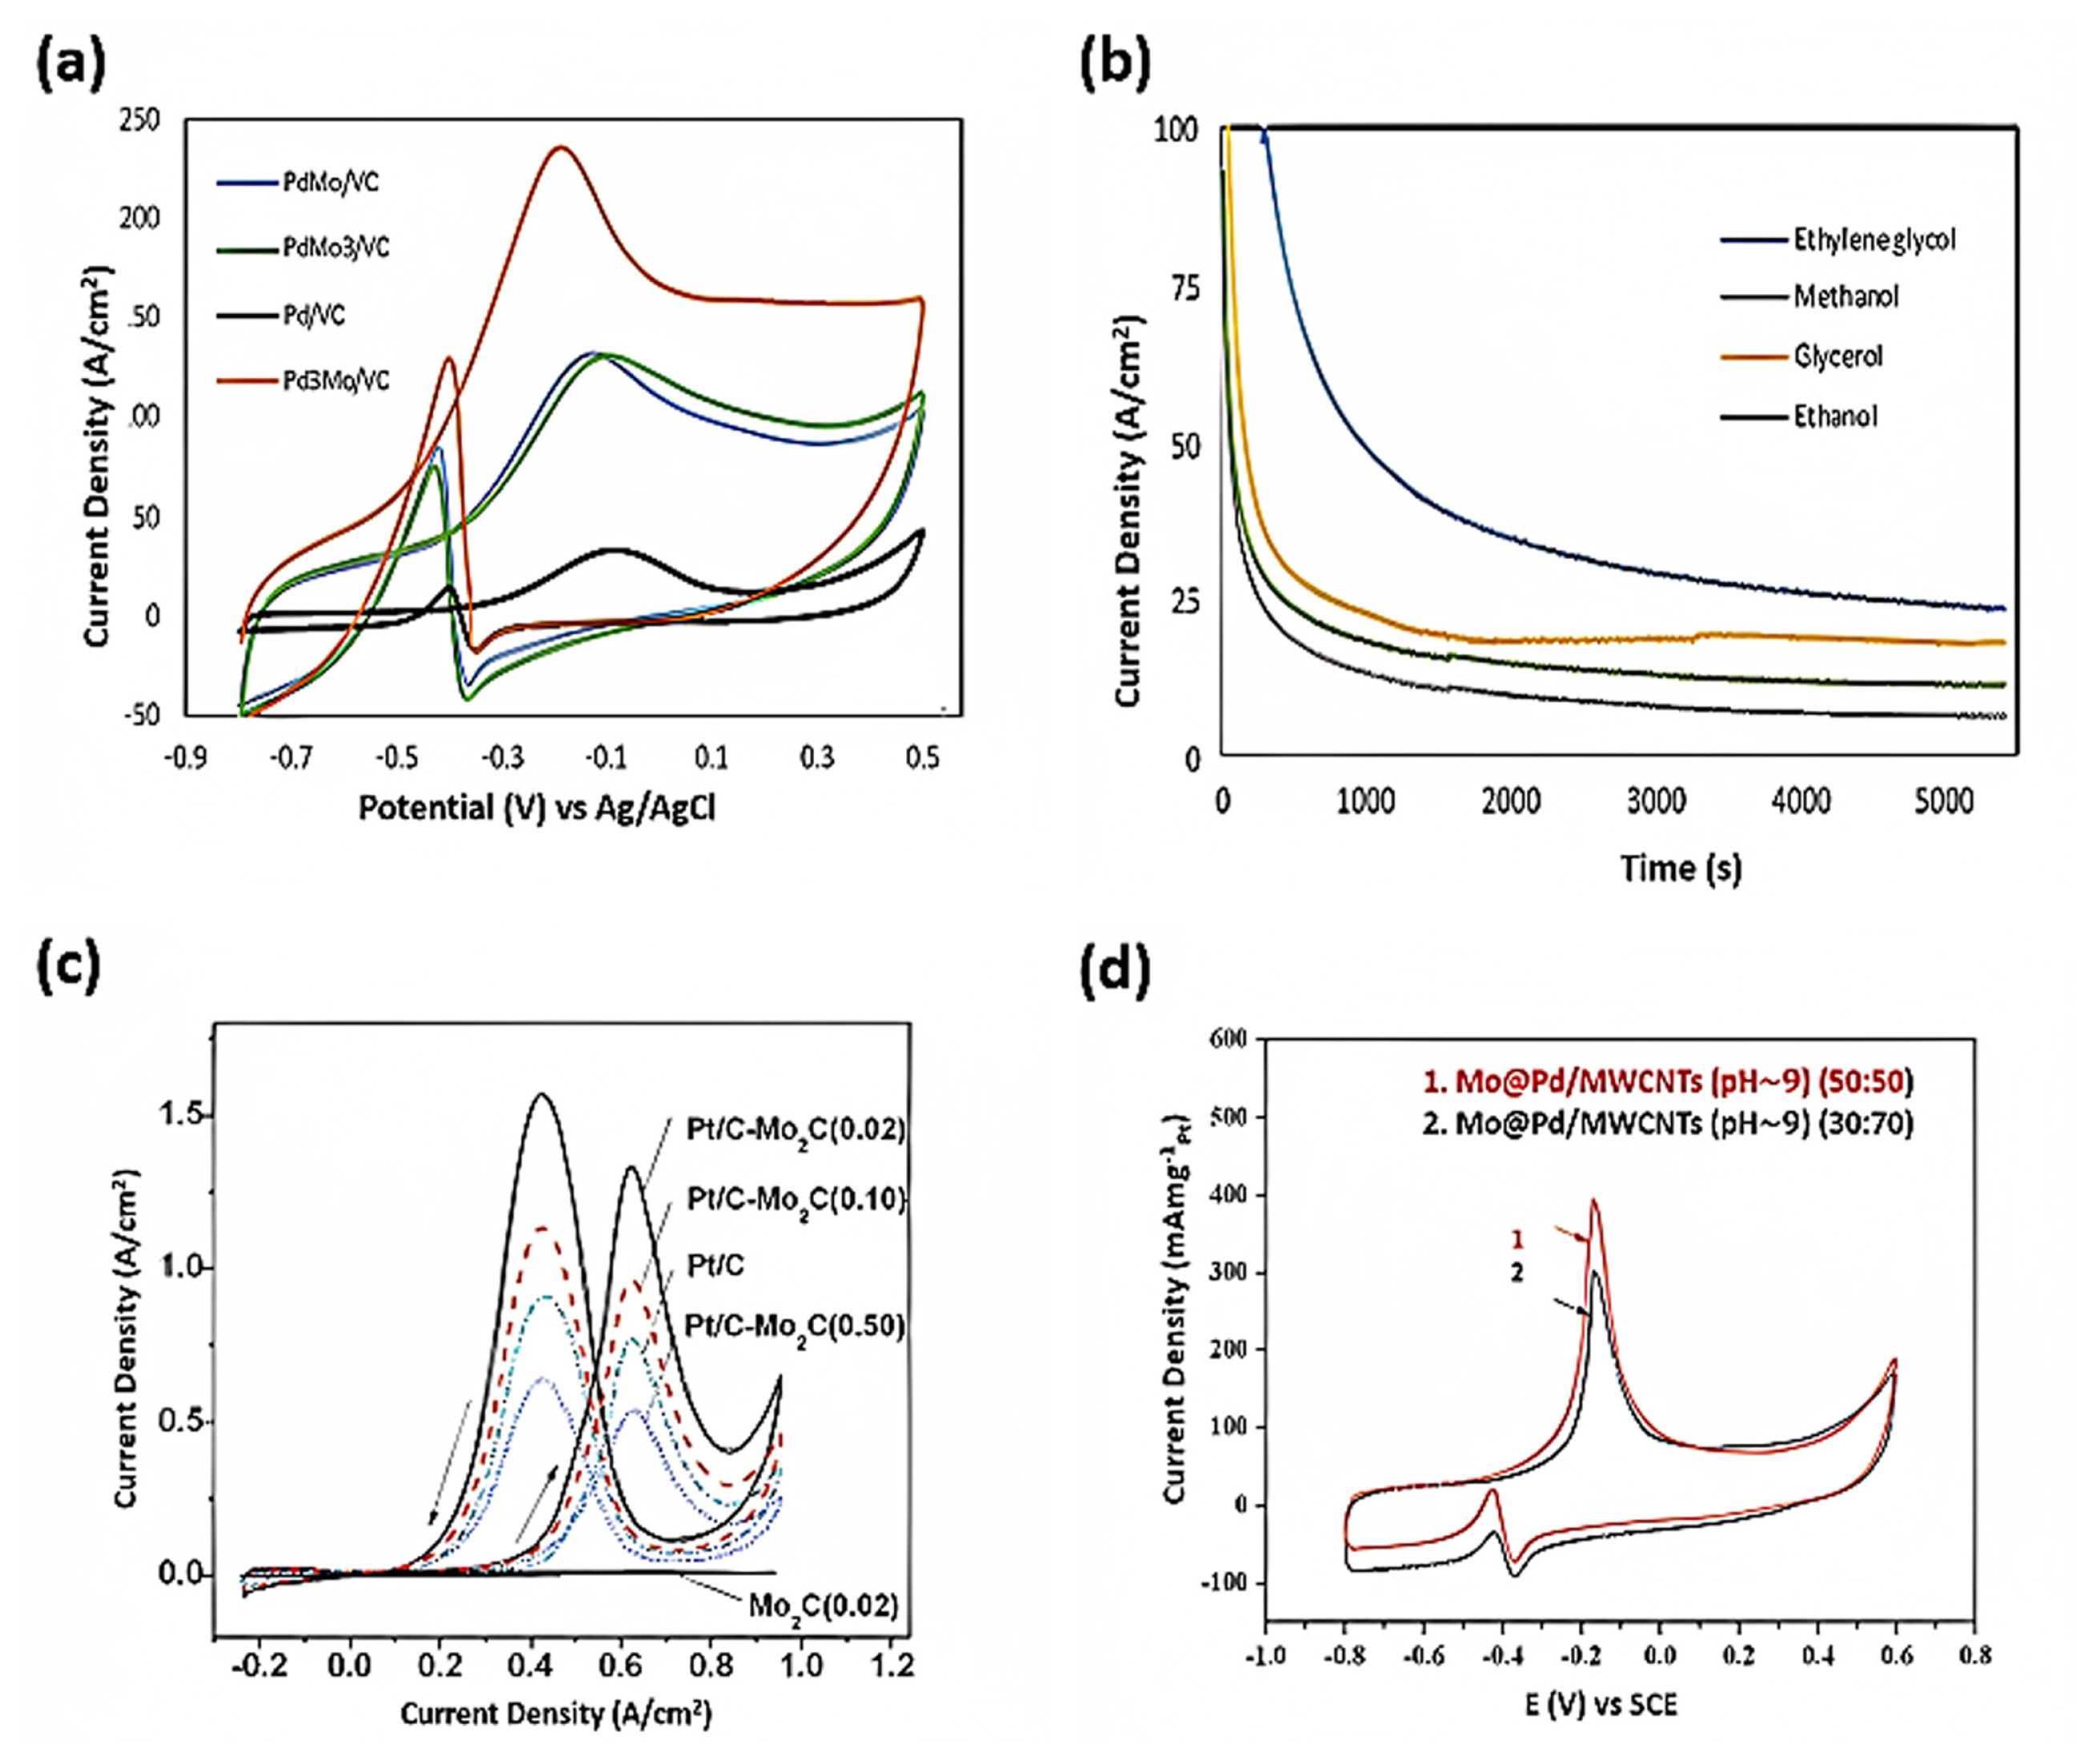
Fathirad et al. [46] found that PdŌĆōMo supported on Vulcan carbon showed higher catalytic activity than pure Pd, whereas Pd3Mo supported on Vulcan carbon demonstrated superior electrocatalytic activity compared to pure Pd/C and PdŌĆōMo/C and PdMo3/C. Fig. 5(a) shows the Pd3Mo/VC catalyst activity for 0.1 M ethylene glycol methanol oxidation, indicating significantly higher activity than that of monometallic Pd/VC and PdMo/VC. The reduced activity of PdŌĆōMo/C compared to PdMo3/C may stem from the depletion of the active surface area during alloy formation and a downshift of the Pd dŌĆōcenter, which weakens the binding energy of the adatoms [46]. In Fig. 5(b), the current densities of the Pd3Mo/VC catalyst initially declined quite rapidly for all the different alcohols and then reached a steady state. A higher current density signifies greater electroactivity. Despite the initial drop in performance, the catalystŌĆÖs activity stabilized, maintaining a consistently high current density for all the alcohols tested [46]. Even the morphological and structural compositions of Mo-ECs control the electrocatalytic behavior of the electrode. Typically, the 2H phase of transition metal dichalcogenides (TMD: MoS2) has a tunable band-gap and poor electrocatalytic properties [47].
In contrast, Gopalakrishnan et al. [48] found that defect-induced MoS2/NF-5 exhibited the highest current density of 73 mA cmŌłÆ2 at the peak potential (0.7 V) for methanol electrooxidation compared with the control samples (MoS2/NF-2, MoS2/NF-5, and MoS2/NF-12). The improved charge transportation and oxidation processes can be attributed to the effect of the hybrid fewŌĆōlayer crumpled nanostructure on the nickel foam substrate. The crumpled MoS2 hybrid nanostructure demonstrated high electrocatalytic activity and increased active sites, making it suitable for MOR [48]. Similarly, Tang et al. [49] developed an exceptional catalyst, Pt/MoS2/Ni3S2ŌĆōNRs/NF, by growing single crystal Ni3S2 nanorods with exposed {110} highŌĆōindex facets on Ni foam and coating them with MoS2. The forward peak current density observed in CV between +0.14 and +0.23 V (potential range ŌłÆ0.8 to 0.4 V) in the positive scan direction is considered a reliable indicator of the electrocatalytic performance of the catalyst, while the oxidation peak between ŌłÆ0.46 and ŌłÆ0.33 V in the negative scan direction corresponds to the oxidization of residual intermediates, such as COads and CHOads. The catalyst had low Pt loading (0.5 wt.%), significantly enhancing its structural stability and resistance to COads poisoning. The Pt/MoS2/Ni3S2ŌĆōNRs/NF catalyst exhibited a mass activity of 805.4 mA mgPtŌłÆ1, which was 1.97 times higher than that of commercial Pt/C (10 wt.%), and excellent cyclic durability with only a 4.6% decline (compared to 40.2% for Pt/C) after 28 hours of use [49]. The uniform dispersion of Pt on the surface of Mo structures benefits the interaction between Pt and Mo, which prevents the fast inactivation of Pt active sites during MOR. Moreover, the hierarchical nanostructure (MoS2/NiS2-NRs/NF) hindered Pt nanoparticle aggregation and significantly increased charge-transfer ability. Even the dangling bonds at the edges facilitate charge transfer through the non-vertical transition and MoS2 layers [49]. The synergistic effect of Mo, Pt, and carbon support collectively empowered the MOR activity.
Even the synthesis temperature of the electrocatalyst influences the surface electronic structure, which usually follows the material crystallinity [50]. Consequently, the synthesis temperature increased electrocatalytic activity at 1000┬░C for 10 wt.% of Mo, using two different concentrations of urea solutions: 1.0 M and 2.0 M. The results indicate that preparing the nanofibers at a high temperature (1000┬░C) significantly improves the electrocatalytic performance of the functional material in two ways: by achieving a high current density and a distinct urea oxidation peak. However, raising the treatment temperature from 700 to 850┬░C did not demonstrate a significant variation in the electrocatalytic activity [50]. In contradiction, Izhar et al. [51] observed that Mo-based electrocatalysts carburized at 773, 873, and 973 K showed higher activity for the MOR and current density between 10ŌĆō20 mA cmŌłÆ2, respectively, for Mo2C-based electrocatalyst [51]. However, Mo carburized at 1073 K displayed a current density of 9 mA cmŌłÆ2, while the non-carburized catalyst showed activity below 1 mA cmŌłÆ2. Thus, the carburization temperature helps produce active sites for MOR activity, and the critical temperature limits MOR activity. The carburized Mo catalyst at 773 and 873 K demonstrated better catalytic activity than non-carburized MoO3/KB. Active carbides, such as oxyŌĆōcarbides and ╬▓ŌĆōMo2C species, facilitate methanol oxidation [51].
Zhang et al. [52] compared the Mo2C deposited nanotubes (ALD600Pt/Mo2C) catalyst with commercial PtRu/C, Pt/C, and PtŌĆōblack catalysts for the MOR. The nanotube catalyst exhibited higher catalytic activity MOR than commercial PtRu/C, Pt/C, and PtŌĆōblack catalysts [53]. In particular, the If/Ib (1.71) ratio, which indicates the CO tolerance of the catalyst, was significantly higher for the ALD600Pt/Mo2C nanotube catalyst than for commercial catalysts, suggesting better CO tolerance and more efficient oxidation of methanol. The strong affinity for MOR arose from the significant amount of sp2-C, facilitating the easy adsorption of methanol on the Pt and MoOx layers on the surface of Mo2C nanotubes favors the adsorption of OH in solution and acting as a nanostructured OH reservoir for the MOR. Thus, the Mo2C nanotube-based catalyst exhibits enhanced CO tolerance [52]. While varying the Mo2C concentration (0.1, 0.2, and 0.5) compared to Pt/C, Pt/CŌĆōMo2C (0.02) exhibited the highest catalytic activity because of its higher surface area, displayed in Fig. 5(c) [53]. All Pt/CŌĆōMo2C electrocatalysts had a more negative onset potential than Pt/C, and the peak current density of Pt/CŌĆōMo2C (0.02) was 1.7 times that of Pt/C. The onset potential for methanol oxidation on Pt/CŌĆōMo2C (0.02) was also negatively shifted by 0.1 V compared to that of Pt/C, whereas the lower surface areas of CŌĆōMo2C (0.50) and CŌĆōMo2C (0.10) were less effective in promoting the synergistic effect on Pt [53].
Kakati et al. [54] investigated the effects of pH and Mo/Pd composition on the electrochemical performance of methanol oxidation using Mo@Pt/MWCNT nanoparticles anchored to MWCNTs. The particles synthesized at pH 9 exhibit a core-shell-like behavior due to the predominant role of Mo or MoOx in creating a ligand effect. This ligand effect, coupled with a larger electrochemically active surface area, surpasses the bifunctional effect seen in nanoparticles produced at pH 7 with MoOx. However, excessive OH adsorption on the catalyst surface impairs performance. Therefore, the precise amount of Mo in these catalysts is essential for optimal performance, as indicated in Fig. 5(d). The increasing PdO content enhances the methanol oxidation current because it requires the presence of surface oxygen-containing species for the oxidative removal of CO. Surprisingly, despite having a higher PdO content compared to Mo@Pd/MWCNT (pH 5) and Pd@MoMWCNT (pH 7), Pd/MWCNT exhibits a lower oxidation current. This suggests that the coexistence of Mo with Pd is the key factor for achieving a higher methanol oxidation current in Mo@Pd/MWCNT (pH 9) [54].
Abhishek and his group investigated the role of polypyrroleŌĆōMoO3 composites in EOR. The conducting polymer network facilitates the conduction of electron/proton pairs generated at the active site ŌĆōMoŌĆōOŌĆōMoŌĆō [10]. The notable increase in the oxidation current density may be due to the mixed valence states of Mo (Mo6+, Mo5+, and Mo4+), as MoO3/HxMoO3 and MoO2. Typically, the lower oxidation state of MoOx results in higher CO tolerance and excellent MOR/EOR activity [10]. The direct methanol fuel cell (DMFC) performance revealed that the PtPd/MOPC catalyst showed the highest power density of 27.3 mW cmŌłÆ2 among all the catalysts, which is 88% higher than the Pt/C catalyst [10]. The catalytic oxidation of reactant molecules using the Mo4O11 Magn├®li phase of molybdenum oxides involves dissociation, oxidation, and hydrogen spillover [24]. The improvement of active sites accompanied by the dispersion of Pt in Pt/Mo4O11 catalyst sites creates the hydrogen spillover, resulting in improved ECSA from 356.1 mA mgPtŌłÆ1 to 722 mA mgPtŌłÆ1 and negative anodic peak from 0.93 V to 0.87 V. However, the forward and backward anodic peaks are unexpectedly still higher than many published previous reports. Thus, mixed oxidation showed a much higher CO tolerance than the pure Pt/C electrocatalyst.
Song et al. [20] investigated formic acid oxidation using a PtMoOx/C catalyst. The oxidation of formic acid on Pt occurs through a direct pathway (Eq. 8) that does not involve the generation of COad, whereas an indirect pathway involves the generation of COad. The bifunctional mechanism of MoOx only affects the indirect pathway, which is less significant in formic acid cells than in formaldehyde cells (Eq. 9 and 10). Thus, the impact of the CO pathway on formic acid oxidation was significantly decreased [20].
4.3 pH and Scan Rate
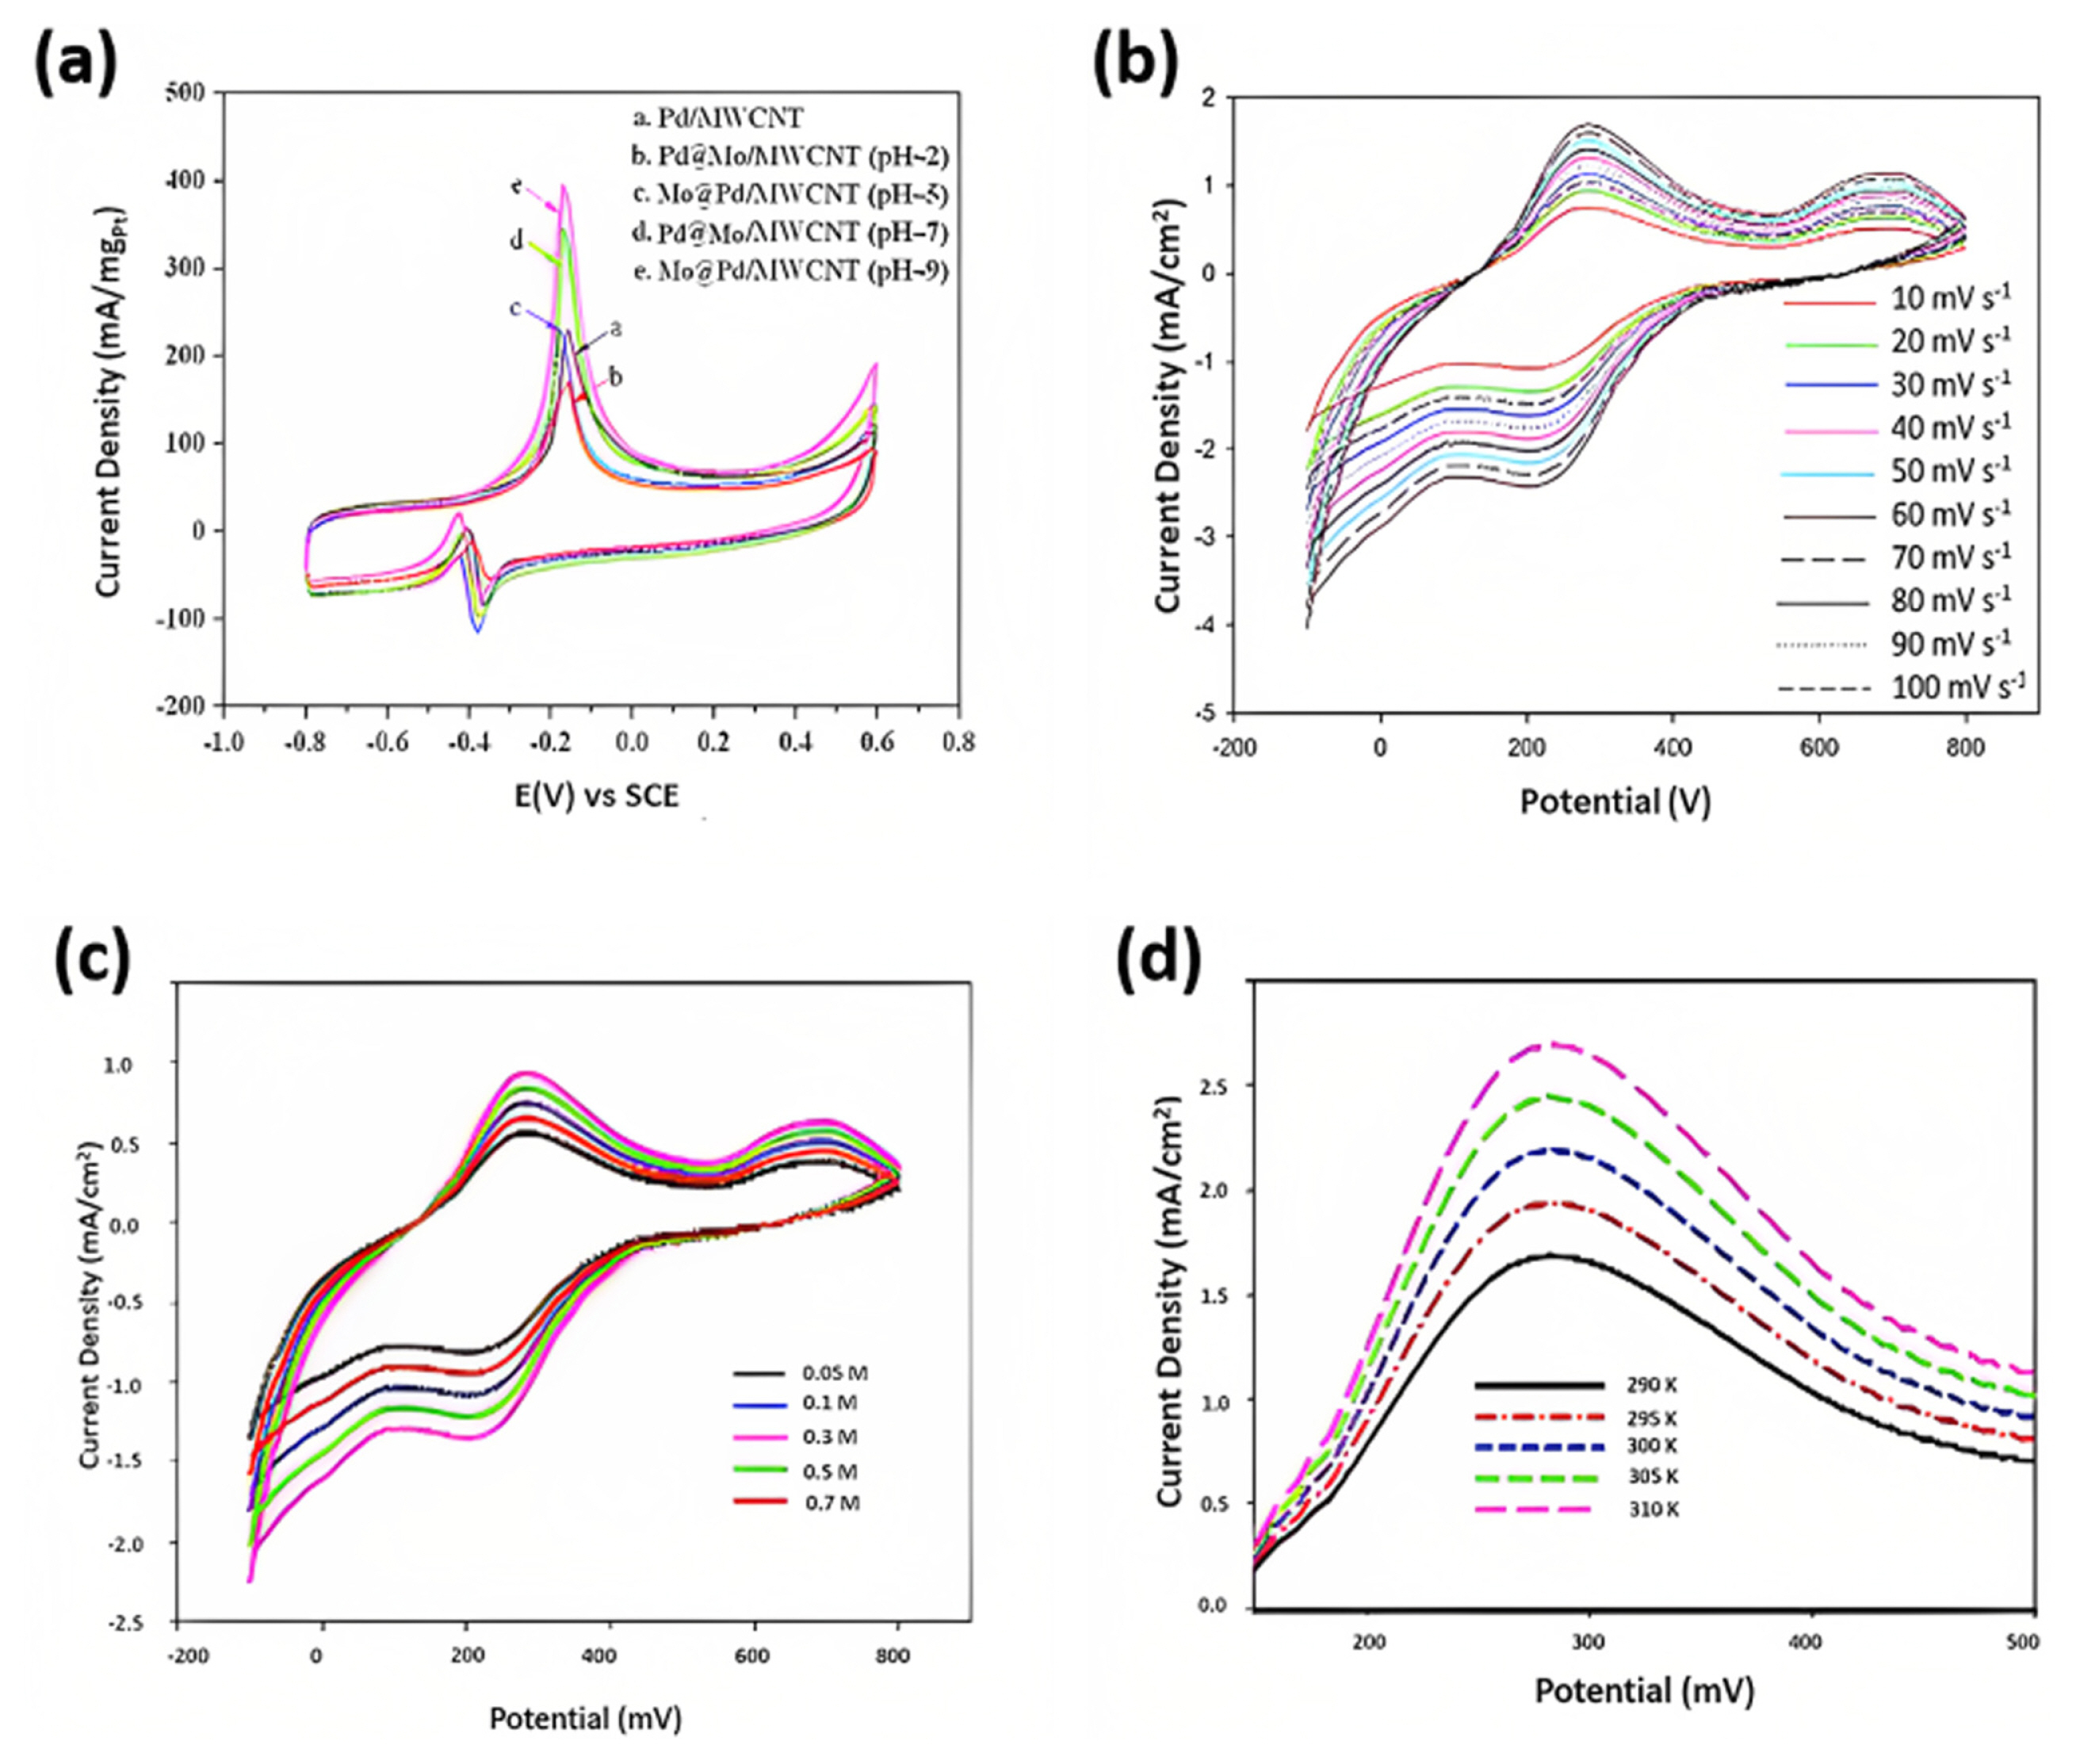
Kakati et al. [54] studied the effect of pH on the electrocatalytic activity of Mo@Pd/MWCNTs on methanol. Researchers observed that the Mo@Pd/MWCNT catalyst, synthesized under pH = 9 conditions, displayed the highest forward peak current density at 395.61 mA cmŌłÆ2mgPdŌłÆ1, surpassing other catalysts produced at various pH levels (Fig. 6(a)) [54]. A trend emerged as the pH of the precursor solution increased, with catalysts generally exhibiting higher forward peak currents. Specifically, Pd@Mo/MWCNT (pH = 7) outperformed Mo@Pd/MWCNT (pH 5) in peak current density. They intriguingly examined the Pd@Mo nanoparticles synthesized at pH = 7 revealing surface segregation of Mo towards the exteriors of nanoparticles. Despite reducing the electrochemically active surface area, this configuration demonstrated superior activity to nanoparticles synthesized at pH 5, where MoŌĆÖs presence on the surface was minimal. This indicated that the presence of MoOx on the catalyst surface, synthesized at pH 7, contributed to a bifunctional effect due to its oxophilic nature, which could overcome core-based ligand effects and the limited bifunctional effect of MoOx in pH = 5-synthesized nanoparticles.
In contrast, pH 9-synthesized particles exhibited a core-shell-like structure, where Mo or MoOx primarily contributed to a ligand effect. This resulted in a higher electrochemically active surface area, and the ligand effect of Mo or MoOx predominated over the bifunctional effect of MoOx in pH 7-synthesized nanoparticles. However, excessive OH adsorption on the catalyst surface impaired performance, underscoring the critical role of controlling Mo content for optimal catalyst performance [54]. An increase in the scan rate from a slower scan rate (1ŌĆō10 mV) to a higher scan rate (70ŌĆō100 mV sŌłÆ1) resulted in an initial increase in the alcohol oxidation current density and a decrease in the onset potential until the critical scan rate was between the higher and lower scan rates. At higher scan rates, the electrolytes do not have sufficient time to penetrate the electrode surface, and only the electrode surface undergoes electrooxidation. Askari et al. [40] comprehensively studied the MOR activity using MoS2/CoS2/rGO catalyst. Fig. 6(b) displays the CV curves of the MoS2/CoS2/rGO catalyst in 1 M KOH and at the optimal methanol concentration of 0.3 M, measured at various scan rates ranging from 10 to 100 mV sŌłÆ1. As the scan rate increased, the anodic current density increased, reaching a maximum value of 1.7 mA cmŌłÆ2 at a scan rate of 60 mV sŌłÆ1. However, the current density slightly decreased for scan rates above 60 mV sŌłÆ1. This decrease is attributed to the insufficient time to oxidize certain active compounds.
Consequently, the optimal scan rate for the catalyst was determined to be 60 mV sŌłÆ1. Researchers discovered that at a constant concentration of 1 M methanol/1 M KOH, the current density increases, and the onset potential decreases for a scan rate of 10ŌĆō70 mV sŌłÆ1 for MoS2/Ni3S2/rGO ECs [13]. From 80 mV sŌłÆ1, the peak current density decreased as anticipated. A gradual increase in the area under the curve with increasing scan rate and anodic/cathodic peak shift, is attributed to excellent electrochemical redox activity [48]. In contrast, Padmini et al. [41] suggested an increase in the forward anodic peak alongside a positive shift in the peak potential owing to the ohmic drop generated by the high current density [41]. The oxidation peak current density obtained from the positiveŌĆōscan is proportional to the square root of the scan rate, suggesting a diffusionŌĆōcontrolled process. These findings indicate that the methanol oxidation occurred via diffusion in the PtŌĆōMo/CNT/rGO/graphite electrode. While a pair of broad redox peaks between 0.3 V and 0.5 V is visible, which could be linked to the redox behavior of carboxylic acid groups such as ŌłÆCOOH and ŌłÆOH, no current peak for methanol oxidation is detected, indicating that the CNT/graphite electrode lacks significant electrocatalytic activity [17]. The linear relationship between the anodic peak current density versus the square root of the scan rate proves that electrooxidation is a diffusion-controlled process [17,48,54,55].
4.4 Concentration of alcohol and temperature
The alcohol oxidation current is increased proportionately with increasing concentration of the alcohol solution. After attaining the critical concentration, the methanol alcohol oxidation current density decreased as the electrolyte concentration increased. The significant decrease in alcohol oxidation results from the formation of methanol byproduct, which affects the electrocatalytic activity of Pt-based electrocatalysts [13]. As methanol concentration increased from 0.1 to 0.5 M at a scan rate of 30 mV sŌłÆ1, the polarization current started to increase from 0.0 to 0.7 V in the positive direction and followed the reverse in the cathodic direction [48]. The optimal concentration of MoS2/NF is 0.5 M methanol in 0.1 M NaOH electrolytic solution [48]. Chen et al. [16] presented a study utilizing PtRuMo/CNTs as anode catalysts to optimize the performance of DMFC performance. The researchers stabilized the optimal operating conditions by using a methanol concentration of 2.0ŌĆō2.5 M, a 1.0ŌĆō2.0 mL minŌłÆ1 flow rate for methanol, and an oxygen flow rate of 100ŌĆō150 mL minŌłÆ1. This results in open circuit voltages and power densities of 0.571 V (23.54 mW cmŌłÆ2), 0.591 V (38.24 mW cmŌłÆ2), and 0.570 V (61.32 mW cmŌłÆ2) at different operating temperatures 20, 40, and 60┬░C, respectively [16]. The performance of DMFC is significantly affected by the methanol concentration (0.5ŌĆō2.5 M). A higher methanol concentration increases the reaction rate of the anode, which also results in more methanol crossing over to the cathode. This crossover of methanol to the cathode causes oxidation over the Pt catalyst, generating a mixed potential and decreasing DMFC performance [16]. Parisa et al. observed an upward trend in methanol oxidation current density for MoS2/Ni3S2/rGO ECs from 0.1 to 1.0 M methanol/1 M KOH solution [13]. As the methanol concentration increased from 1.5 to 2.0 M methanol/1 M KOH, methanol oxidation, and current density exhibited a downward trend. This decrease resulted from byproduct formation after passing the critical current density of 1 M methanol, inhibiting charge transfer and decreasing the current density. Thus, researchers claim that 1 M methanol is a critical concentration in the alkaline medium for the best performance using MoS2/Ni3S2/rGO ECs [13].
Askari et al. [40] comprehensively studied the MOR activity using MoS2/CoS2/rGO catalyst in 1 M KOH/ 0.05ŌĆō0.7 M methanol concentration at a sweep rate of 20 mV sŌłÆ1, represented in Fig. 6(c). The peak current density increased from 0.4 to 0.9 mA cmŌłÆ2 with an increase in methanol concentration from 0.05 to 0.3 M. However, for concentrations above 0.3 M, the current density did not exhibit an increasing trend, and for 0.7 M, the current density reached 0.6 mA cmŌłÆ2 due to the byproducts of methanol that restrict the charge transfer process [40]. The oxidation current density increased from 1.68 to 2.71 mA cmŌłÆ2 as the temperature increased from 290 to 310 K (Fig. 6(d)). The oxidation current density significantly increases due to reduced charge transfer resistance at the electrolyte-electrocatalyst interface [40]. Ramakrishnan et al. [21] studied the electrochemical activity Pt@MoS2/NrGO in different alcohols (1.0 M methanol/ethylene glycol/glycerol in 0.5 M H2SO4) at a scan rate of 50 mV sŌłÆ1 [21]. The electrooxidation activity in methanol, ethylene glycol, and glycerol, with mass activities of 448.0, 158.0, and 147.0 mA mgPtŌłÆ1, respectively, which is approximately 4.14, 2.82, and 3.34 times higher than that of the commercial PtŌĆōC (20%) catalyst. Moreover, the electrocatalytic activity loss was higher in methanol (19%) and the least in glycerol activity loss of 14.76%. The forward and backward peaks of alcohol oxidation, positioned at 0.65ŌĆō0.72 V and 0.39ŌĆō0.49 V, correspond to the oxidation of methanol, ethylene glycol, and glycerol into intermediate carbonaceous species such as HCOOH, HCOOCH3, and CO. Additionally, the reduction of PtŌĆōO to Pt or oxidation of chemisorbed carbonaceous species occurs at lower potentials [19,46ŌĆō48]. These observations provided insights into the electrochemical behavior and mechanisms of oxidizing methanol, ethylene glycol, and glycerol on the catalyst surface [21]. Further research is required to elucidate the potential mechanism of CO oxidation based on these effects. The electron density of Mo can be transferred to Pt, thereby increasing the coverage sites and reducing the PtŌĆōCO binding energies [16]. It has also been shown that Mo present in the MoOx species on the surface of CNTs favors the activation of water to generate OHads through Eq. 11 and 12, aiding in the oxidation of CO and enhancing the catalytic activity of PtRuMo/CNTs for methanol oxidation [16].
Muira et al. [56] evaluated platinumŌĆōbased nitride, Pt2Mo3N, using a composition spread thinŌĆōfilm deposition technique. Researchers analyzed Pt-MoN films energy, stability, and catalytic activities and concluded that Pt2Mo3N is more stable in acidic media than Pt0.45Mo0.55 and MoNy because of its high formation energy. Although Pt2Mo3N did not exhibit higher activity for methanol oxidation or oxygen reduction than Pt, it showed higher activity toward formic acid oxidationŌĆōbased nitrides are promising fuel cell catalysts because of their high electrochemical stability at low platinum concentrations [56]. Comparative analysis of the activities of PtŌĆōMo2N/C and Pt/C catalysts for methanol and formic acid oxidation using linear sweep voltammetry revealed that the doubleŌĆōlayer capacitance of PtŌĆōMo2N/C was larger than that of Pt/C, indicating better capacitance behavior. For methanol electrooxidation, the onset potential on PtŌĆōMo2N/C was 0.2 V, which is lower than that on Pt/C (0.28 V), and the current density at 0.4 V was 31 mA mgPtŌłÆ1 on PtŌĆōMo2N/C, 2.2 times higher than that on Pt/C (14 mA mgPtŌłÆ1). For formic acid oxidation, the first peak current density at 0.35 V on PtŌĆōMo2N/C was 86 mA mgPtŌłÆ1, approximately 50% higher than that on Pt/C (59 mA mgPtŌłÆ1) [56]. Varying the Mo concentration (0.0, 5.0, 10.0, 25.0, 35.0%), the maximum performance of urea oxidation (1.0 M Urea in 1.0 KOH, scan rate 50 mV sŌłÆ1) was achieved for 25 wt.% Mo, mimicking the alcohol oxidation process [50]. Even varying the urea concentration (0.0, 0.33, 1.00, 2.00, and 3.00 M) resulted in a sharp increase in the current density [50]. Thus, increasing the reactant concentration enhances the reaction rate and improves the mass transfer process. However, the rate-limiting step for the entire process can be the mass transfer of the reactant or the mass transfer rate of the product [50].
4.5 Carbon support
Previously, Mo-ECs employing commercial carbon black as a supported catalyst for alcohol and CO electrooxidation exhibited instability in acidic/alkaline media[57ŌĆō60]. This instability led to the loss of Pt and Mo surface area, particle leaching, dissolution, and aggregation from the carbon support. On the contrary, catalysts supported on graphene-based materials offer superior attributes such as high stability, conductivity, and easy availability for catalyst fabrication. Notably, nitrogen-doped graphene [57], carbon nanotubes [61], and carbon nanofibers [62] enhance the localized binding energy around Pt particles, effectively preventing aggregation and dissolution of the catalysts [63ŌĆō66]. Consequently, this leads to a substantial increase in catalytic activity and improved durability and longevity of the catalystŌĆÖs lifespan. Carbon supports, such as rGO, CNTs, and carbon nanofibers, play a positive role in the electrooxidation of alcohols. The well-organized morphology of carbon support materials facilitates alcohol adsorption because of their increased surface area and excellent electrical conductivity [13]. Zhai et al. [64] prepared a 2D-MoS2/graphene composite for methanol oxidation [67].
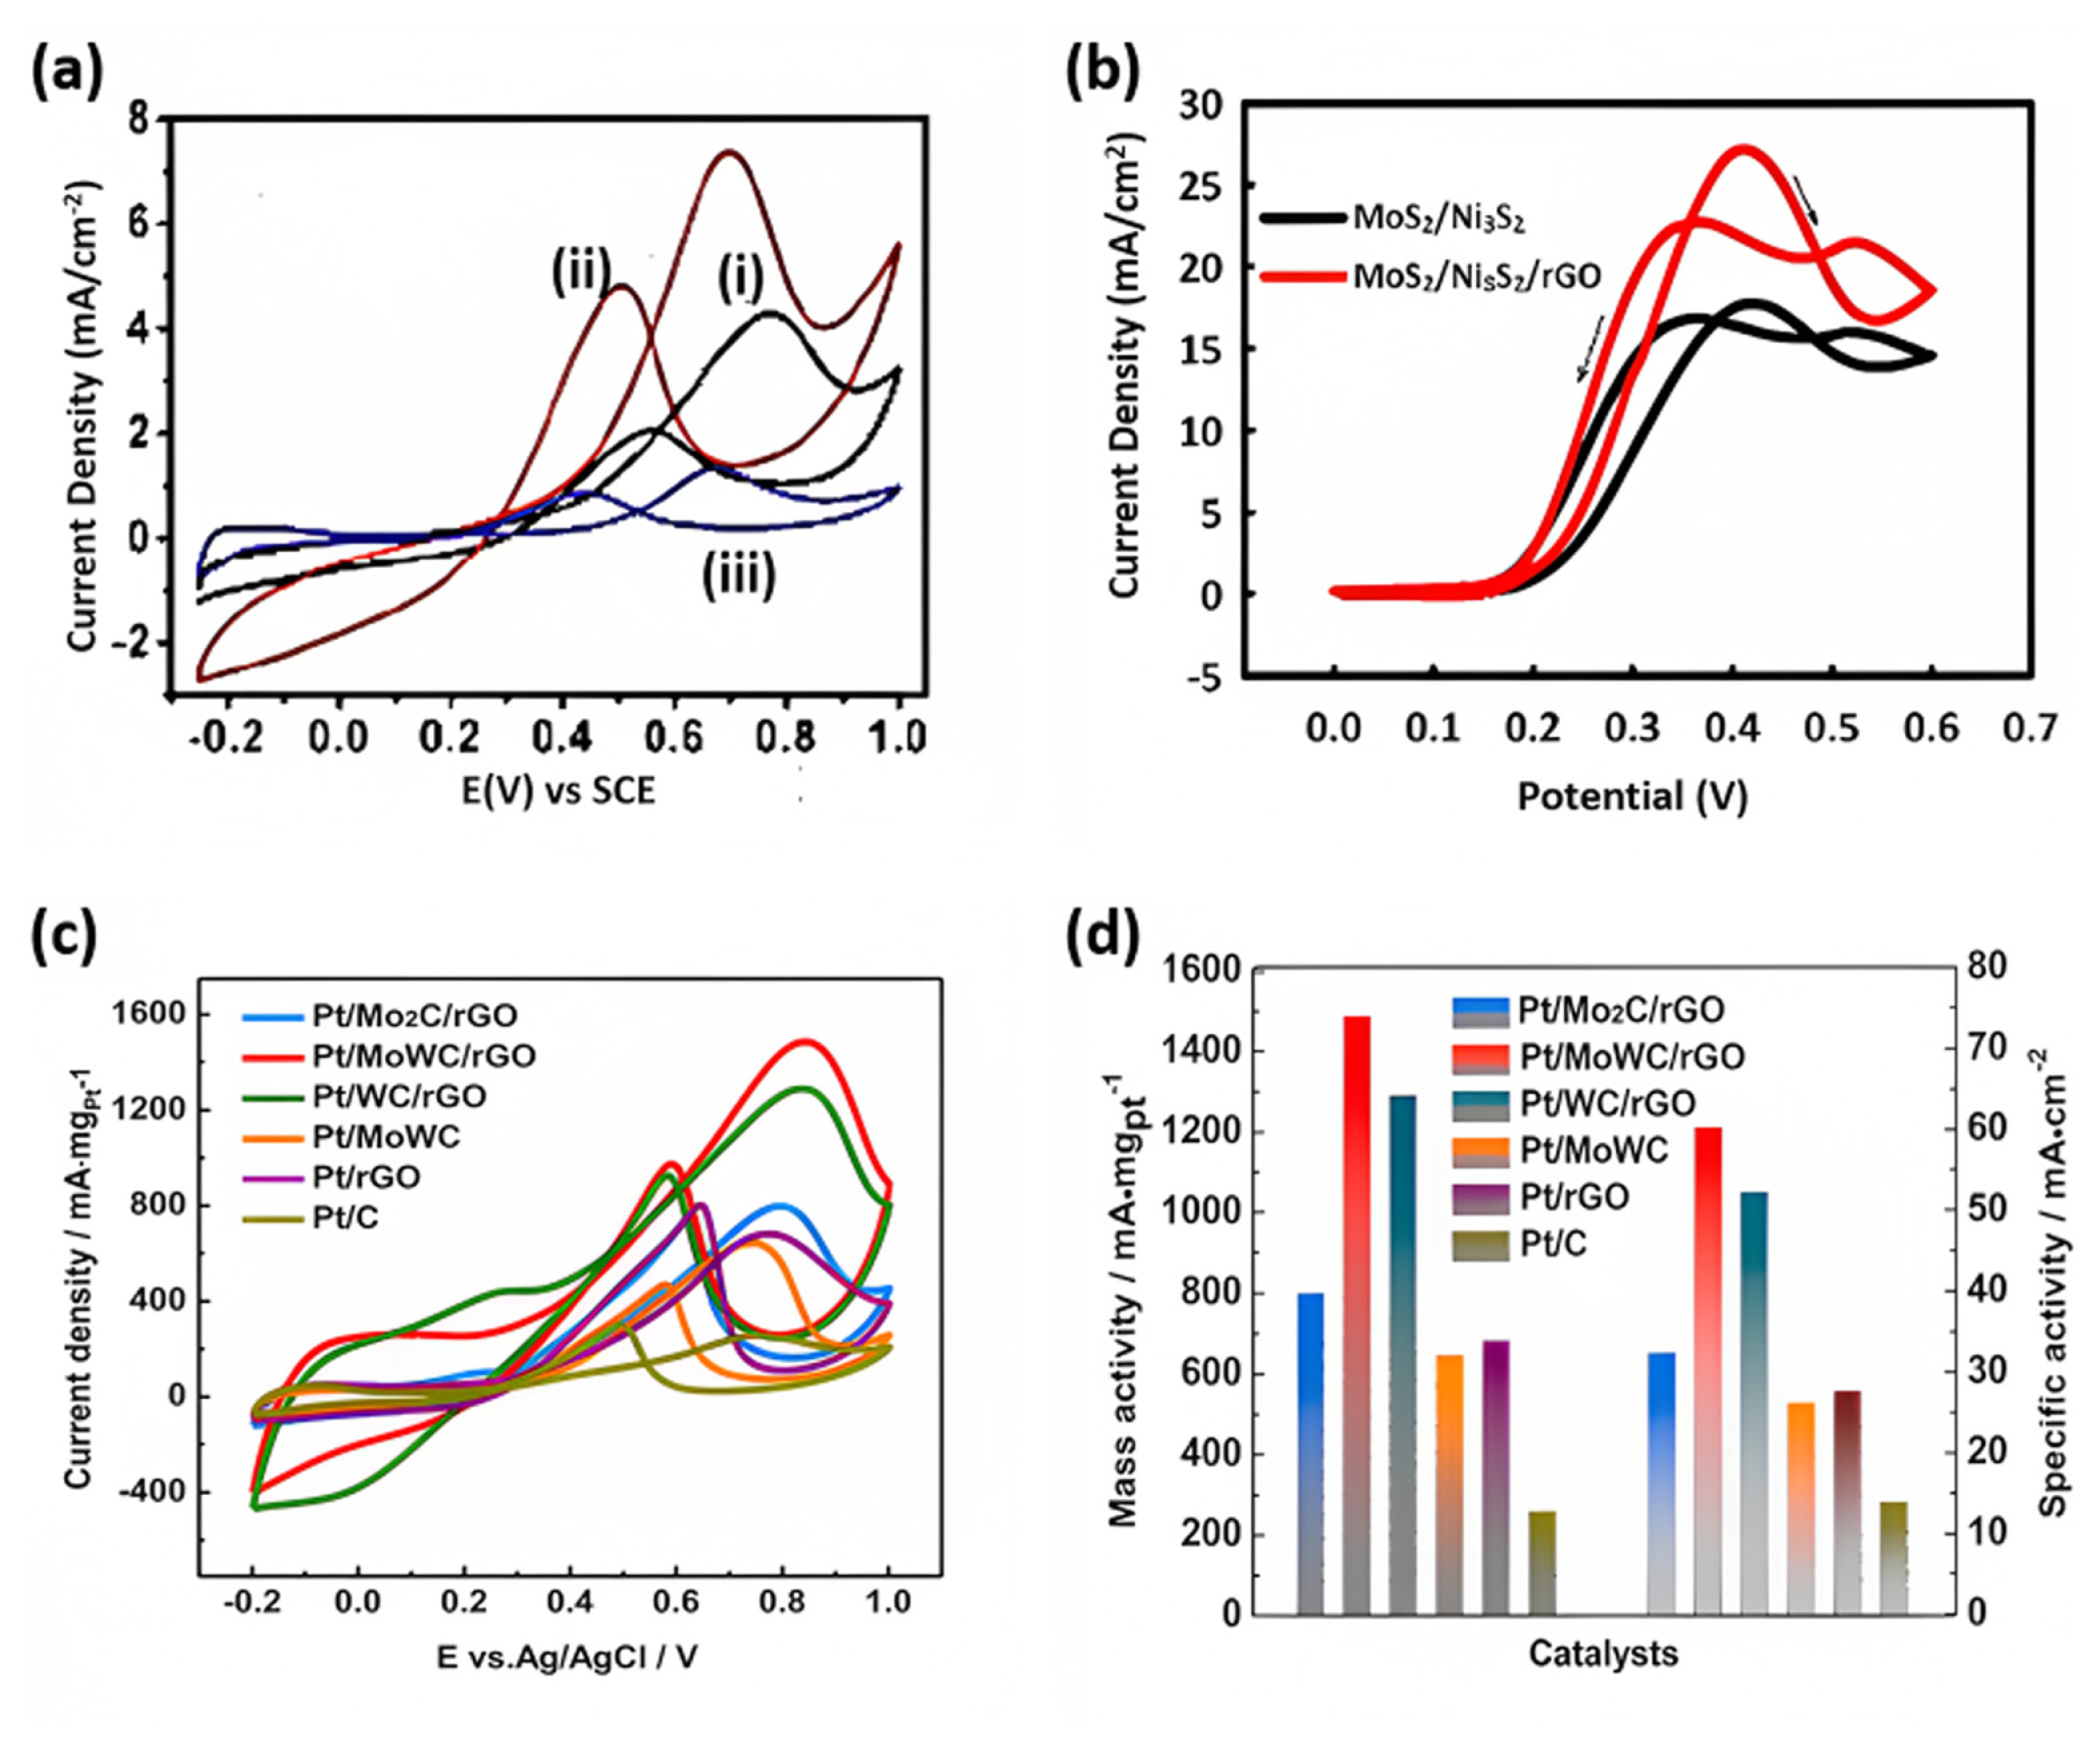
Fig. 7(a) demonstrated the CV result of the methanol electrooxidation pattern of over (i) Pt-MoS2, (ii) Pt-MoS2/RGO, and (iii) commercial Pt/C. The electrooxidation results exhibited peaks between 0.3 V and 0.9 V. The two distinct oxidation peaks are around 0.7 V (forward peak) and 0.49 V (backward peak). These peaks are characteristic of methanol oxidation on Pt catalysts. The forward peak (0.6ŌĆō0.9 V) is associated with removing adsorbed/dehydrogenated methanol fractions by PtŌĆōOH, resulting in CO, CO2, HCOOH, HCOH, and HCOOCH3 formation. The reverse peak (ca. 0.5 V) is linked to the reoxidation of CO and other incompletely oxidized carbonaceous species that formed during the forward scan. The electrocatalytic performance of the materials was evaluated based on the intensity of the forward peak current density. The forward peak current density on PtMoS2/RGO electrodes was found to be 7.35 mA cmŌłÆ2, which is 1.73 and 5.65 times higher than that of PtŌĆōMoS2 (4.26 mA cmŌłÆ2) and commercial Pt/C (1.30 mA cmŌłÆ2) electrodes, respectively. The enhanced charge transfer efficiency within the MoS2/RGO composite is crucial in enhancing the overall electrocatalytic performance [67]. The presence of rGO can dramatically enhance the specific areas of the carriers and contribute to the dispersion of Pt nanoparticles, which may favors exposing more active sites and enhancing the synergy between Pt and the carbon supports [37]. Researchers have studied the porous/starfish morphology of MoS2/Ni2S2/rGO nanostructures for DAFCs (Fig. 7(b)). The study revealed that in 0.1 M methanol/0.1 M ethanol/1 M KOH, MoS2/Ni3S2/rGO nanocatalysts exhibited a higher current density (15.0 mA cmŌłÆ2, 27.19 mA cmŌłÆ2) and lower potential peak (0.42 V, 0.41 V) than MoS2/Ni3S2 (10.36mA cmŌłÆ2 and 0.42 V, 18.13 mA cmŌłÆ2 and 0.42 V), which can be attributed to the positive role of rGO. The If/Ib ratio was higher in MoS2/Ni3S2/rGO (1.06, 1.21) than in MoS2/Ni3S2 (1.04, 1.05), indicating the higher electrocatalytic activity and tolerance of the former. These findings were revealed by comparing the CV curves of the MoS2/Ni3S2 and MoS2/Ni3S2/rGO nanocatalysts, confirming that rGO played a positive role in increasing the absorption of methanol because of its increased active surface area, which resulted in increased absorption. Finally, the fuel cell test reveals that anode catalyst MoS2/Ni3S2/rGO resulted in an OCV of 0.59 V/0.48 V and peak power density of 4.42 mW cmŌłÆ2/3.5 mW cmŌłÆ2, indicating promising performance [13]. Li et al. [37] investigated the MOR activity of Pt/MoWC/rGO electrocatalysts in two electrolytes, i.e., 0.1 M HClO4 and 0.1 M KOH.
Fig. 7(c,d) shows that the specific activity of the Pt/MoWC/rGO electrocatalyst was as high as 60.11 mA cmŌłÆ2 in an acidic electrolyte, which was superior to that of other catalysts, including Pt/Mo2C/rGO, Pt/WC/rGO, Pt/MoWC, Pt/rGO, and Pt/C. In alkaline electrolytes, the Pt/MoWC/rGO catalyst also exhibited superior mass and specific activity toward the MOR compared to the other catalysts in the order of Pt/MoWC/rGO > Pt/WC/rGO > Pt/Mo2C/rGO > Pt/rGO > Pt/MoWC > Pt/C. The improved MOR activity of Pt/MoWC/rGO was attributed to the compositional effect of binary MoWC solid solution and the mesoporous structure of MoWC loaded onto the rGO surface, which exposes more active sites and contributes to their accessibility [37]. The interaction of MoS2-to- paved the way for efficient charge transfer in rGO in the Pt-MoS2/rGO electrocatalyst, which resulted in the electrooxidation of 1 M methanol and HCOOH in 0.5 M H2SO4 by 1.73 and 5.63 times the Pt/C catalysts [67]. Vellacheri et al. [18] investigated the use of MWCNTŌĆōsupported PtŌĆōMoOx (2ŌēżxŌēż3) electrocatalysts for PEMFC applications. Researchers successfully controlled the effective surface interface between PtŌĆōMoOx, and adding 5%, MoOx resulted in excellent performance for the oxygen reduction reaction in the presence of methanol, as depicted in Fig. 4(b). Contrarily, the deposition of 10% MoOx led to a significant reduction in the active surface area by approximately 80% compared to the PtŌĆōMWCNTs. However, an increase in the number of active sites was observed due to the forming of a PtŌĆōMoOx interface. The presence of MoOx promoted the adsorption of OH species on PtŌĆōMoOx (5%)ŌĆōMWCNTs at a lower potential compared to PdŌĆōMWCNTs. This facilitated methanol oxidation, indicating an enhanced catalytic activity [18].
4.6 Stability Test
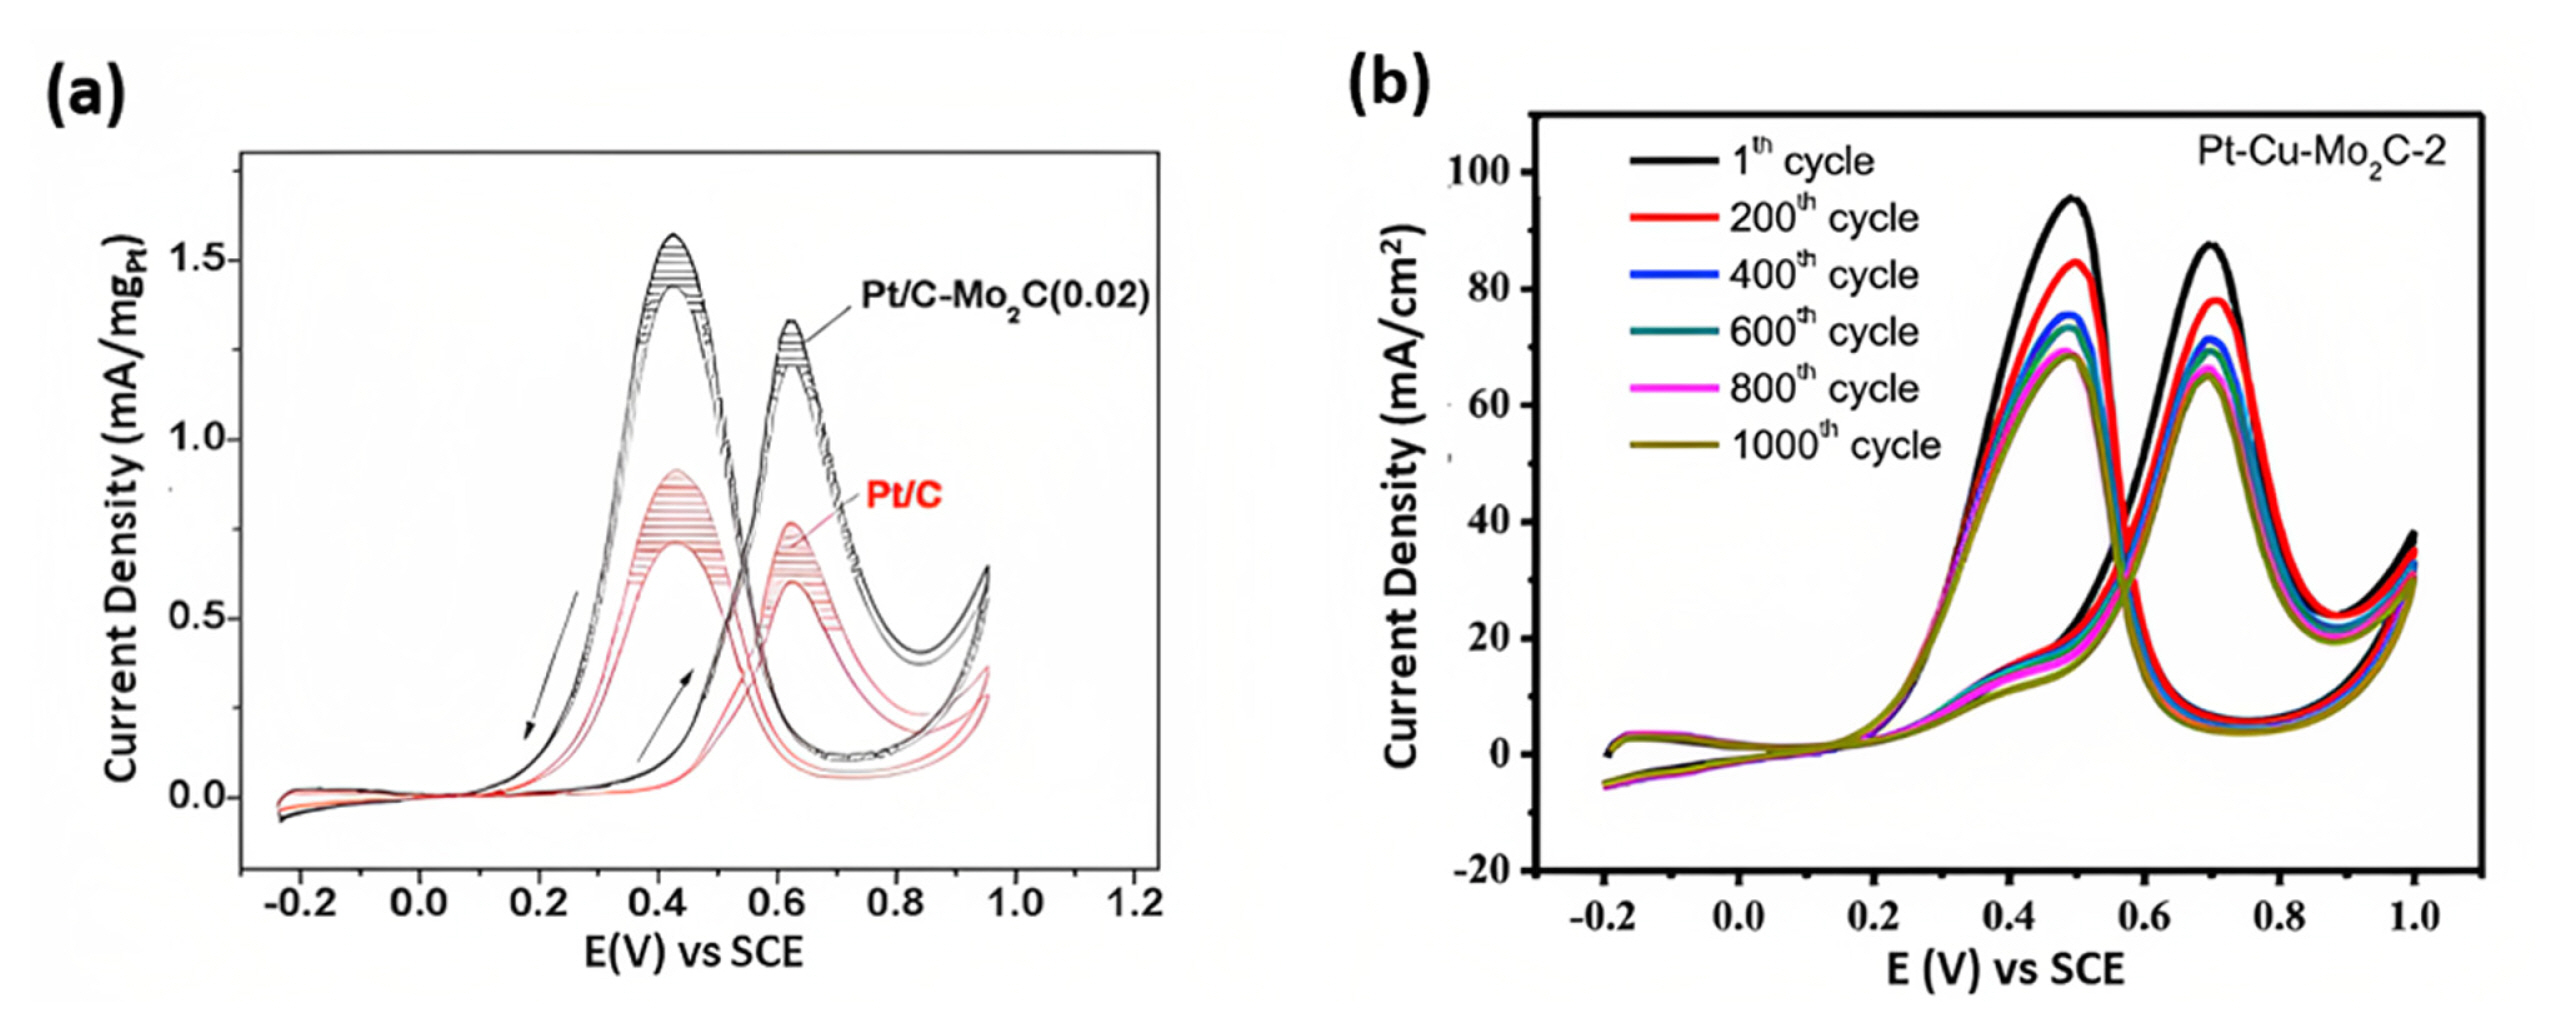
Gopalakrishnan et al. [48] studied electrode durability (MoS2/NF-5) under varying methanol molarity. The results indicated that MoS2/NF-5 started to oxidize methanol without any decay and retain 80% of the initial current after 5000 s under methanol for durability test. This may be due to the string interfacial bonding between the nickel foam (NF) and MoS2 sheet providing rapid and facile electron transport path and synergic effect between the substrate and MoS2 for strong structural integrity under the increasing scan rate and methanol molarity [48]. The electrocatalyst stability was confirmed by repeated cycling at the constant scan rate and electrolyte solution. After 200 consecutive cycles of MoS2/Ni3S2/rGO ECs (70 mV sŌłÆ1 and 1.0 M Methanol/1.0 M KOH), there was an increase in the current density by 6% due to gradual penetration of electrolyte solution (methanol) within the MoS2/Ni3S2/rGO ECs. Thus, researchers claim that after several cycles (200 cycles), the active materials are exposed to contact with the electrolyte, and as a result, more electroactive sites are available for the MOR process [13]. Barakat and group demonstrated that an increase in the sweeping cycle leads to a progressive increase in the current density of the cathodic peak due to the entry of OHŌłÆ into the Ni(OH)2 surface layer, which results in a thicker layer of NiOOH and gradual increase in the current density [50]. Yan et al. [53] analyzed the stability of Pt/C-Mo2C (0.02) and Pt/C against the ageing of the catalyst under 5000 cycles (Fig. 8(a)). The activity of commercial electrocatalyst Pt/C decreased from 767.8 mA mgPtŌłÆ1 to 601.1 mA mgPtŌłÆ1 for MOR. In contrast, the activity of Pt/C-Mo2C reduced by 8.9% from 1327.6 mA mgPtŌłÆ1 to 1209.5 mA mgPtŌłÆ1. The enhanced electrochemical activity and stability may be due to the strong electronic interaction between Pt and M2C compared to Pt and C, primarily supported by the XPS and XANES results [53].
Zhou et al. [69] explored the importance of dynamic stability in practical use, and an expedited test was conducted to evaluate methanol oxidationŌĆÖs stability. This involved running 1000 cyclic voltammetry (CV) cycles at 150 mV sŌłÆ1. The results demonstrate that the peak current density of the PteCueMo2C-2 electrode gradually declines as the number of scans increases (Fig. 8(b)). This decline in performance is linked to the buildup of detrimental intermediates on the electrode surface, which act as poisons. Ultimately, after the completion of the 1000 cycles, the peak current density is diminished for all tested samples [69].
4.7 Electronic effect
The catalytic activity of Pt-Mo ECs can be explained by either the electronic effect or the d-band center model [19,69]. The d-band center represents the energy level of the d-orbital of Pt. The position of the d-band determines the strength of the interaction between Pt and C1 species, such as CO, CHO, and HCHO. The manipulation of the particle size and the chemical environment surrounding Pt atoms effectively alters the d-band center. Due to the smaller particle size of Pt, the d-band orbital becomes more localized closer to the Fermi energy, which is the energy level at which electrons are more likely to be found. Typically, the energy of the antibonding orbital of CO or C1 species has higher energy than the d-band center of Pt. A higher position of the d-band center relative to the Fermi energy (in Pt metal) indicates that more vacant antibonding states are available for CO poisoning. Consequently, stronger adsorption of CO on the Pt surface results in poor performance of fuel cells.
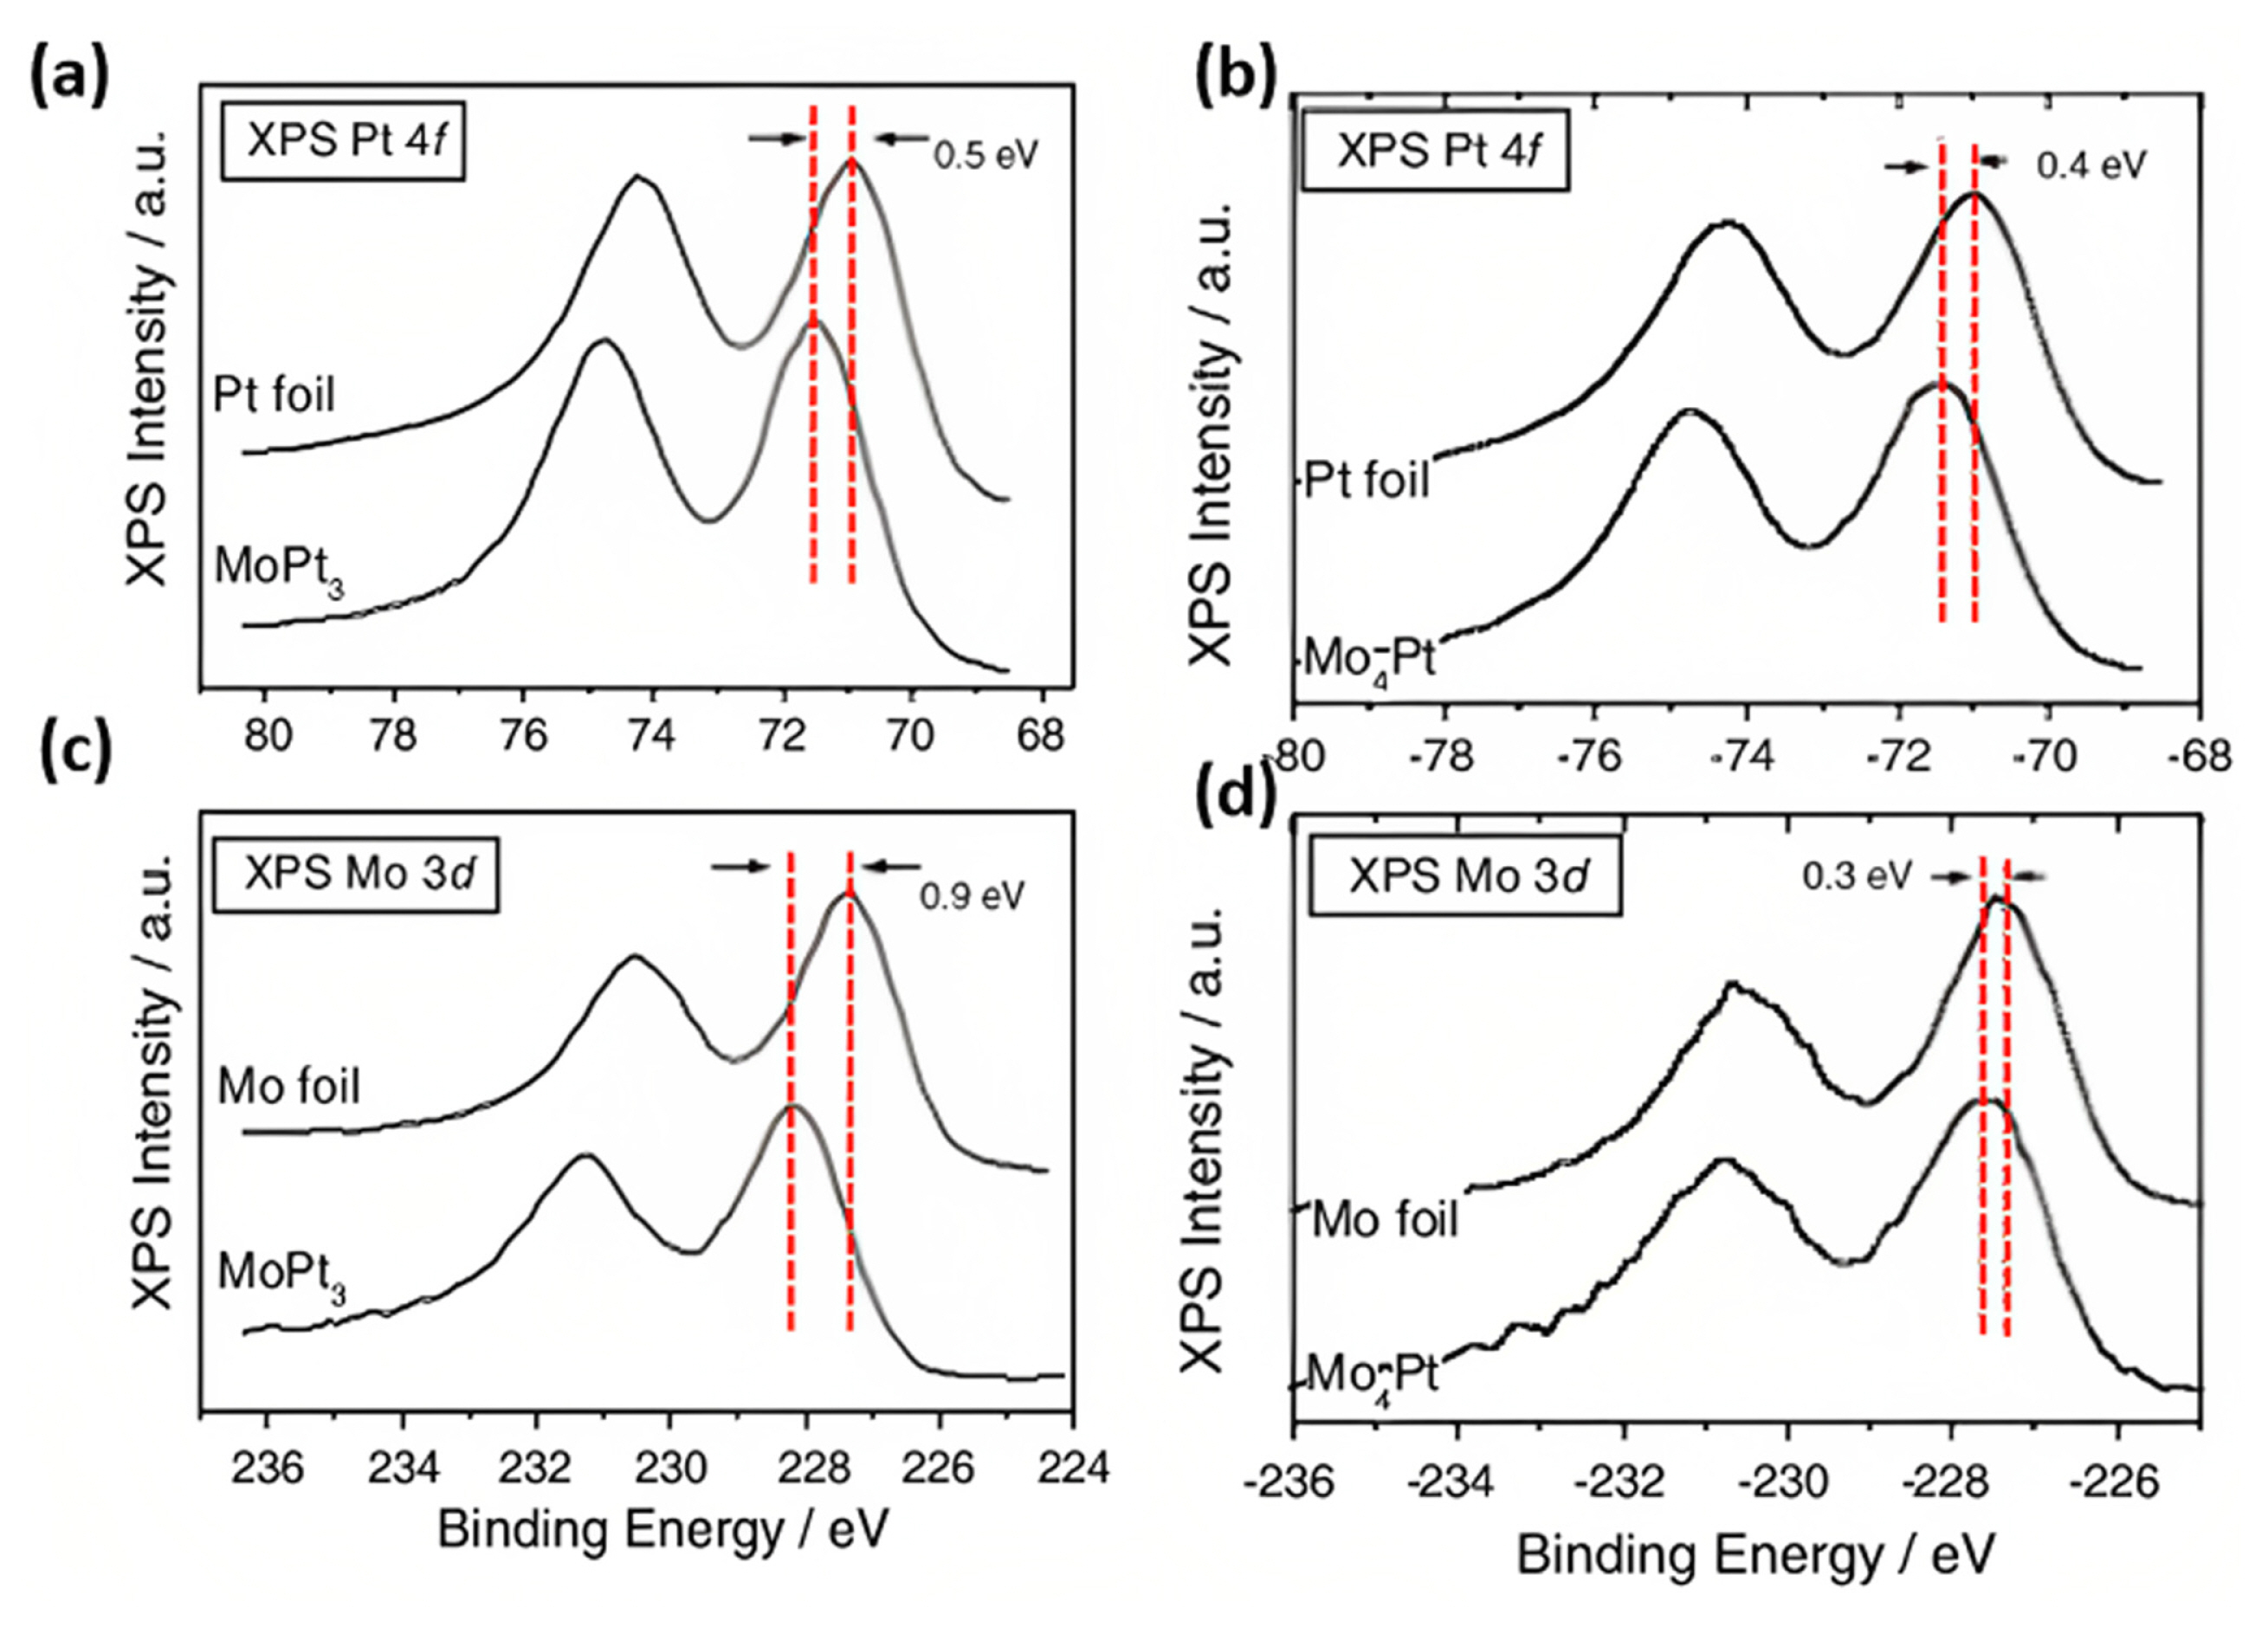
However, when Pt is combined with Mo through alloy or composite formation, the energy of the Pt d-band center decreases due to the hybridization of d-orbitals, strain effects, contraction or expansion of lattice parameters, and surface defects. This decrease in the d-band center weakens the CO bond, facilitating CO desorption and promoting CO oxidation through a bifunctional mechanism using the oxyphilic species of Mo. X-ray photoelectron spectroscopy (XPS) and X-ray absorption near-edge structure (XANES) spectra were used to study the changes in the electronic structure of Pt-Mo ECs. The electronic effect can be observed by comparing the binding energies to those of the Pt/C catalyst. For instance, the metallic state of Pt 4f7/2 of Pt-Mo was observed at 71.4 or 71.6 eV, which is lower than that of the Pt/C catalyst (71.8 eV)ŌĆöindicating a negative shift of 0.2 eV compared to Pt/C. The variations in the negative shifts of Pt binding energies are likely due to the complex interactions among multiple components. It is widely acknowledged that the decrease in Pt binding energy can alter the electronic structure and reduce the d-band center of Pt atoms relative to the Fermi level. As a result, the adsorption of harmful intermediates on Pt active sites during alcohol fuel oxidation is weakened [68]. XPS analysis provides insight into electronic transitions. The strong interaction of d-electrons from hyper-d-electrons (antibonding electrons) to the hypo-d-electron Mo (bonding electrons) was observed in PtMo nanoalloys catalysts (Fig. 9(a,c)) [36]. Though at the higher Mo content (PtMo3 and PtMo4), reversed hyper-hypo-d-d electron transfer was also observed (Fig. 9(b,d)). This hypo-hyper-d-d electronic transition is primarily based on the d-electron delocalization. Similar characteristics in PdMo nanoalloys were observed by Fathirad et al. [46]. Researchers explained the lower catalytic activity of PdMo/VC than Pd3Mo/VC [46]. PdMo alloys undergo phase segregation, in which Pd migrates to the surface, forming an overlayer over the PdMo alloy. Similarly, the change in the electronic structure modifies the catalytic properties of alloying Pd with Mo, and this d-band position of Pd is lowered by inducing strain or electron redistribution of the substrate and overlayer [46].
5. Characterization techniques
Investigation of various characterization techniques is crucial for understanding the electrochemical reactions involved in the catalytic oxidation of alcohol in direct alcohol fuel cells (DAFCs). In this section, Fourier transforms infrared spectroscopy (FTIR), X-ray diffraction (XRD), X-ray photoelectron spectroscopy (XPS), and absorption spectroscopy were comprehensively examined to elucidate the impact of physical, chemical, and structural modifications on the electrochemical performance of Mo-ECs in DAFCs. These characterization techniques provide valuable insights into the molecular, crystallographic, and surface changes, facilitating a deeper understanding of the catalystŌĆÖs behavior and its role in alcohol oxidation reactions in DAFCs.
5.1 Spectroscopic technique
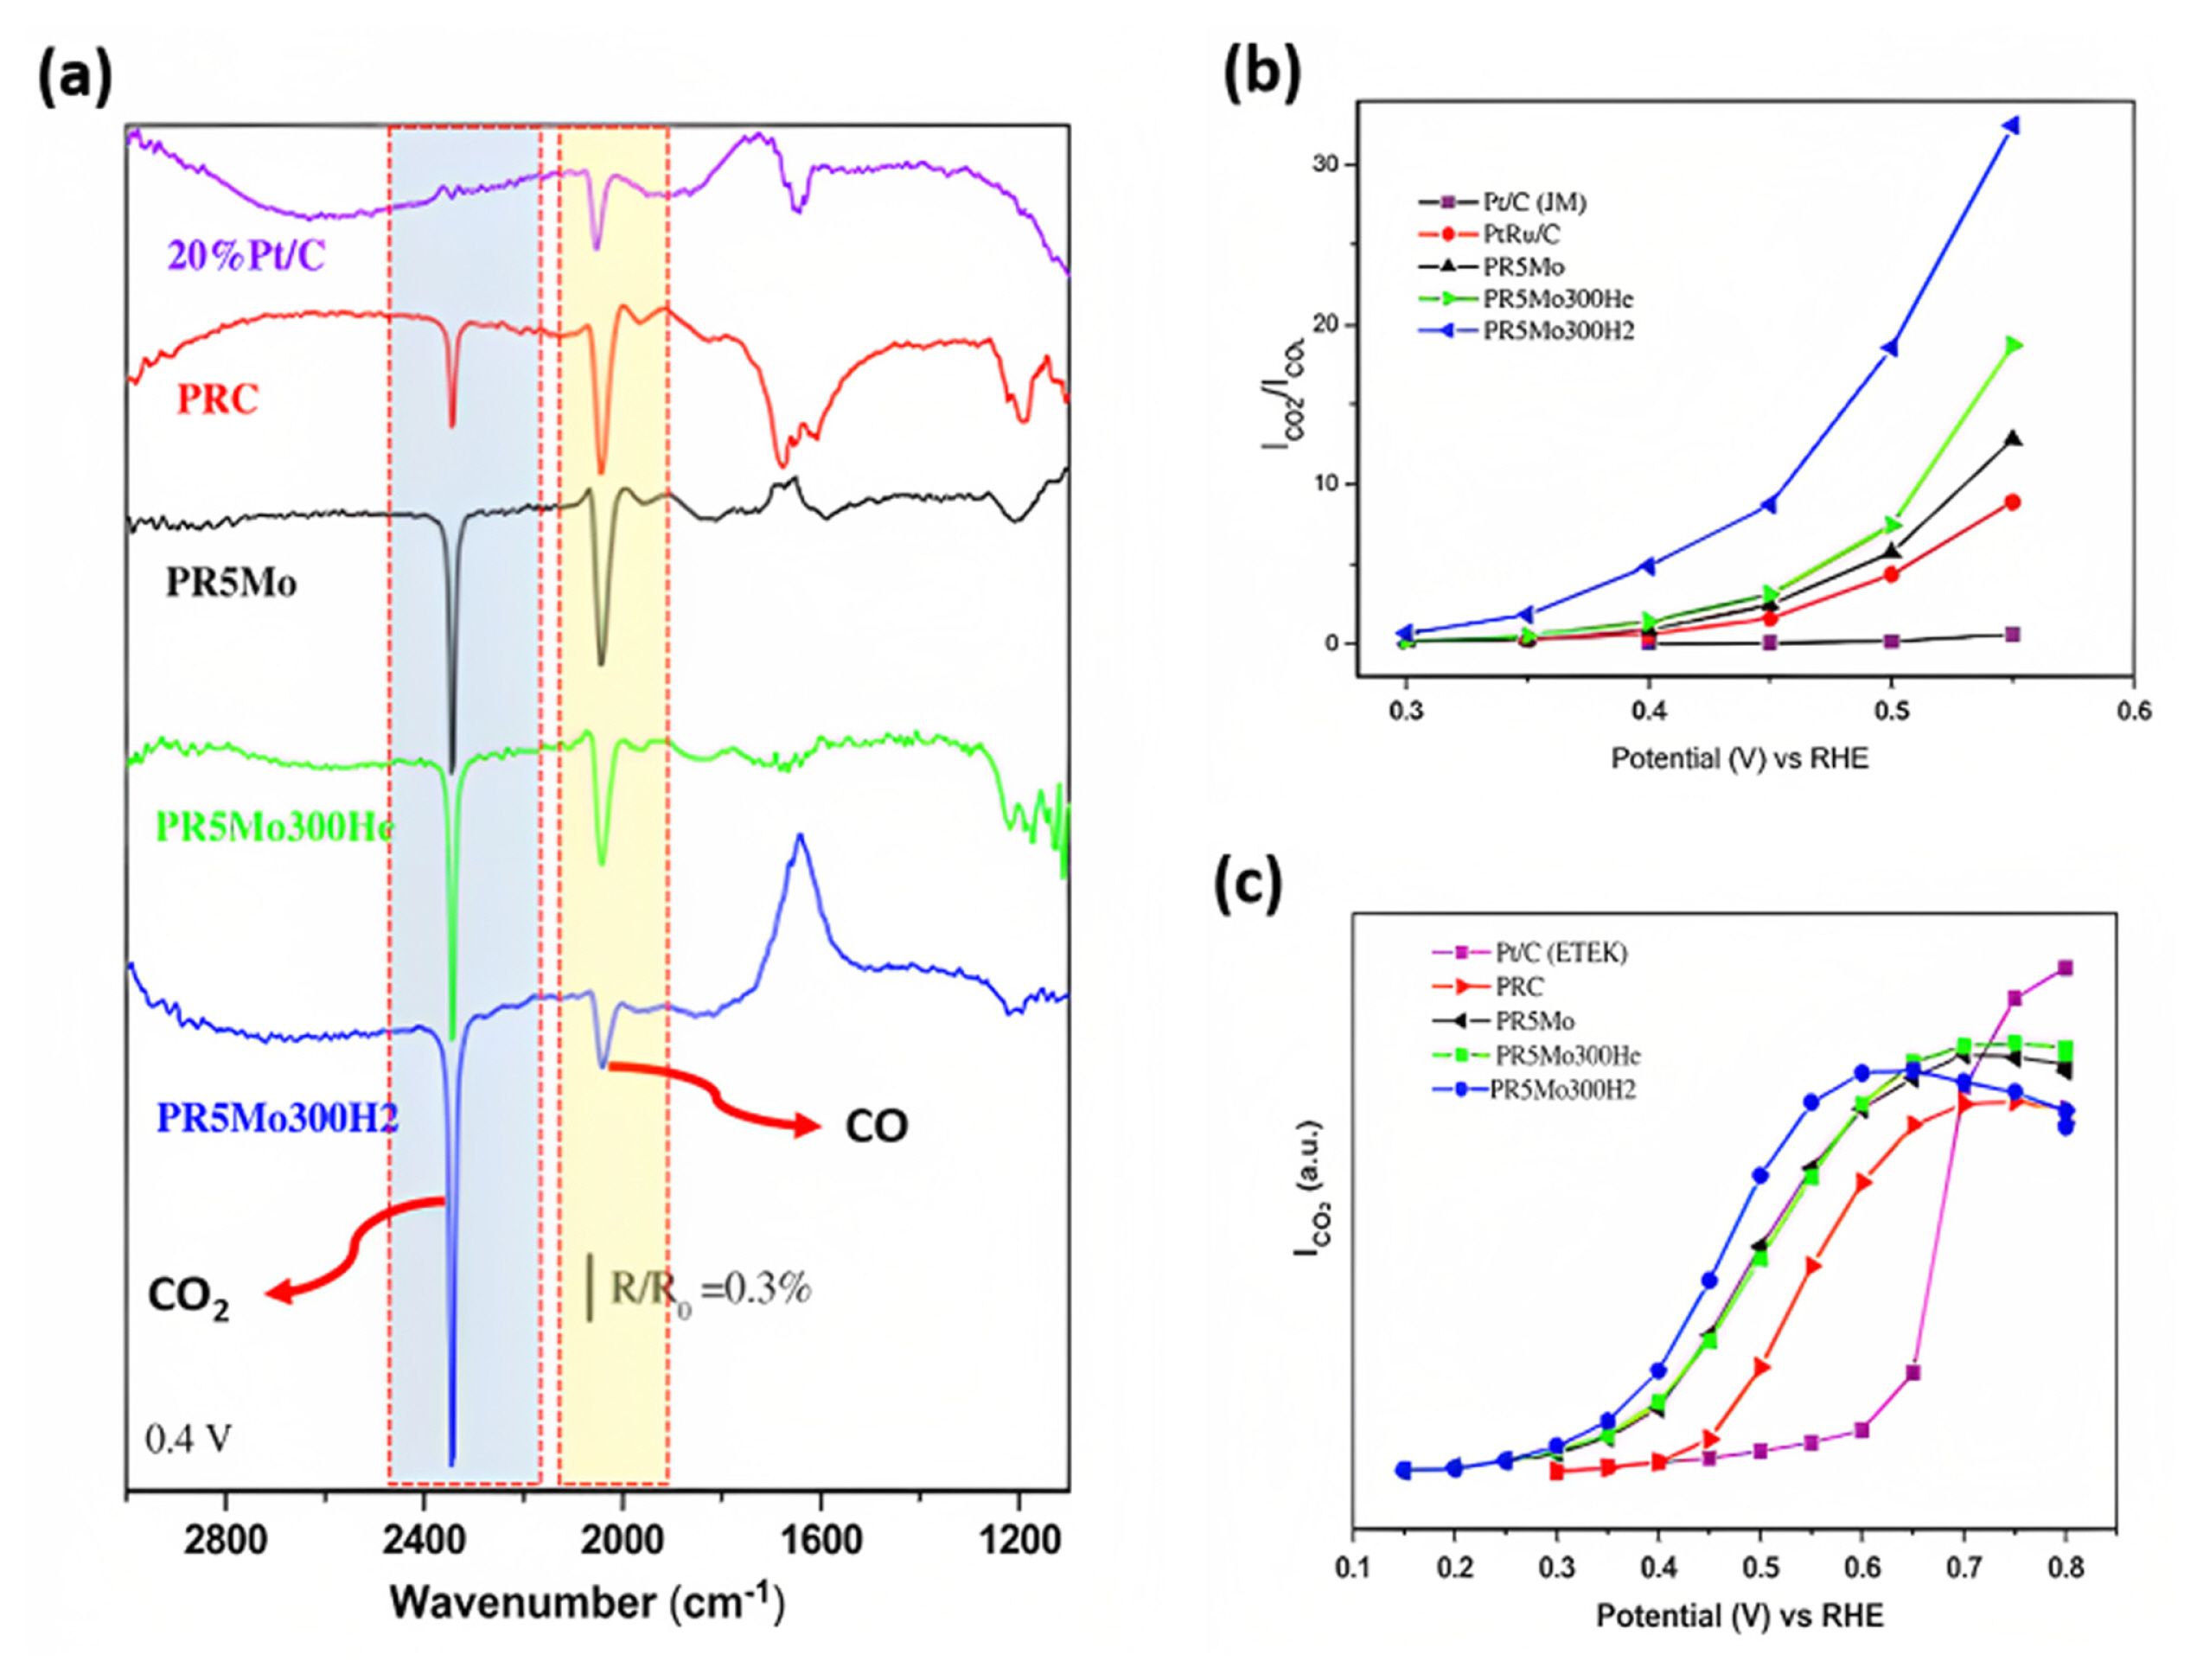
In-situ Fourier Transform infrared spectroscopy (FTIR) spectra of alcohol oxidation can provide insight into the chemical transformations that occur during the oxidation process and can be used to identify the specific chemical products that are formed. The FTIR spectra of alcohol oxidation can be categorized into three groups: high frequency, medium frequency, and low frequency. Tsiouvaras et al. [71] comprehensively discussed methanol oxidation to CO and CO2 over different catalysts, using in situ FTIR spectroscopy (Fig. 10). In the highŌĆōfrequency region, the bands assigned to CO2 and CO production are around 2343 cmŌłÆ1 and ~2040ŌĆō2060 cmŌłÆ1 (Fig. 10(a)), are highlighted in the blue and yellow region of FTIR spectrum. The bridge CO band (weakly bonded) was also detected at ~1836 cmŌłÆ1 [74]. The vibration of the HŌĆōOŌĆōH bonds in the water molecule was observed at ~1647 cmŌłÆ1. The spectral band observed at 1200 cmŌłÆ1 was attributed to CHO species, whereas the characteristic bands of formaldehyde and carbonyls, typically located at 1450 cmŌłÆ1 and 1280 cmŌłÆ1, were not identified, which means lesser intermediate formed under the alcohol oxidation. Fig. 10(b,c) presented the integrated intensity of CO2 and CO2/CO species observed in FTIR spectrum during the methanol oxidation using binary and ternary catalysts (PtRuMo) with/without heat treatment in H2 and He atmosphere.
The CO2 production band was smaller than the CO band in the binary catalyst, whereas all ternary catalysts presented a larger CO2 production band than the CO band [71,74,76]. The PR5Mo300H2 catalyst exhibits the largest difference between the CO and CO2 bands. This means that the CO band in FTIR measures the CO coverage and catalyst tolerance, while the CO2 band signals the amount of methanol completely oxidized to CO2 and is used as an activity indicator [71]. The role of Mo in PtMo-ECs to facilitate the ŌłÆOH species to the Pt. Mo is the form of oxyhydroxides ŌłÆO(OH) at low potentials that can promote CO oxidation, resulting in higher CO tolerance and alcohol activity. The CO oxidation steps are presented in Eq. 13 and 14.
In the case of the ethanol oxidation reaction, FTIR spectra resemble the methanol oxidation reaction except for identifying carbonate and larger intermediate product species. The highŌĆōfrequency region shows an upward band appears between ~2340ŌĆō2050 and ~2010ŌĆō2050 cmŌłÆ1 corresponds to the generation of CO2 and CO species from ethanol oxidation [8,77,78], and the absorption bands at approximately 2800ŌĆō2900 cmŌłÆ1, which can be attributed to the asymmetrical stretching of the CŌĆōH bonds [34]. The generation of CO2 has been observed in most of the previous studies. The midŌĆōfrequency region ranges from ~1710ŌĆō1280 cmŌłÆ1, attributed to the vibration caused by the intermediate species of acetate and acetaldehyde. The absorption bands at 1716, 1410, and 1284 cmŌłÆ1, related to the formation of intermediates containing the carbonyl C=O stretching mode of carboxylic (COOH) or aldehyde (ŌłÆCHO), CŌĆōO stretching vibrational mode of CH3COOH and CŌĆōO and ŌłÆOH deformation bands of ŌłÆCOOH [8,77]. The carbonate (CO32ŌłÆ) band was previously reported at 1370 cmŌłÆ1 in the spectrum, suggesting the oxidation of CO2 by the OHŌłÆ species. Various researchers claim that the suppression of the carbonated band (~1350 cmŌłÆ1) is due to overlap with the CŌĆōO band of acetate ions (ŌłÆCOOŌłÆ) at ~1410 cmŌłÆ1 [78,79]. The lowŌĆōfrequency region displays peaks around ~1080, ~1036, ~926, and ~874 cmŌłÆ1 associated with bands of ethanol; the increase in intensity signifies ethanol consumption [77ŌĆō79]. The acetic acid deformation band at 1350 cmŌłÆ1 shifted to a higher frequency at 1390 cmŌłÆ1, suggesting ethanol consumption [80]. Methanol and ethanol exhibited broad peaks in the 3200ŌĆō3600 cmŌłÆ1 range, corresponding to the stretching vibration of the OŌĆōH bond. The main difference between the FTIR spectra of ethanol oxidation and oxidation is that the ŌłÆOH band is stronger and wider in ethanol because of the two ŌłÆOH groups. The following reaction is anticipated during ethanol oxidation based on the In-situ FTIR spectroscopy results (Eq. 13ŌĆō15) [78]:
5.2 Structural properties
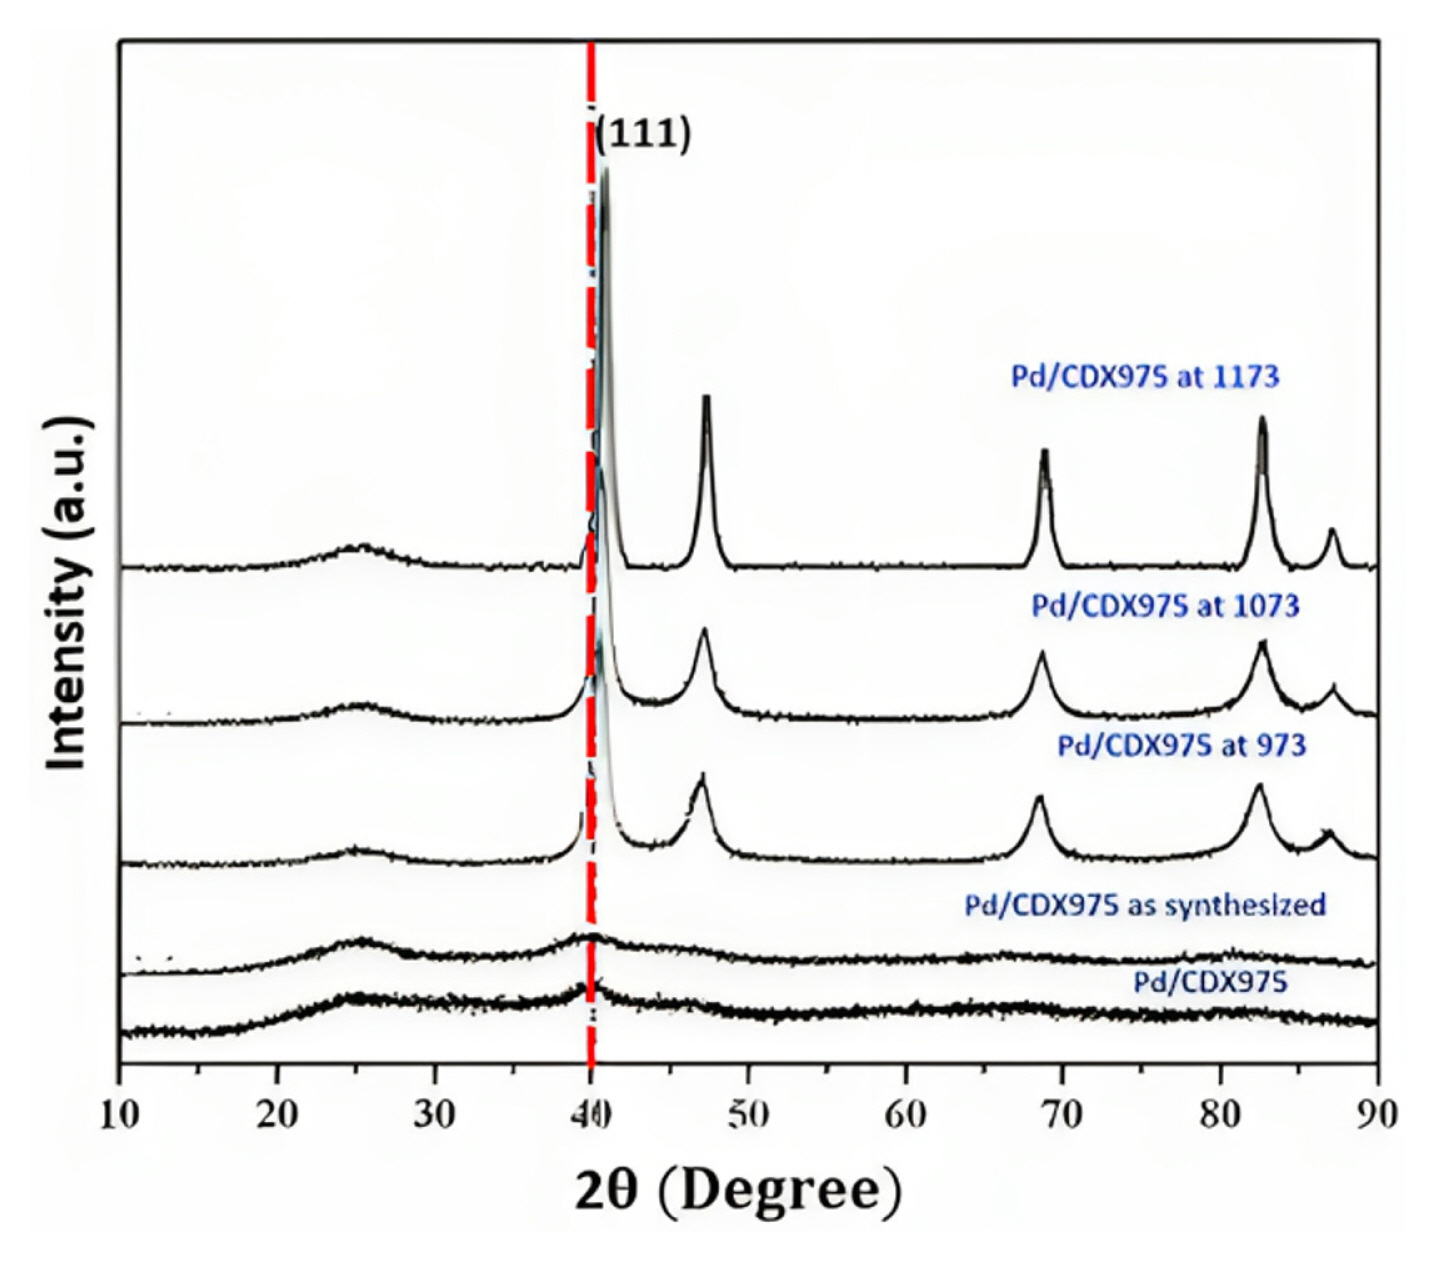
Researchers observed that intermixing of Mo in Pt either existed in the form of Pt-Mo alloy [8,14,56,70,81ŌĆō83] or a solid solution along with Mo oxide clusters [8,36,84,85]. The lattice parameters of Pt-Mo ECs are so close to pure Pt that the composition of the nanocrystalline phase could not be determined accurately [82,84,86]. It has commonly been observed that Pt/Mo-ECs exhibit minimal peaks of complete absence or Mo peaks other than Pt indicate the successful alloying of PtMo. Fig. 11 shows the peak positions in the PtŌĆōMo alloys that mainly reflect the (111) crystal plane of Pt/Mo-ECs. This peak is often used as a reference peak to determine the size of nanoparticles using the Debye-Scherrer equation [87]. The Pt {111} facet is the most active and stable, providing optimal binding energy between the Pt atoms and the adsorbed species AOR, because it does not undergo surface reconstruction, unlike Pt {100} and Pt {110} surfaces [88]. The position of the (111) peak in the XRD spectra of Pt nanoparticles is typically around 2╬Ė = 39ŌĆō40┬░, with other observable peaks appearing at 2╬Ė = 46ŌĆō48┬░, 67ŌĆō69┬░, and 81ŌĆō82┬░, that are related to the (200), (220), and (311) fcc crystal planes of Pt [16,44,53,83,89,90]. Alloying Pt with Mo atoms can result in a contraction of the Pt crystal structure lattice parameter, revealing the same diffraction peak as Pt/C, and a shift in the XRD peak position to a higher diffraction angle, suggesting the formation of a PtMo alloy [10,36,57]. Hernandez et al. [57] observed that the XRD reflection of PtMo/C alloys is the same as Pt/C, with lattice parameters a = 3.92 ┬▒ 0.02 ├ģ, similar to 3.92 ├ģ fcc cell of Pt due to nearly similar elemental radii of Mo and Pt [81,85]. No noteworthy diffraction peaks of Mo were detected, suggesting that a low degree of Mo alloyed with Pt or Mo exists in an unalloyed oxide with poor crystallinity of Mo [46,82,91]. The lower degree of alloying between Pt and Mo corresponds to increased lattice parameters compared to the solution. De et al. [10] suggested that the diffraction peaks of MoO3 did not appear in the XRD pattern because the MoO3 phase was converted to an amorphous state during the Pt reduction process. The XRD position shifted to a higher angle of diffraction contraction of the lattice parameter owing to alloy formation with dissimilar atomic radii between the Mo and Pt/Pd atoms [46]. The extent of the shift in the peak position and lattice parameters increased with increasing temperature, suggesting an increase in alloying in PtMo [91,92]. The heat treatment temperature of PtMo-ECs, between 400 and 700 degrees Celsius, enables the restoration of the singleŌĆōphase Face-centered (fcc) structure [82]. The less intense peak around 2╬Ė = 25┬░ corresponds to the (002) diffraction peak of crystalline graphitic carbon [57,66,73].
Similarly, Rao and Viswanathan [73] observed that the diffraction peak shifted to a higher value of the diffraction angle as the heat treatment temperature for Pd-Co-Mo/CDX975 increased from 973 to 1173 K corresponding to the contraction of the lattice due to alloy formation [73] (Fig. 11). Even, several reports suggested that diffraction peaks of the ternary PtRuMo catalyst showed a lower shift in the diffraction angle than those of the binary PtRu/C catalyst. Incorporating Ru (atomic no. 44) in Pt (atomic no. 78) results in a peak shift to a higher diffraction angle. Alloying with Pt, Ru, and Mo resulted in higher stability and, thus, a lower shift to diffraction angle [25]. Tsiouvaras et al. [71] demonstrated the effect of He and H2 gases on the heat treatment of a PtRuMo/C catalyst. When He was used for treatment, there was only a minor increase in the particle grain size. However, treatment with H2 resulted in a more significant change. Adding Mo to the PtRu catalyst produced a noticeable shift in the Pt (111) peak towards a higher diffraction angle, particularly in the PR5Mo300H2 sample. This shift often indicates the formation of a PtRu alloy and suggests that Mo incorporation enhances the interaction between Pt and Ru [71]. Similar diffraction peaks were observed in PdŌĆōMo and MoŌĆōPd nanoparticles for PtMo/C. The diffraction slightly shifted towards higher 2╬Ė values, indicating the compression of the Pd lattice. This compression can be attributed to the partial incorporation of Mo into the Pd structure. Additionally, previous research suggests that the deformation of lattice planes due to the small size and support materials can cause changes in lattice parameters [54]. It is evident from previous studies that alloying of Pt/Pd with Mo nanoparticle not only contract the lattice parameter, it also changes in electronic structure, which relatively down-shift the d-band center of Pt/Pd involved in the adsorption of the absorbate for methanol/CO oxidation [46,54].
5.3 X-ray photoelectron spectroscopy
Table 2 presents the peak positions of XPS for different electrocatalysts for fuel cells. The various research articles summarize the XPS data for interpreting Mo-based electrocatalystsŌĆÖ structural chemical and chemical properties. The electronic effect can be observed by comparing the binding energy of Pt(4f) and Mo(3d) bands of Pt/Mo-ECs XPS spectra. The XPS spectra of the PtŌĆōMo alloy, MoO3, Mo2C, MoS2, and MoN nanoparticles can provide information about these materialsŌĆÖ chemical composition, electronic structure, and surface properties at the nanoscale. The peak positions in the XPS spectra correspond to the binding energy, which helps to understand the charge transfer mechanism from the metallic surface of the catalyst to support the catalyst and viceŌĆōversa. The XPS spectrum of the PtŌĆōMo alloy nanoparticles depended on the alloy composition, size, and shape of the nanoparticles. The peaks combined the individual metals (Pt and Mo) and any new chemical states that formed in the alloy. The chemical composition of the PtMo alloy revealed two distinct peaks for Pt and Mo at ~72 eV and ~230 eV, respectively. The Pt 4f signal is also broken down into three pairs of doublets: 71.13 and 74.51 eV, 71.94 and 75.23 eV, and 74.40 and 77.50 eV. These doublets correspond to metallic Pt, PtŌĆōO or PtŌĆō(OH)2, and PtO2, respectively. At the same time, the Mo 3d doublet level spectra peak appears at around 228.6, 229.1, and 230.1 eV for Mo0, Mo4+, and Mo6+ oxidation states. Molybdenum oxide MoOx usually exists in two stable states, MoO2 and MoO3. Mo in MoO2 exists in the +4-oxidation state, whereas MoO3 is in the +6-oxidation state. The XPS spectra of these two compounds show differences in the energy levels of the Mo 3d and O 1s peaks. In the case of MoO2, the Mo 3d5/2 peak appeared at approximately 229 eV, whereas the Mo 3d3/2 peaks were typically observed at approximately 232 eV. These peaks are shifted to higher energies than the corresponding peaks in MoO3 owing to the lower oxidation state of Mo in MoO2. The O 1s peak of MoO2 is typically observed at approximately 530 eV, which is also shifted to a higher energy than that of MoO3. The XPS spectra of MoO3, the Mo 3d5/2 peak, were expected to appear at approximately 233 eV, whereas the Mo 3d3/2 peak is observed at around 236 eV. The O 1s peak of MoO3 is typically observed at approximately 530 eV, which is lower in energy than that of MoO2. The energy separation between the Mo 3d5/2 and Mo 3d3/2 peaks is also expected to be slightly larger in MoO3 than in MoO2, reflecting the higher oxidation state of Mo in MoO3. The spin energy separation between the Mo 3d3/2 and Mo 3d3/2 lies close to 3.1┬▒0.1 eV, related to either the Mo2+ [48], Mo4+ [93], or Mo6+ [94] oxidation state of Mo.
During the survey scan of Mo-ECs (MoN, Mo2C, and MoS2) nanomaterials, MoOx phases (MoO2 and MoO3) were also detected, which suggests that Mo species were either oxidized during the synthesis process or absorbed or contaminated by atmospheric oxygen [32,50,56,95,96]. Bayati et al. [97] suggested that various oxidation states, such as Mo2+, Mo3+, Mo5+, and Mo6+ as in a single Mo, can be linked to the presence of carbide, nitride, and oxide species, respectively [97,98]. A positive shift of 0.2 eV compared to the Pt 4f7/2 of pure Pt can be attributed to an induced positive charge on the dispersed Pt particles interacting with the support and suggesting that Mo atoms were not alloyed with Pt in the PtŌĆōmolybdenum carbideŌĆōderived composites [97]. Yan et al. [53] discovered that a positive shift in XPS spectra occurred after the introduction of Mo2C. These results indicate an increased interaction force between Pt and Mo2C compared to that between Pt and C, which might result in the increased electrochemical stability of Pt/CŌĆōMo2C.
5.4 X-ray absorption spectroscopy
XAS is an important analytical technique to investigate the electronic and structural changes in Mo-ECs during electrochemical reactions [106]. XANES spectra analysis has revealed a shift in the pre-edge and white line peaks to higher energy, indicating a higher oxidation state of Mo in the electrocatalysts used in DAFCs [84]. This suggests that the electronic properties of Mo atoms in the electrocatalysts are altered, which could affect their catalytic activity [80ŌĆō82]. XAS analysis has been used to investigate the coordination environment of Mo atoms in the electrocatalysts, indicating that Mo atoms in the electrocatalysts are well dispersed in the nanomaterials, leading to higher catalytic performance. EXAFS spectra analysis provides further insights into the local atomic structure around Mo atoms in the electrocatalysts, showing a greater degree of MoŌĆōO coordination and the presence of both Mo oxide and Mo metal clusters. Overall, XAS and XANES spectra analysis have provided valuable insights into the electronic and structural properties of MoŌĆōbased nanomaterials in DAFCs, aiding in optimizing their composition and structure to enhance their catalytic activity.
X-ray absorption at the Pt L3 edge for Pt/C (0.54 V) is used to measure the occupancy of Pt 5d electronic states, with the white line intensity being proport ional to the occupancy of 5d states [70,82,107]. Mukerjee et al. [70] investigated methanol oxidation using PtMo/C electrocatalyst in 1 M HClO4 solution. XANES spectra revealed an increase in white line intensity and broadening at a potential of 0.54 V, suggesting a buildup of CO on the Pt surface during methanol oxidation. At 0.84 V, adsorption by oxygenated species becomes evident, resulting in two peaks (Pt/Pt and Pt/C interactions) below 2 ├ģ, similar to those observed for Pt/C with adsorbed CO. The XANES spectra of the PtMo/C catalyst shows an increase in Pt dŌĆōband vacancies with increasing potential up to 0.6 V, indicating that oxyhydroxides of Mo are not removing C1 oxide species. However, beyond 0.7 V, the d-band vacancies show a lowering trend, which could be due to the formation of Pt/OH on the surface resulting from the activation of water in the aqueous acid on the Pt surface. This suggests that the removal of CO species in PtMo/C beyond 0.7 V is due to the formation of oxides on Pt due to water activation [70].
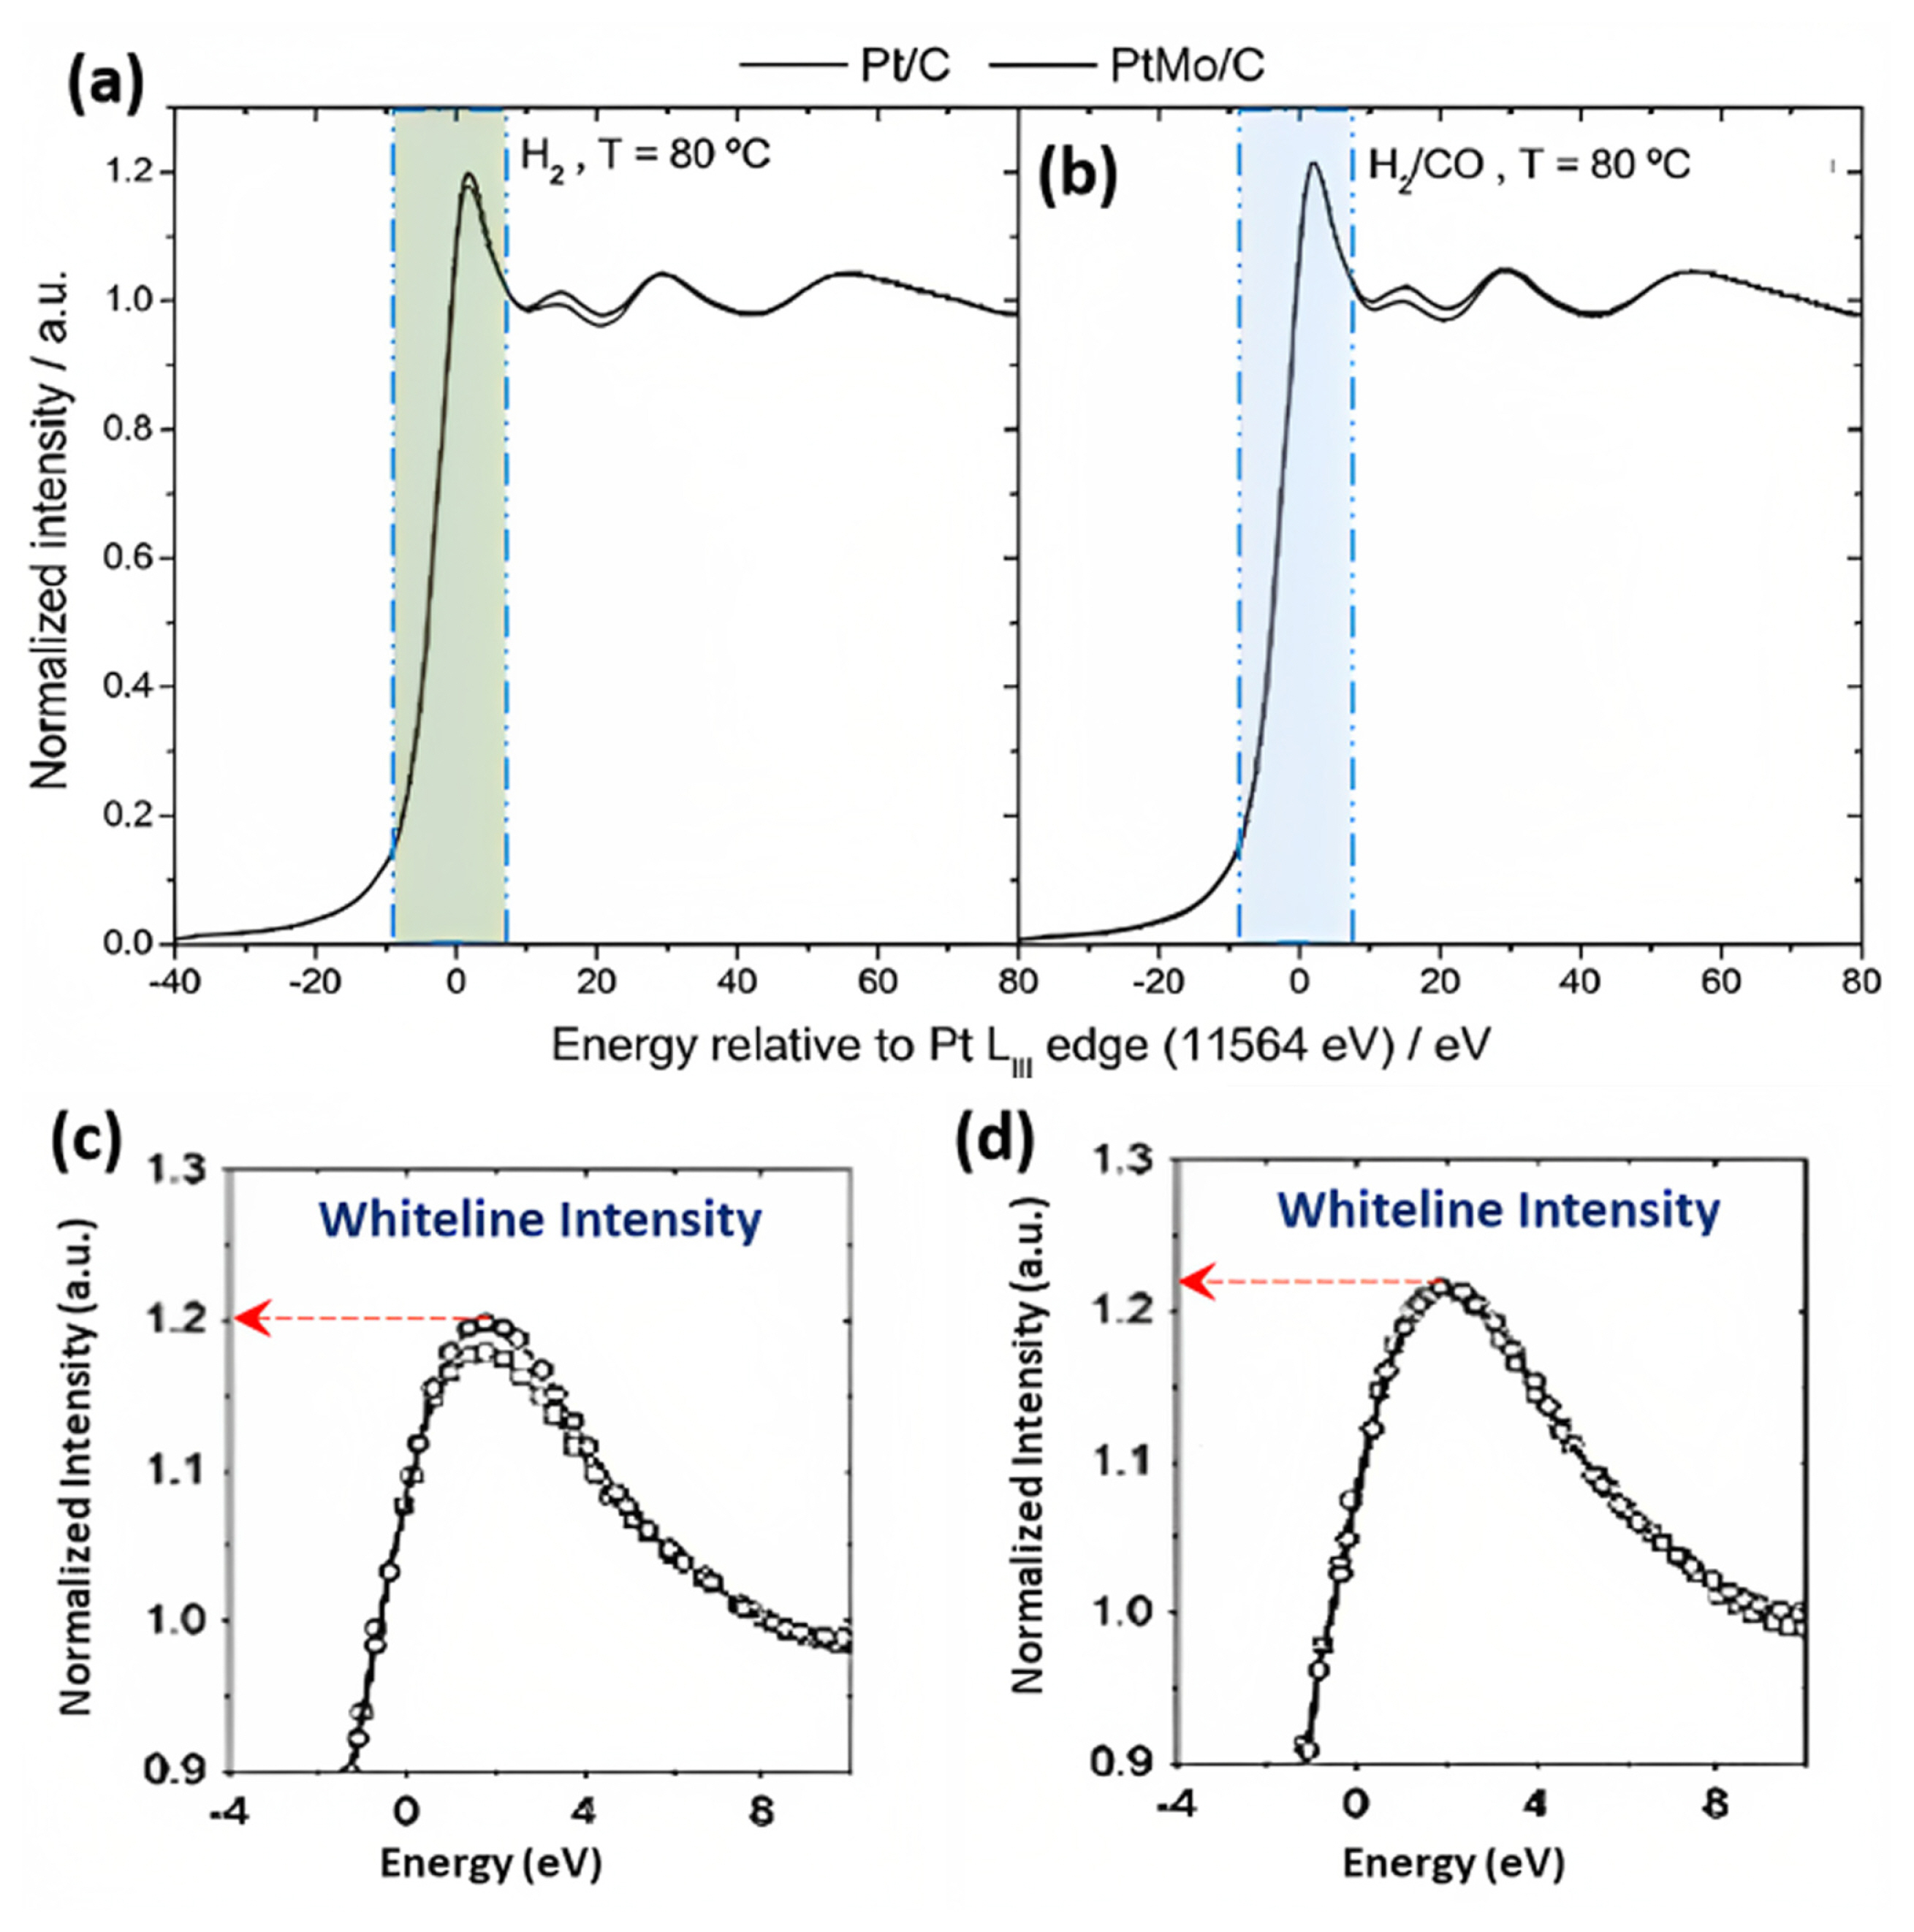
Fig. 12(aŌĆōd) represented the X-ray absorption profiles (XANES) at the Pt L3 edge (11,564 eV) for Pt/C and PtMo/C materials under different conditions: 0.1 V vs. RHE in two different gas environments, H2 and H2/CO, both at 80┬░C [108]. The key focus was on the ŌĆ£white-lineŌĆØ intensity, a peak near the edge energy directly related to the electron density in PtŌĆÖs 5d band. In an H2 atmosphere (Fig. 12(a,c)), the presence of Mo near Pt atoms slightly altered the Pt chemical environment, resulting in a minor increase in the Pt 5d band vacancy, indicated by a slightly higher absorption intensity. Analysis of XPS data revealed that the Mo species predominantly existed as Mo (VI) oxide, consistent with prior literature suggesting that metal oxides near Pt atoms can withdraw electrons, reducing Pt-CO adsorption energy. In an H2/CO atmosphere (Fig. 12(b,d)), Pt/C and PtMo/C exhibited increased Pt 5d band vacancies due to CO adsorption compared to hydrogen alone. This was attributed to Pt transferring electrons to CO through electron back-donation. However, the Pt/C electrocatalyst displayed a more significant increase in electron vacancy, indicating that the presence of Mo oxide near Pt atoms reduced the spillover of electrons from Pt to CO, consequently weakening CO adsorption strength [109].
Hassan et al. [82] observed that heatŌĆōtreated PtMo/C electrocatalysts exhibit a slight increase in the white line intensity compared to prepared catalysts when exposed to H2 and H2/CO atmospheres, indicating a slight increase in the occupancy of the Pt 5d band, possibly due to changes in particle size. It is evident in various studies that the white line intensity increases more with increasing potential for catalysts with smaller particle sizes and the effect of heat treatment indicating a modification of the average Pt oxidation state [31,109]. The white line intensity of PtMo/C is slightly higher than Pt/C, indicating an increase in the number of Pt 5d band vacancies due to alloying [70]. CO adsorption affects the electronic properties of Pt, with the white line intensity of Pt/C significantly increasing after CO exposure, indicating an increase in the number of Pt 5d band vacancies due to electron backŌĆōdonation from Pt to CO. A similar but smaller effect was observed for PtMo/C. The increase in the white line intensity suggests that CO adsorption alters the electronic structure of Pt, and this effect is more pronounced in Pt/C than in PtMo/C [82]. According to the Mo K-edge XANES spectra at 0.0V, Mo is present in the form of a hydrated oxide species with an estimated oxidation state of Mo5+. There is a noticeable change in the oxidation state of Mo from Mo5+ to Mo6+ at 0.54 V, which remains constant until 0.85 V. The redox couple observed at approximately 0.2V and 0.45V in the voltammogram results corresponds to the presence of Mo in an oxidation state between Mo5+ and Mo6+ [85]. In another work, Hassan et al. [109] investigated the XANES spectra of PtMo/Mo2C/C, PtMo/C, and Pt/C electrocatalysts were recorded before and after CO adsorption at 50 mV vs. RHE. The spectra showed a slight increase in the white line intensity of PtMo/Mo2C/C and PtMo/C compared to Pt/C in the H2 atmosphere, indicating a change in the chemical environment of Pt due to the presence of Mo or Mo2C. The intensity of the white line increased noticeably in all three electrocatalysts after CO adsorption, indicating electron back donation from Pt to CO, and this effect was greater in Pt/C than in PtMo/Mo2C/C and PtMo/C catalysts [109].
In conclusion, White line intensity in X-ray absorption at the Pt L3 edge can be used to measure the occupancy of Pt 5d electronic states, which increases with the number of Pt 5d band vacancies caused by CO adsorption or particle size. XANES spectra studies on PtMo/Mo2C/C, PtMo/C and Pt/C electrocatalysts reveal a slight increase in PtMo/Mo2C/C and PtMo/C white line intensity after CO adsorption, indicating a change in the chemical environment of Pt due to Mo, while Pt/C shows a greater effect of CO adsorption compared to PtMo/Mo2C/C and PtMo/C. Investigating the structural, electrical, and spectroscopic results is crucial for understanding the chemical and electronic state change in Mo with its surroundings, which is essential for developing efficient Mo-ECs for DAFC.
6. Challenges and Opportunities in Mo-ECs
MolybdenumŌĆōbased electrocatalysts have been widely studied in DAFCs owing to their unique properties, such as high electrocatalytic activity towards alcohol oxidation reactions, low cost, and abundant availability. Despite these advantages, several challenges must be addressed to improve the performance of DAFCs. Herein, we discuss some key challenges associated with MoŌĆōbased electrocatalysts for DAFCs.
6.1 Low durability
One of the main challenges associated with MoŌĆōbased electrocatalysts for DAFCs is their low durability [21]. During the electrochemical reaction, MoŌĆōbased catalysts are subjected to harsh conditions that can cause surface oxidation [37,50,56,95,96], corrosion, and Mo dissolution, leading to loss of catalytic activity over time [8,71,82,83,86,100,109ŌĆō111]. Several studies have been conducted to improve the durability of Mo-based catalysts, including carbon-based supports, such as graphene and carbon nanotubes, to enhance the stability of the catalyst [54,56,72,112,113].
6.2 Limited activity towards CO oxidation
Another significant challenge with MoŌĆōbased electrocatalysts in DAFCs is their limited activity towards CO oxidation. CO is a common intermediate formed during alcohol oxidation and can poison the catalyst surface, reducing activity and efficiency. Several strategies have been proposed to address this issue, such as modifying Mo-based catalysts with other transition metals, such as Pt and Pd, to enhance their activity for CO oxidation [114].
6.3 Synthesis complexity
The synthesis of Mo-based electrocatalysts for DAFCs is complex and challenging. The synthesis conditions, such as precursor concentration [83], temperature [48,49,71,80,89,90], and pH [52,54], must be carefully controlled to achieve the desired morphology, crystal structure, and composition of the catalyst [94]. Several studies have focused on developing new synthesis methods for MoŌĆōbased electrocatalysts, such as hydrothermal and solvothermal methods, to improve the reproducibility and scalability of the synthesis process [46,115].
6.4 Poor electrochemical stability
MoŌĆōbased electrocatalysts can also suffer from poor electrochemical stability, particularly under high current densities and low alcohol concentrations [56,72,112,113]. This instability can reduce the catalysŌĆÖs performance and durability, limiting its practical application. Several strategies have been proposed to improve the electrochemical stability of MoŌĆōbased catalysts, such as using carbon-based supports, such as graphene, reduced graphene oxide, and carbon nanotubes, to enhance the mechanical and electrochemical stability of the catalyst [16ŌĆō18,21,37,54,57,93,94,101].
7. Conclusions
In contrast to Pt and PtŌĆōRu electrocatalysts, the catalytic response of Mo-ECs against different alcohols in both acidic and alkaline fuel cells shows superior performance. However, determining the optimal Mo content in an electrocatalyst remains poorly understood and depends on various factors, including the ratio of alloyed or non-alloyed Mo and preparation conditions such as pH, temperature, precursor nature, and composition. Mo-ECs and their species exhibit unusual oxyphilic behavior, significantly lowering the onset potential for CO oxidation, methanol, and ethanol oxidation. By incorporating Mo into noble metals like Pt and Pd, the onset/peak potential for alcohol or CO oxidation decreases due to forming a complex oxidation state inherent to Mo. Consequently, the catalytic oxidation current density for methanol or ethanol oxidation in DAFCs can be substantially improved from 1ŌĆō10 mA mgŌłÆ1 to 1000ŌĆō2000 mA mgŌłÆ1. However, the susceptibility of Mo-EC catalysts to oxidation and dissolution poses a significant challenge. To address this issue, researchers are exploring methods to modify the surfaces of molybdenumŌĆōbased materials by applying protective coatings or using alloying agents to enhance their stability and durability. Another research focus is the development of novel synthetic approaches for preparing additional support materials, including graphene, carbon nanotubes (CNTs), conducting polymers, and various metal or metal oxides. These materials can impart unique morphologies and structures to molybdenumŌĆōbased materials, enhancing their catalytic activity and performance. Researchers have employed facile and expensive techniques to fabricate nanoscale structures of molybdenumŌĆōbased materials, thereby increasing their surface areas and electrocatalytic activities. These advancements can yield more efficient and stable molybdenumŌĆōbased electrode materials for implementation in DAFCs.