1. Introduction
In response to recent public demand for reducing carbon emissions using fossil fuels [1–4] portable technology is being developed for large-scale applications in electronic devices, and hybrid/full-electric vehicles (EV) [5,6].
Currently, Li-ion batteries are innovative energy storage technology [7–10] and are applied in electronic gadgets, such as mobile phones, and laptop computers; and EVs. Studies have attempted to improve the energy density of lithium-ion batteries for large-scale applications [11]. Consequently, the amount of nickel increased to more than 90%, and the cost was reduced by decreasing the amount of expensive Co [12].
However, the Ni-rich cathode material causes internal microcracks when Li-ions are extracted/inserted, resulting in volume expansion and disruption [13] and the rapid decrease in capacity owing to side reactions with electrolytes during long cycling degraded the electrochemical performance of LIBs and their limited applications [14,15].
First, to improve these limitations caused by volume expansion, various nanomaterial synthesis methods, such as the solution spray method [16], sol-gel method [17], and hydrothermal synthesis [18] are studied. Nanoparticles provide a large contact area between the electrode and electrolyte, reducing the Li-ion diffusion path distance and this facilitates the movement of Li-ions in the charge/discharge process by suppressing the volume expansion of nanoparticles [19,20]. However, side reactions occur between nanoparticles and electrolytes and the cycle characteristics deteriorate [21]. In this study, the nanocarbon layer was formed using a new approach, wherein, polyvinylpyrrolidone (PVP) was directly added during the synthesis process to suppress the side reaction with the electrolyte, which is a challenge in the high-nickel-based cathode materials. Comparing the surface coating state, interfacial resistance, and related electrochemical properties of Li[Ni0.93Co0.07]O2 (NC) synthesized by electrospinning (E-NC) and those synthesized by co-precipitation (C-NC), we investigated the applicability of nanofiber-type E-NC for high-speed charge-discharge secondary batteries.
2. Experimental
2.1 Synthesis
E-NC was prepared using the sol-gel method. LiNO3·6H2O (Alrich, 99%), Ni(NO3)2·6H2O (Alrich, 99%), Co(NO3)2·6H2O (Alrich, 99%), PVP (Mw= 1,300,000, Alrich) were dissolved in distilled water, and CH3OH, HNO3. The solution was stirred at 300 rpm for 24h. The prepared solution was loaded into a syringe and ejected toward a stainless steel collector. The operating voltage was 15–17 kV. The distance between the syringe and collector was maintained at 11–13 cm. Spun nanofibers accumulated in the collector and nanofibers were calcined at 450°C for 5 h and then at 750°C for 12 h in an O2 atmosphere at the heating rate of 3°C/min.
C-NC precursors were prepared by co-precipitation method using NiSO4·6H2O (Samchun, 98.5%) and CoSO4·7H2O (Samchun, 98%). First, a metal ions solution with a concentration of 1 mol L−1 was pumped into a continuously stirred tank reactor (4L) under an N2 atmosphere. Simultaneously, 2 mol L−1 NaOH solution and NH4OH solution, as a chelating agent, were separately pumped into the reactor. The pH of the whole reaction was maintained between 11.5 and 12.0 and the temperature was 53°C. The obtained Ni0.93Co0.07(OH)2 precursor was ball milled with a dried powder of LiOH·H2O and calcined at 750°C for 12 h in O2 atmosphere at a heating rate of 3°C/min.
2.2 Equipment used
The morphology of NC was observed using an environmental scanning electron microscopy (SEM, JEOL, JSM-7610F). X-ray diffraction (XRD, Bruker D8 ADVANCE) measurements were performed in the scan range of 10° and 80° to analyze the structural properties of the precursor and active materials using monochromatic Cu Kα radiation. The amount of carbon was investigated with a CS-230 (Carbon/Sulfur Analyzer, CS-200/LECO).
Electrochemical impedance spectroscopy (EIS) measurements were performed at 25°C in the frequency range of 0.01 Hz–0.1 MHz, and the amplitude of the alternating current was 10mV. Nyquist plots (Z′ vs–Z″) were drawn and analyzed using the Z plot and Z view software.
2.3 Electrochemical tests
The electrochemical performance measurements were performed using a CR2032 coin cell. For the electrochemical test, a slurry was prepared in an 8:1:1 ratio of 80% active material to 10% binder (N-methyl-2-pyrrolidone 10 wt%), and Super P carbon black as the positive electrode. The mixed slurry was uniformly applied to an Al foil and then vacuum-dried at 120°C for 3 h. The batteries were coin cell was assembled in an Ar- glove box with Li-foil acting as counter electrodes and synthesized materials used as working electrodes. Electrochemical tests were conducted at voltages in the range of 3.0–4.3 V. EIS results were tested after 1 and 20 cycles in the frequency of 105–0.01 Hz with an amplitude of 0.01 V.
3. Results and Discussion
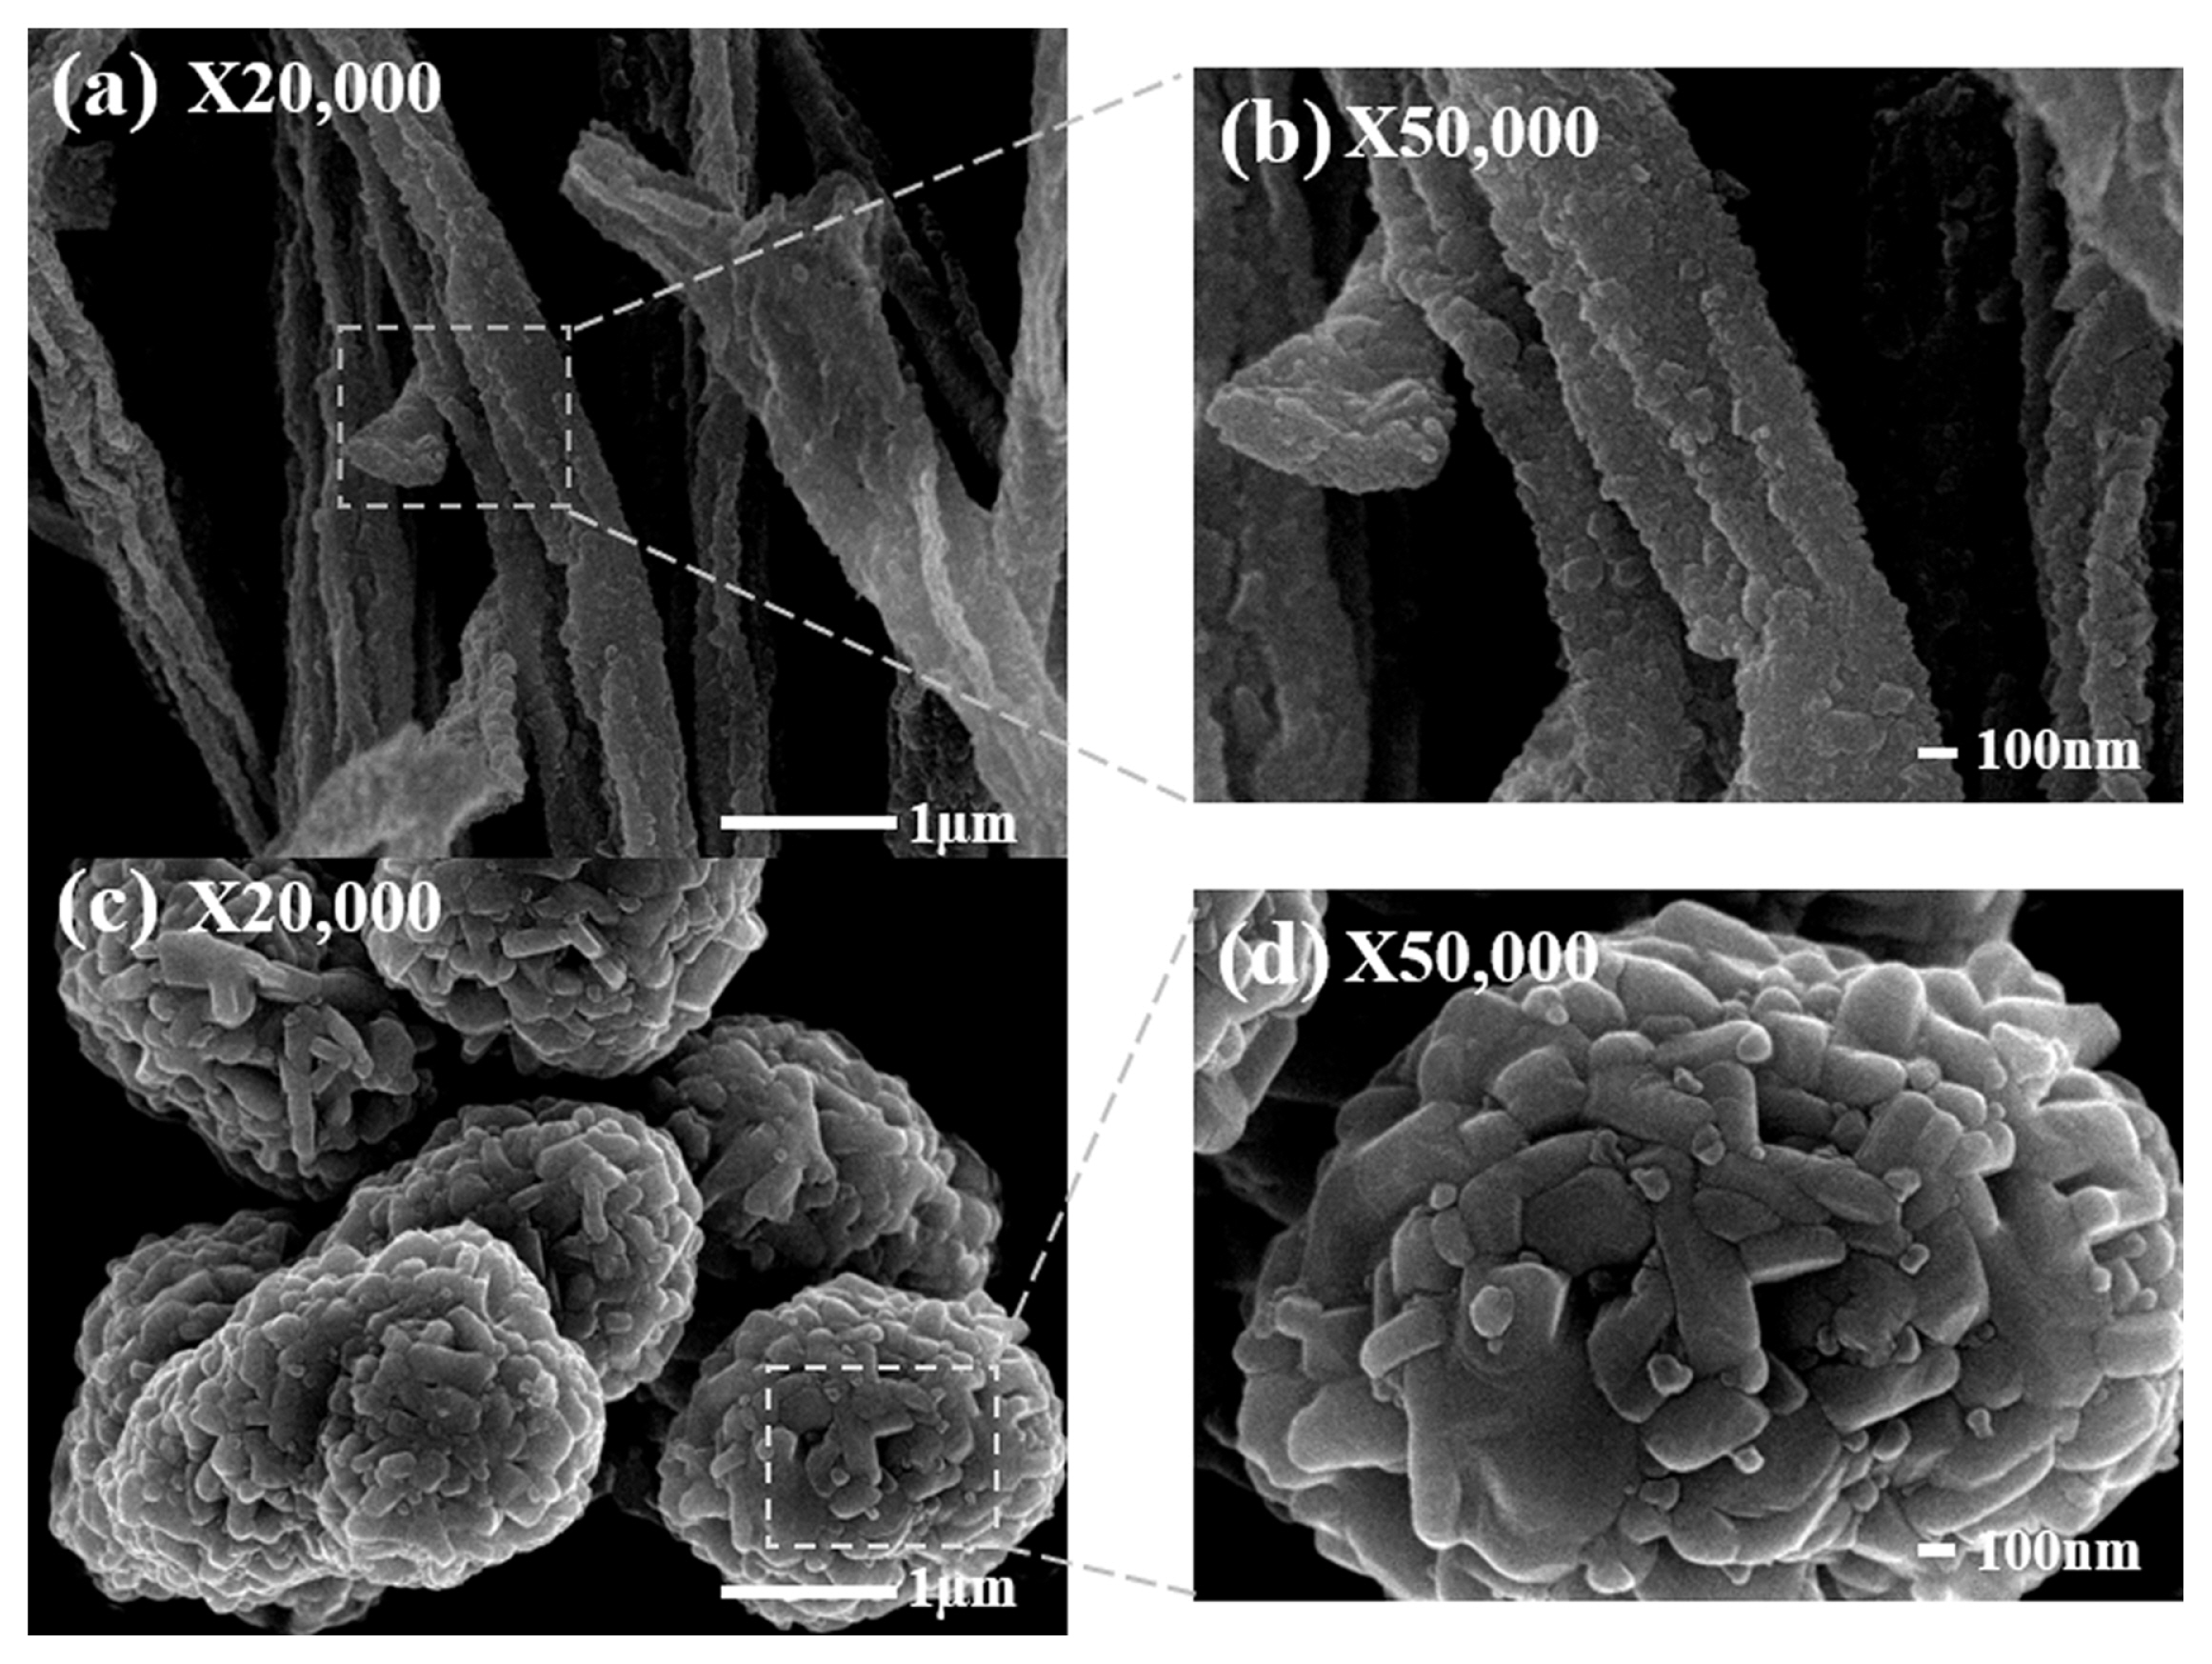
The surface microstructure of the E-NC and C-NC samples is observed using a SEM. Fig. 1(a) shows the nanofiber structure of the E-NC sample. Fig. 1(b) (an enlarged image of (a)) shows the porous structure of E-NC with a primary particle size of 50–100 nm. Fig. 1(c) shows the spherical particles of a C-NC sample. Fig. 1(d) (an enlarged image of (c)) shows a C-NC sample with a primary particle size of 250–300 nm. The morphology of the porous nanofibers of E-NC offers a larger surface area than C-NC, and promotes the efficient charge transfer and the Li-ions diffusion. Also, it is expected that the charge transfer resistance (Rct) will be decreased, and the high-rate charge/discharge performance will be improved [22].
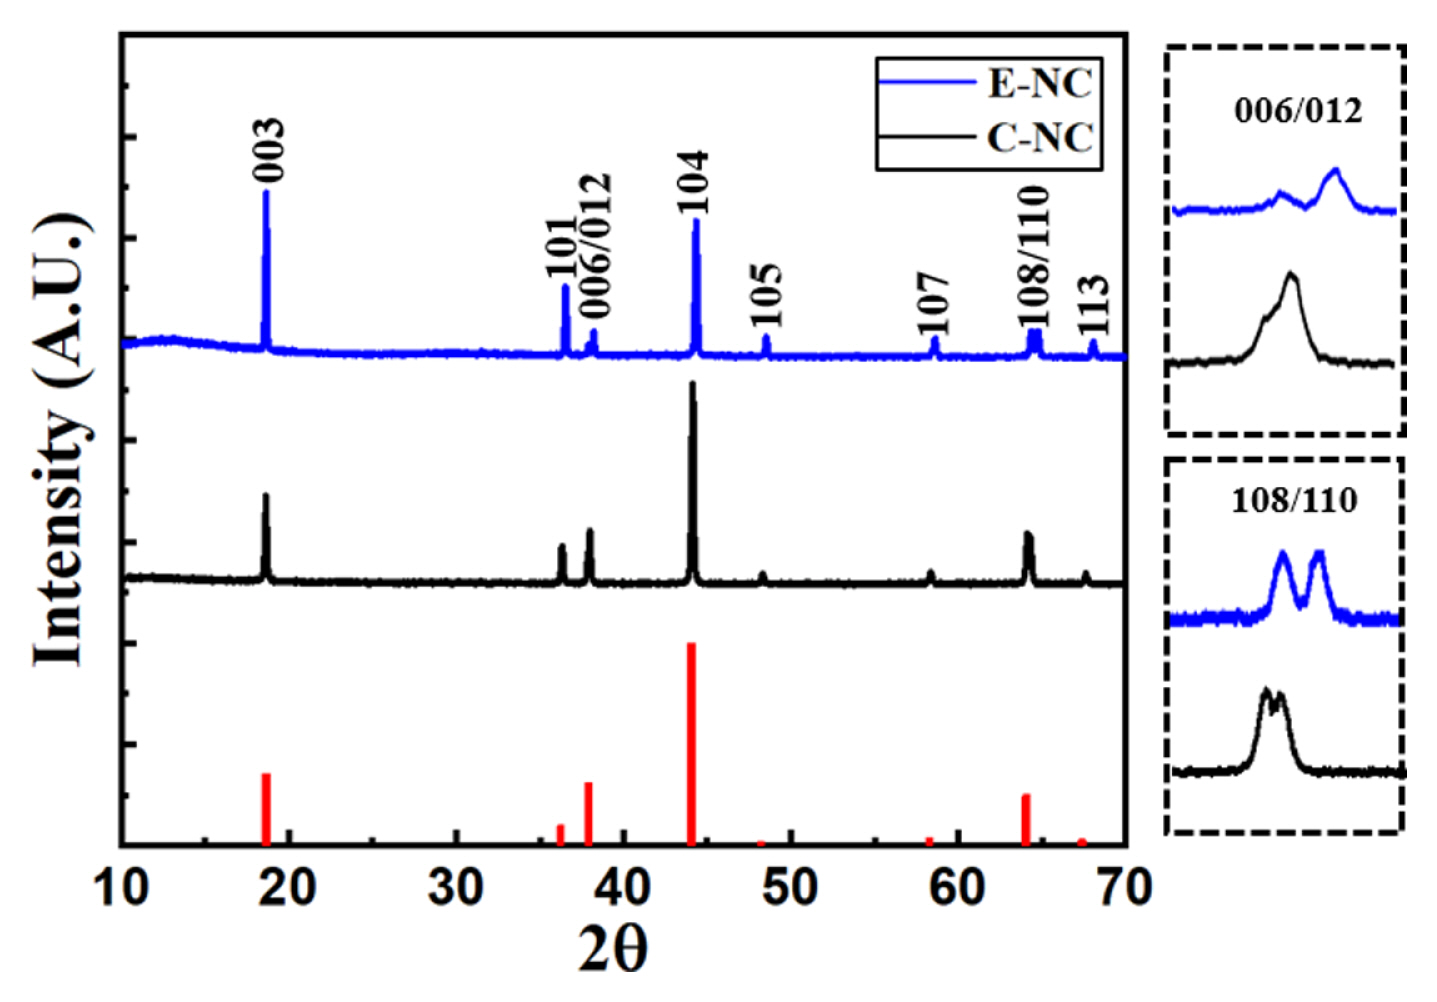
Fig. 2 shows the X-ray diffraction (XRD) pattern of the E-NC and C-NC samples. The diffraction peaks of both E-NC and C-NC indicate a hexagonal structure with an R3m space group without an impurity phase. E-NC sample shows double peaks at (006)/(012) and (018)/(110); This indicates that E-NC has a well-arranged hexagonal structure. Table 1. lists the lattice parameters of E-NC and C-NC samples. Excessed nickel limits Li+ diffusivity due to cation mixing [23]. E-NC shows a higher I(003)/I(104) ratio than C-NC, which means lower cation mixing. E-NC is mixed by a liquid phase method, it is expected that Li, Ni, and Co will be uniformly mixed atomically. C-NC is produced by the solid-state method of mixing a precursor and LiOH·H2O is unlikely uniformly mixed because of the possibility of the atoms of lithium and nickel changing each other. Accordingly, with the high uniformity mixing of E-NC, it is expected to increase Li-ions diffusion, resulting in improve charge/discharge capacity at high rate.
Table 2 shows the carbon amount of the E-NC and C-NC samples. The carbon amount of the E-NC sample is three times higher than that of the C-NC sample, expecting the improvement in electrical conductivity, high-rate charge/discharge performance and decrease charge transfer resistance (Rct).
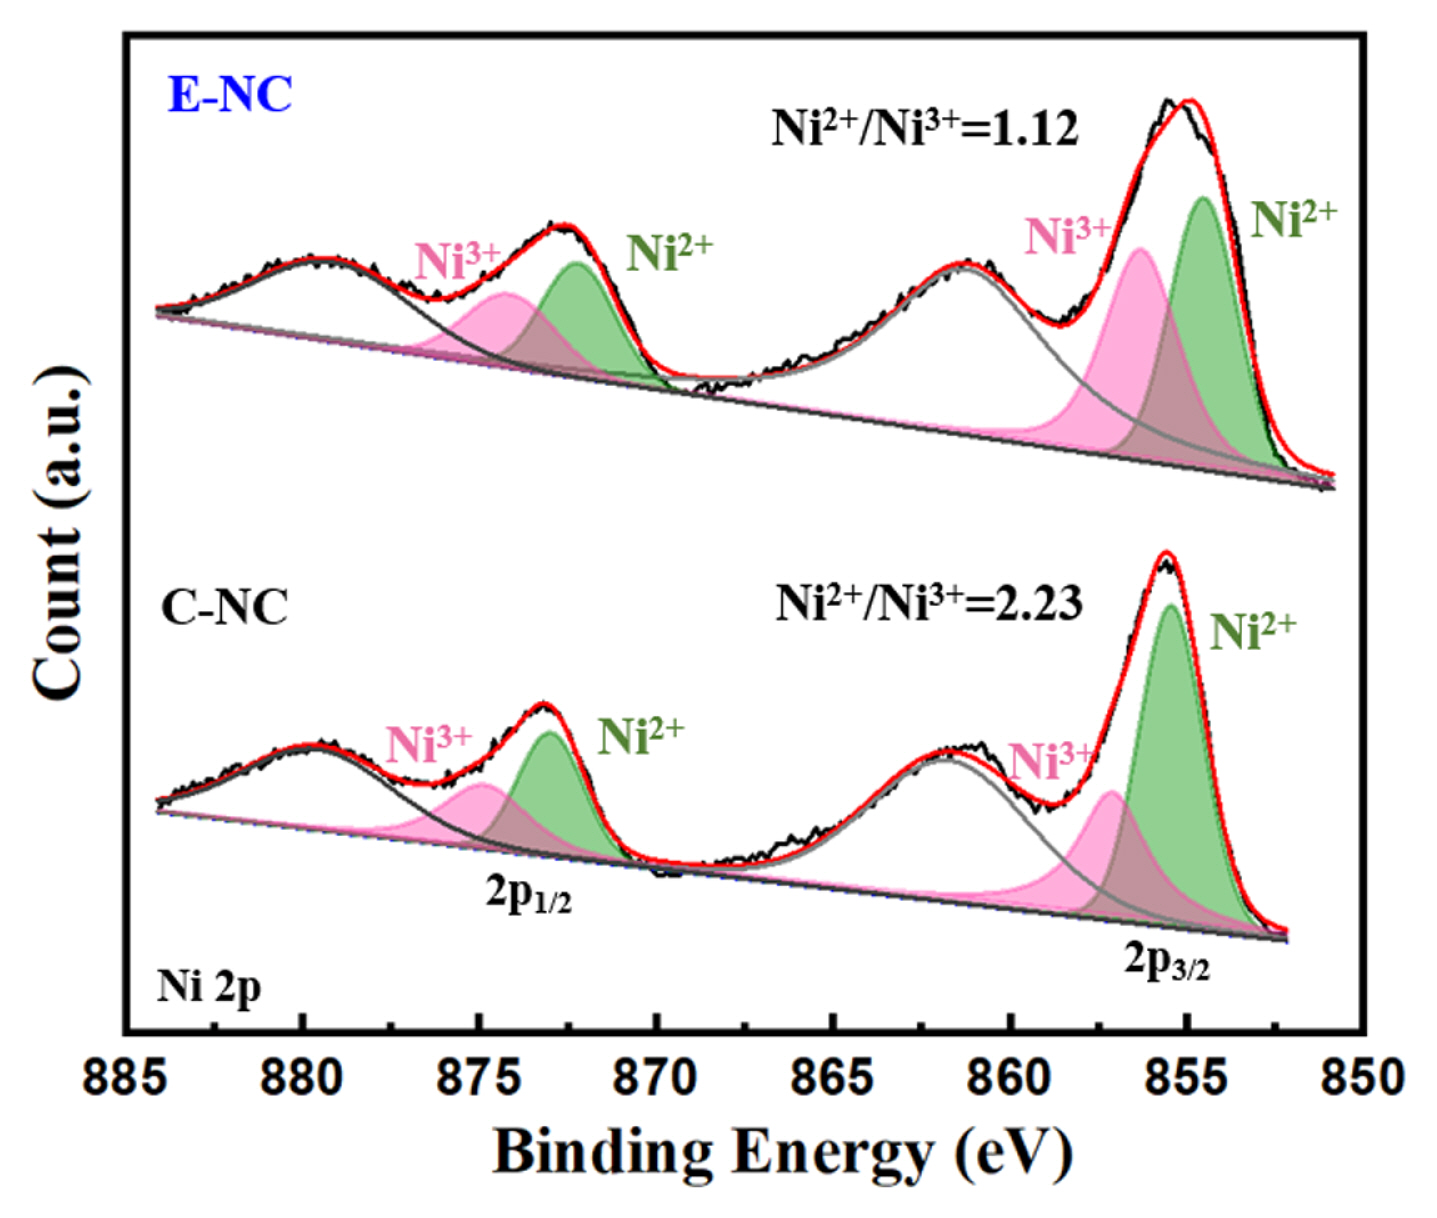
Fig. 3 shows Ni 2p XPS of E-NC and C-NC. The ratio of Ni2+/Ni3+ of E-NC is lower than that of C-NC, suggesting that lower proportion of Ni2+. The lower Ni2+ leads with the lower Li+ and Ni2+ mixing, which is aligned well with the XRD results.
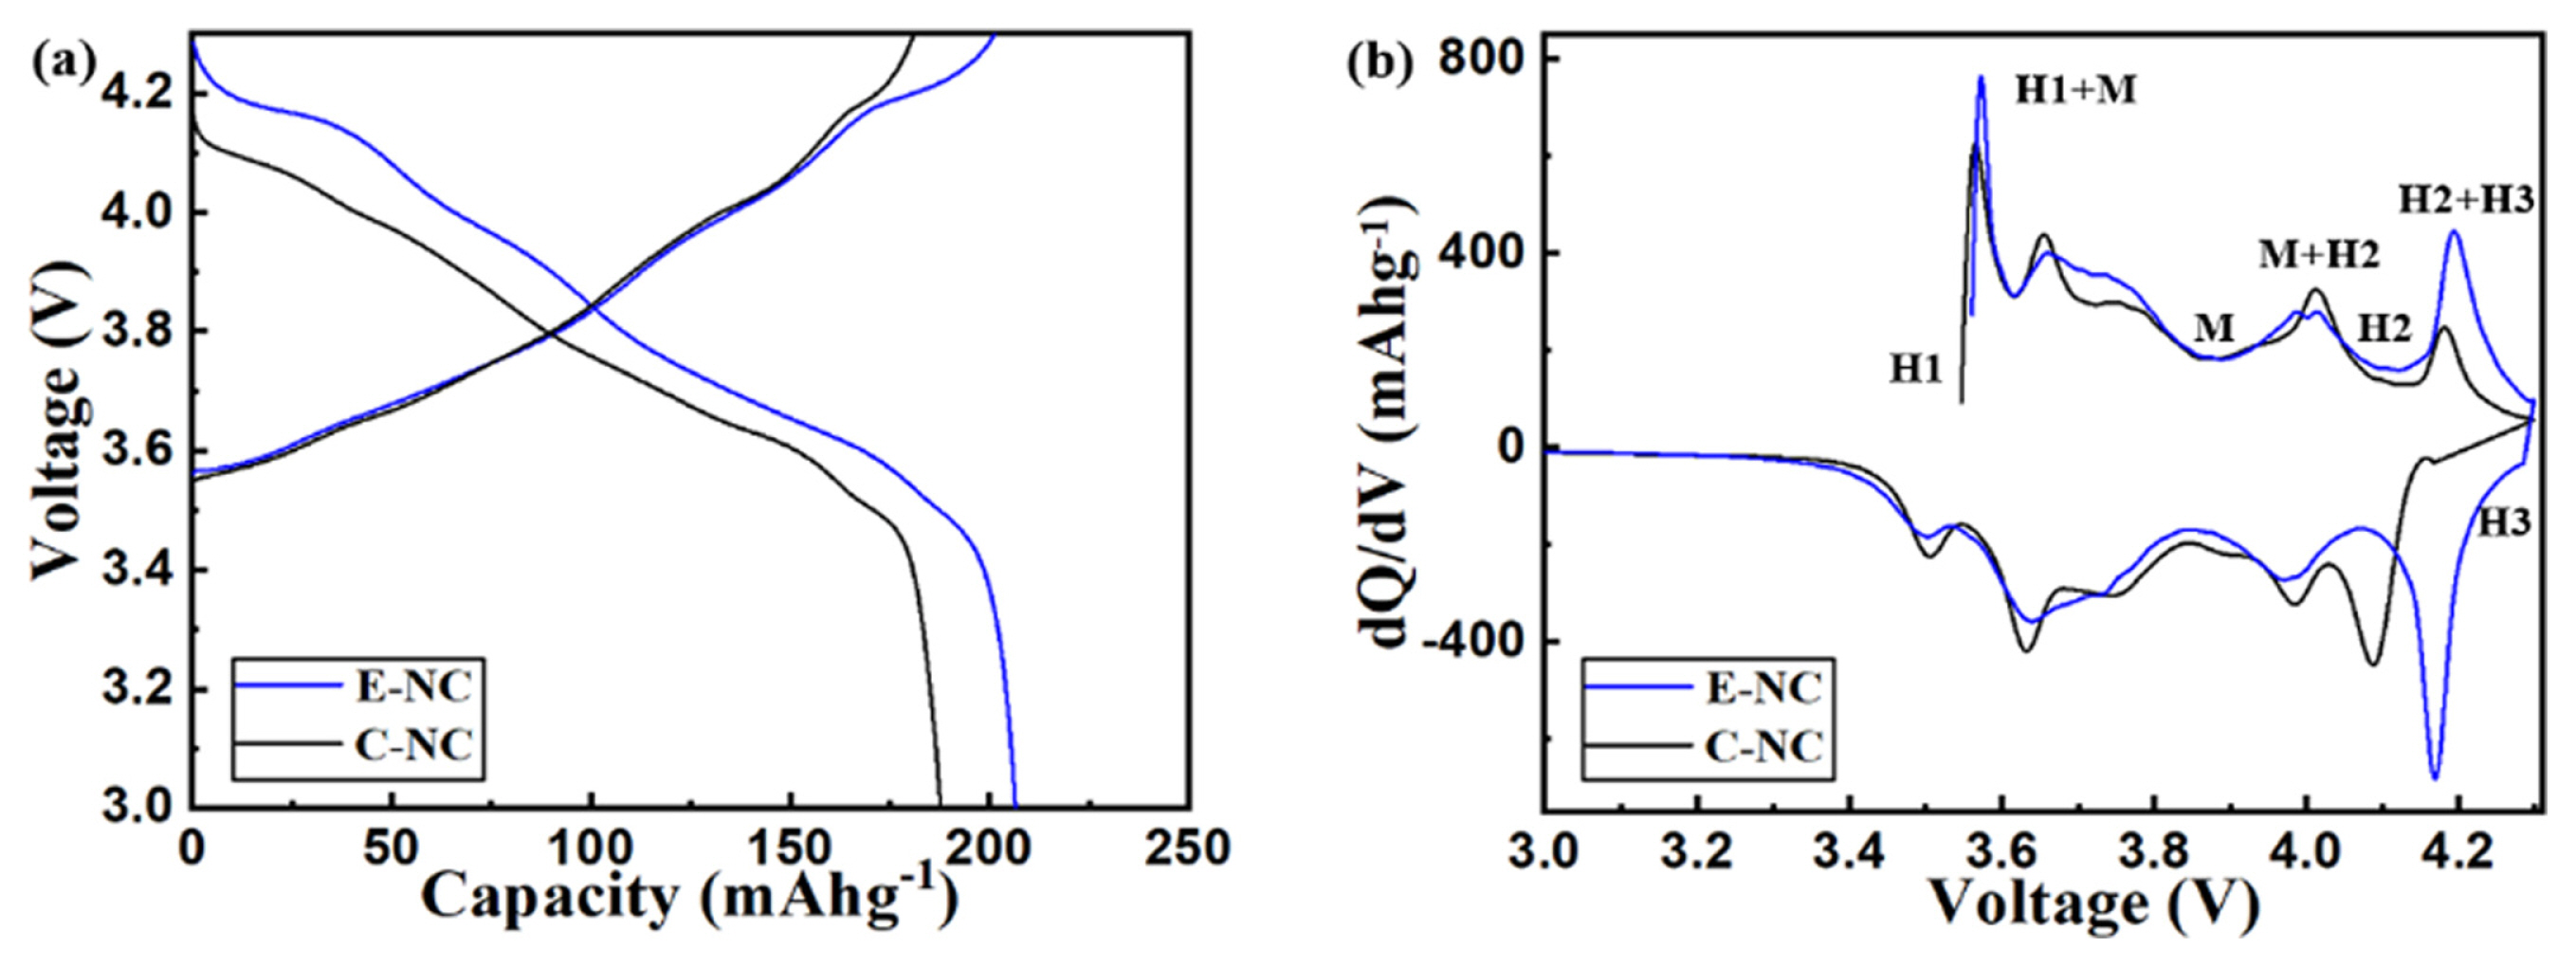
We measured the electrochemical properties using galvanostatic charge-discharge curves. Fig. 4(a) shows that the initial discharge capacity of E-NC is 206 mAh g−1 at 0.1C, which is higher than that of C-NC (189.2 mAh g−1). Fig. 4(b) shows the differential capacity (dQ/dV) measured at 0.1C. In the discharge state, the peak for E-NC shifted to a higher potential at 4.1–4.3V, this is a result of the improved electron transport by the carbon coating and shorten diffusion length of Li-ions by reducing the particle size [23].
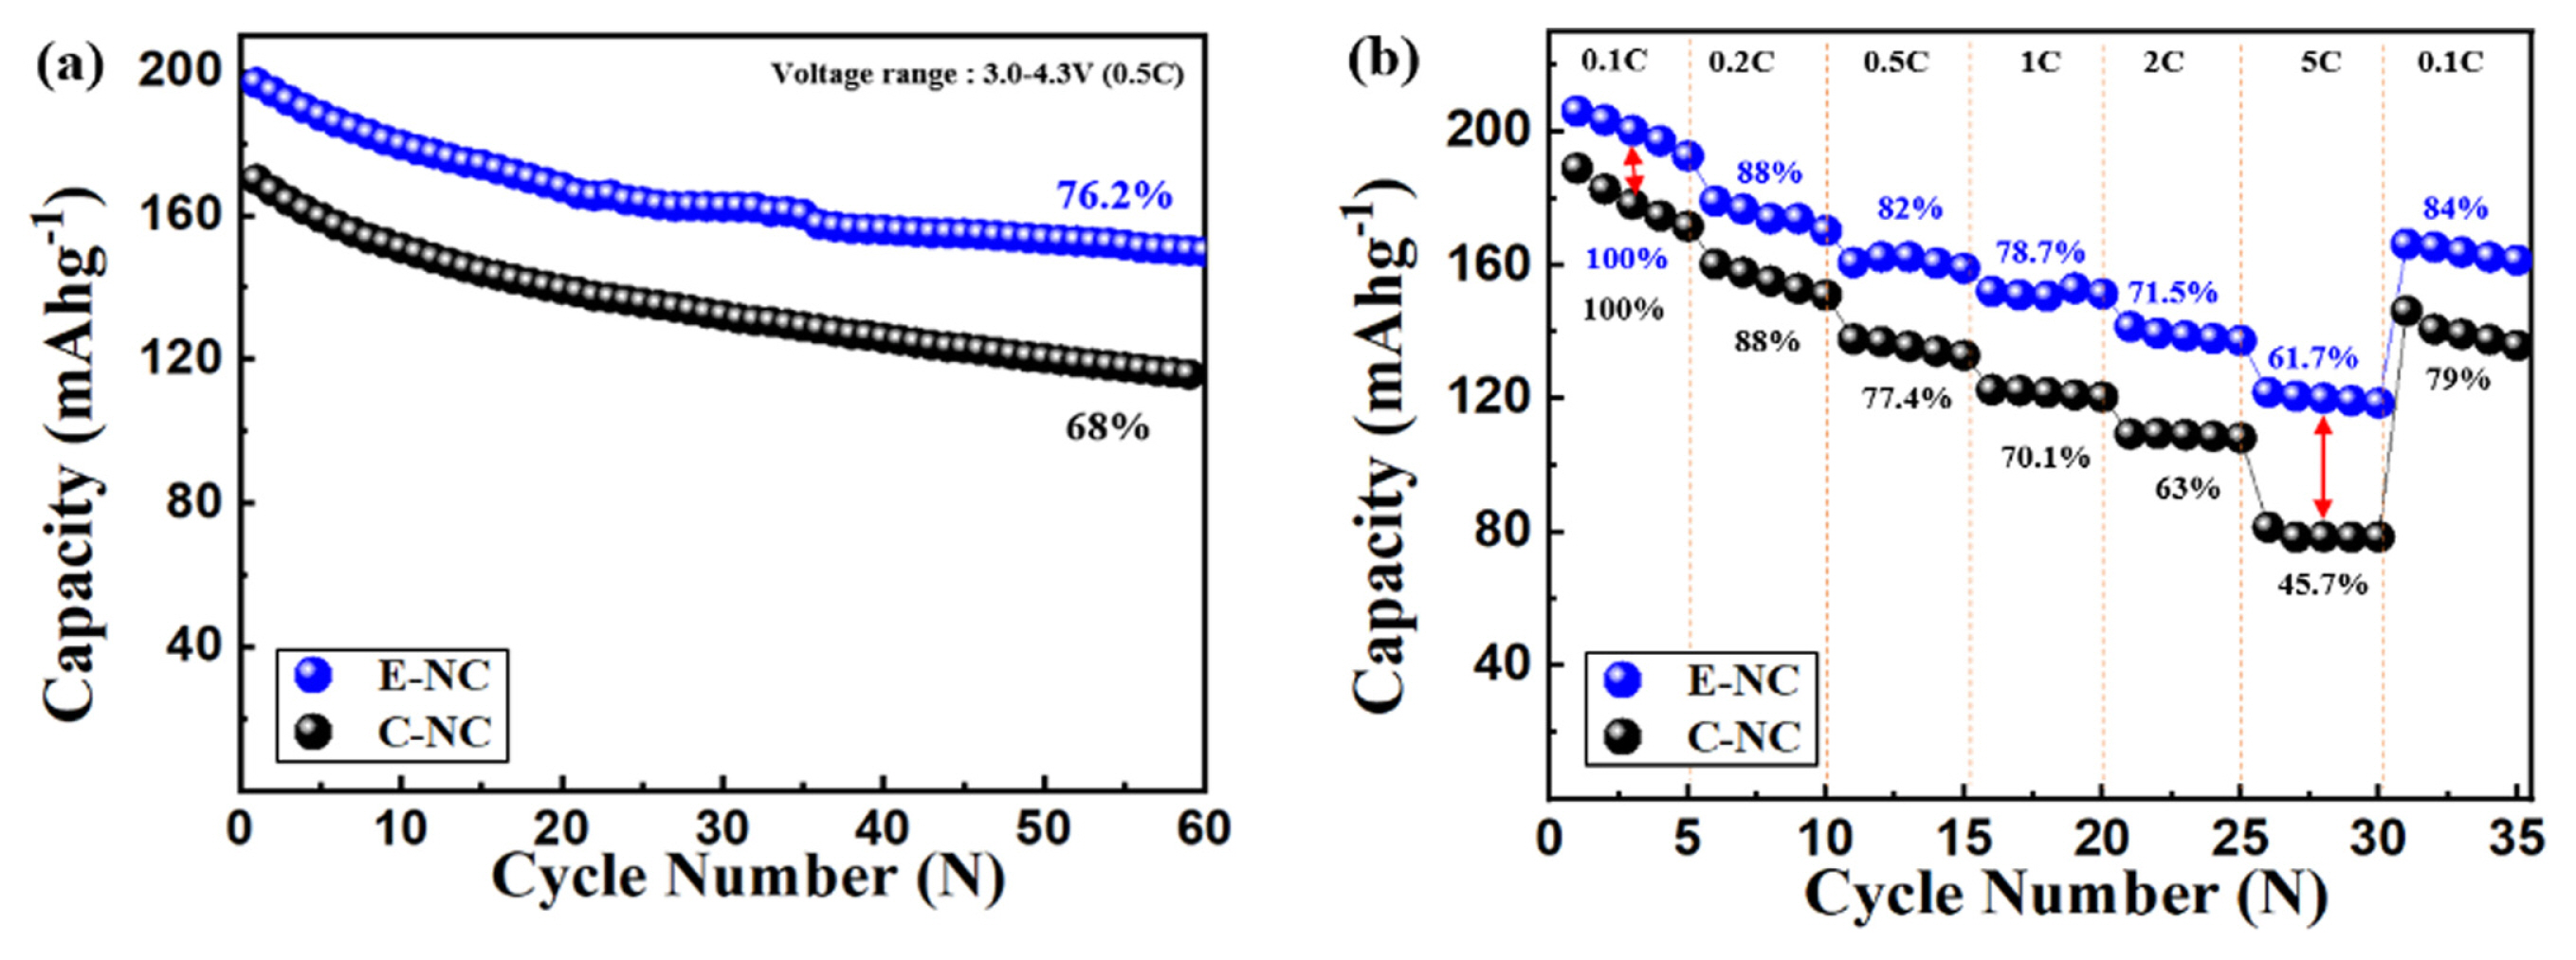
Fig. 5(a) shows the cycling performance of E-NC and C-NC. After 60 cycles at 0.5C, E-NC maintains a capacity of 152.12 mAh g−1 (76.2%), which is higher than that of C-NC (115.72 mAh g−1 = 68%). Fig. 5(b) shows the discharge capacity rate at various rates from 0.1C to 5C. As the rate increased, E-NC maintains 118.32 mAh g−1 (61.7%), whereas C-NC shows a dramatic decrease at 5C and maintains 78.22 mAh g−1 (45.7%). Because of high level cation mixing of C-NC, high-speed charge/discharge performance is deceased due to limit of the movement of Li-ions. E-NC with carbon-coated nanomaterials increases ionic conductivity, electronic conductivity, improved high-rate charge and discharge performance by increasing the surface area due to the reduced size of primary particles [24].
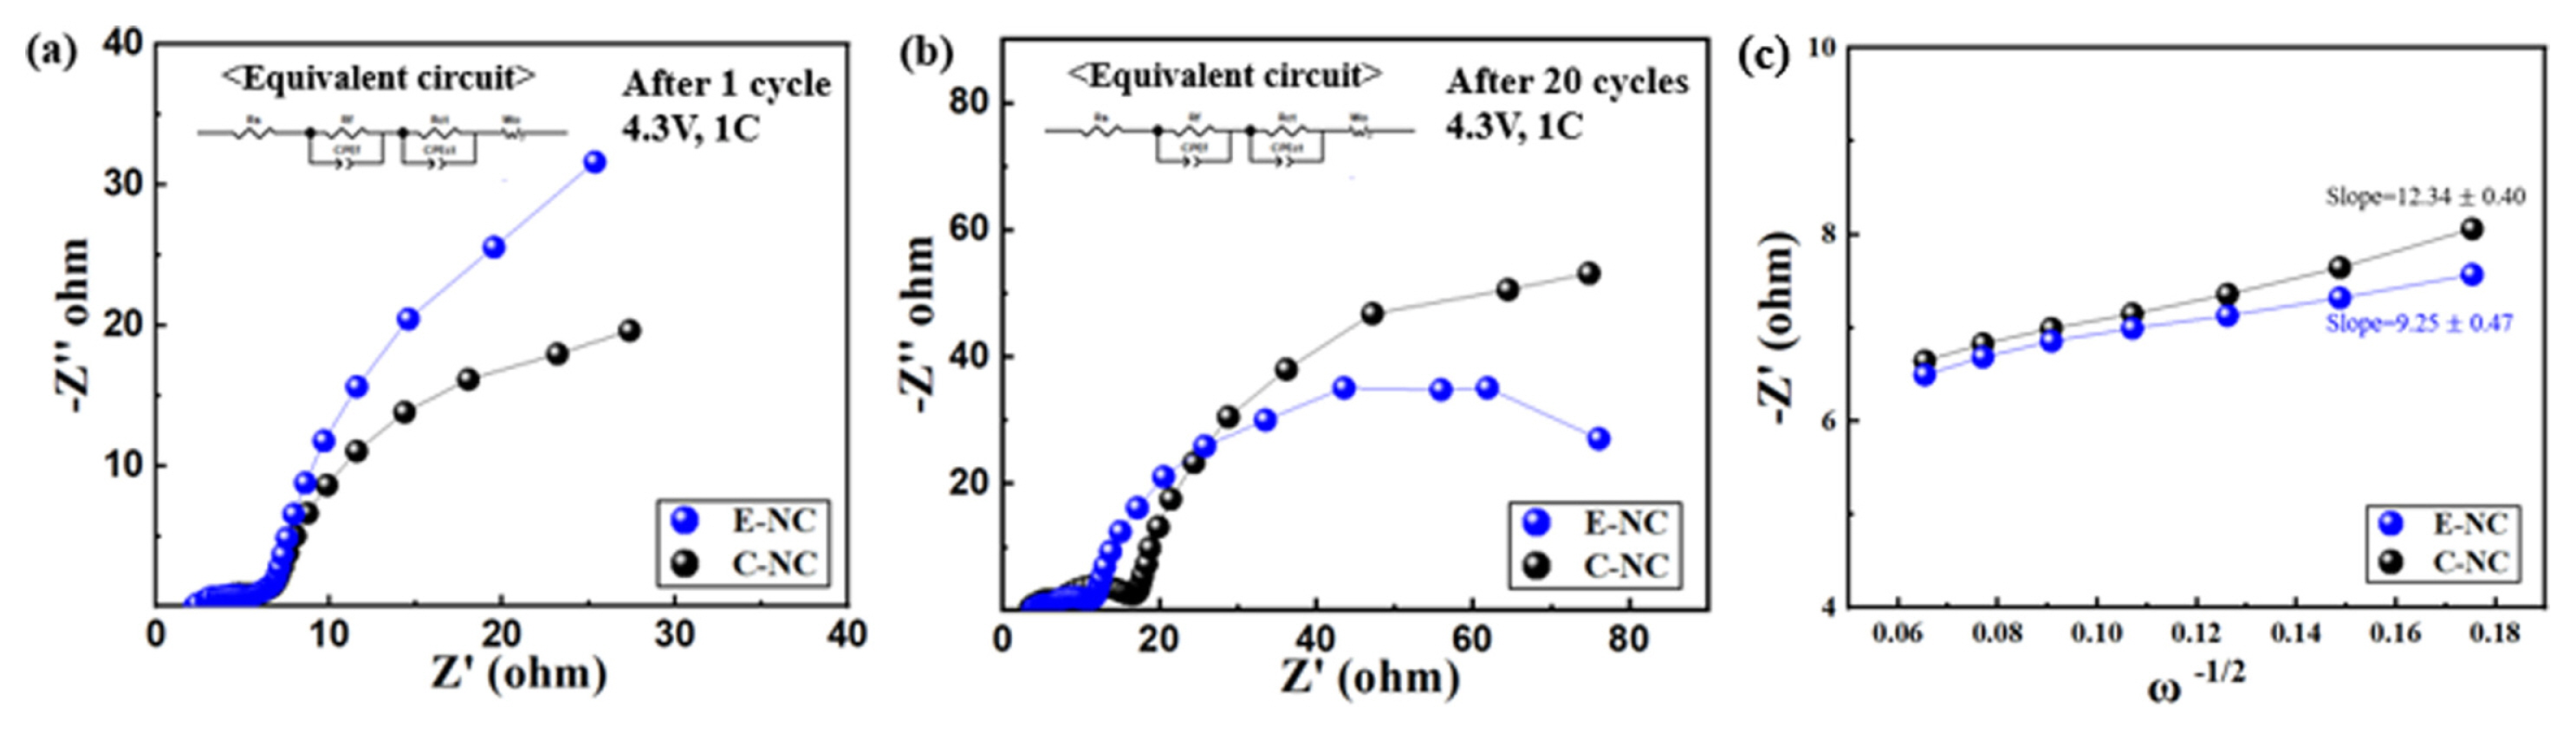
Fig. 6 shows the resistance measurements of the E-NC and C-NC samples before cycle and afer 20 cycles, measured at 4.3 V to study the surface resistance of the cell. The first semicircle represents the solid electrolyte interface resistance (Rf) and the second semicircle represents the charge-transfer resistance (Rct). A transparent semicircle is formed between Rf and Rct after 20 cycles. From Table 3, the Rf value of E-NC increases from 3.5 Ω to 7.3 Ω, and that of C-NC is from 2.6 Ω to 11 Ω, Rct value of E-NC increases from 5.12 Ω to 7.7 Ω. The change in Rf and Rct are lower than that of C-NC increased from 5.27 Ω to 11.7 Ω after 20 cycles. The porous nanofiber structure E-NC increases the surface area by reducing the particle size, which shortenes the Li-ions diffusion path. [25]. According to the relationship between Z′ and ω−1/2 as shown in Fig. 5(c), the Li-ion diffusion coefficient of E-NC and C-NC electrodes are calculated as 1.75×10⁻¹⁰ and 9.82×10⁻¹¹ cm2 s−1, respectively. The higher ions diffusion is aligned well with the better electrochemical performance. In addition, the electric conductivity is improved by the carbon coating, therefore the charge transfer resistance (Rct) is decreased, and the high-rate charge and discharge performance is improved [26].
4. Conclusions
In this study, PVP-based direct carbon-coated porous nanostructure E-NC and its properties are compared with C-NC (synthesized via co-precipitation). SEM image shows primary particle size of E-NC has a nanorod structure with a diameter range of 50–100 nm, C-NC has a spherical structure with a diameter range of 250–300 nm. XRD indicates that E-NC shows lower cation mixing than C-NC. E-NC were synthesized using the liquid mixing method to uniformly mixed atomically, C-NC is synthesized by a solid-state method by mixing LiOH · H2O based on lithium diffusion, and the atomic states of lithium and nickel presumably change each other. The electrochemical results shows that E-NC had an initial discharge capacity 206 mAh g−1 at 0.1C (17 mA g−1), which is an improvement of 10% compared to that of C-NC. At a high-rate of 850 mA g−1, E-NC maintained 118.32 mAh g−1 (61.7%) compared to that of C-NC (78.22 mAh g−1 (45.7%)), the high-rate capacity was improved by more than 50%. The impedance of the samples was analyzed using EIS. After 20 cycles, at 4.3V, the charge-transfer resistance of E-NC increases from 5.12 Ω to 7.7 Ω, and that of C-NC increases from 5.27 Ω to 11.7 Ω, indicating a decrease in resistance of more than 35% compared with C-NC.
The results of this study can be summarized as follows: 1. Shortening the Li-ion diffusion path promoted the movement of Li-ions, 2. synthesizing by liquid mixing method reduced cation mixing, and 3. carbon coating improves electrical conductivity, resulting in excellent rate performance.
This study proposes the possibility of using nanomaterials as cathodes for applications in EVs with high-rate charge and discharge performance.