 |
 |
- Search
| J. Electrochem. Sci. Technol > Volume 12(4); 2021 > Article |
|
Abstract
The Li-rich oxides are promising cathode materials due to their high energy density. However, characteristics such as low rate capability, unstable cyclic performance, and rapid capacity fading during cycling prevent their commercialization. These characteristics are mainly attributed to the phase instability of the host structure and undesirable side reactions at the cathode/electrolyte interface. To suppress the phase transition during cycling and interfacial side reactions with the reactive electrolyte, K (potassium) doping and Nb oxide coating were simultaneously introduced to a Li-rich oxide (Li1.2Ni0.13Co0.13Mn0.54O2). The capacity and rate capability of the Li-rich oxide were significantly enhanced by K doping. Considering the X-ray diffraction (XRD) analysis, the interslab thickness of LiO2 increased and cation mixing decreased due to K doping, which facilitated Li migration during cycling and resulted in enhanced capacity and rate capability. The K-doped Li-rich oxide also exhibited considerably improved cyclic performance, probably because the large K+ ions disturb the migration of the transition metals causing the phase transition and act as a pillar stabilizing the host structure during cycling. The Nb oxide coating also considerably enhanced the capacity and rate capability of the samples, indicating that the undesirable interfacial layer formed from the side reaction was a major resistance factor that reduced the capacity of the cathode. This result confirms that the introduction of K doping and Nb oxide coating is an effective approach to enhance the electrochemical performance of Li-rich oxides.
Li-rich layered oxides, composed of an integrated structure between Li2MnO3 and LiMO2 (M=Mn, Co, Ni, Fe, etc.), have attracted considerable attention owing to their promising properties for application as cathodes in Li battery systems [1–4]. Many studies have indicated that Li-rich layered oxides have a higher energy density than any other commercial cathode material, which is very useful for Li-ion batteries that require high capacity [1–9]. However, they exhibit poor rate capability, unstable cycle life, and fast voltage decay during cycling [1–9], which is mainly attributed to the structural instability of Li-rich oxides. In particular, some of the layered host structures of Li-rich oxides changes to spinel structures during cycling, which is responsible for the capacity fading and voltage decay during cycling [10–14]. The origin of the spinel transition is attributed to the migration of transition metal ions to the Li layer [15,16]. Therefore, the suppression of the rearrangement of transition metal ions is a key factor for enhancing the structural stability of Li-rich oxides.
Doping with foreign ions into the lattice structure of cathodes could be a suitable approach for this problem, because doped foreign ions can block the rearrangement of transition metal ions [17–19]. Alkali ions such as Na (sodium) and K (potassium) have been successfully used as doping elements [18,20,21]. Na+ and K+ ions are easily exchanged with Li+ ions in the Li layer, and their larger ionic radius than that of Li+ can inhibit the migration of transition metal ions, which enhances the phase stability of the cathodes during cycling. Furthermore, the doping of large-sized ions (Na+ and K+) in the Li layer can increase the Li layer spacing (interslab thickness of LiO2), which facilitates the intercalation/deintercalation of Li ions during cycling [17,20,21].
The surface instability attributed to the undesirable reaction with the electrolyte also seriously affects the degradation of the electrochemical performance of cathode materials. The reactive electrolyte containing HF from to the decomposition of salt (LiPF6) attacks the surface of the cathode, which leads to capacity fading and reduced rate capability during cycling [22–24]. Surface coating is the most common and effective method for enhancing the surface stability between the cathode and the electrolyte. The coating layer can act as a protection layer from undesirable surface reactions and improve the electrochemical performance of the cathode [25–29].
Based on a previous work, it is clear that doping and coating can positively influence the bulk and surface properties of cathode materials. Thus, the simultaneous use of the two methods can provide optimized results. Therefore, a Li-rich oxide (Li1.2Ni0.13Co0.13Mn0.54O2) was doped with K and coated with Nb oxide (NbOx). K doping is expected to stabilize the structure of the Lirich oxide. Nb oxide is a stable material that suppresses undesirable surface reactions at the cathode/electrolyte interface [26]. Both doped and coated Lirich oxides may show enhanced intrinsic and surface stability, which contributes to the electrochemical performance of the cathode.
Pristine Li1.2Ni0.13Co0.13Mn0.54O2 and K-doped Li1.2Ni0.13Co0.13Mn0.54O2 powders were prepared using a simple combustion method [30, 31]. Manganese acetate tetrahydrate [Mn(CH3CO2)2·4H2O (Aldrich, +99%)], nickel (II) nitrate hexahydrate [Ni(NO3)2·6H2O (Aldrich, 99.99%)], cobalt (II) nitrate hexahydrate [Co(NO3)2·6H2O (Aldrich, 98%)], Li acetate dihydrate [CH3CO2Li·2H2O (Aldrich, 98%)], Li nitrate [LiNO3 (Aldrich, 99%)], and K acetate (CH3COOK (Aldrich, +99%)] were used as source materials. The source materials in stoichiometric ratios were dissolved in a solvent composed of distilled water and acetic acid to form a solution. The amount of K doping was 0.02 mol% of the pristine powder, thus the expected chemical composition of K-doped Li1.2Ni0.13Co0.13Mn0.54O2 was Li0.98K0.02[Li0.2Ni0.13Co0.13Mn0.54]O2. The solutions were continuously stirred on a hot plate at 80–90°C. As the solvent evaporated, the mixed solution turned into a viscous gel. The gel was fired at 400°C for 1 h, and a vigorous decomposition process occurred, resulting in an ash-like powder. The decomposed powder was ground and sintered in air at 500°C for 4 h and then at 900°C for 7 h. In sequence, it was quenched to room temperature.
An Nb oxide coating was introduced to the K-doped Li1.2Ni0.13Co0.13Mn0.54O2. Since it is difficult to accurately confirm the composition of the coating material, that will be called as ‘Nb oxide’ in this work. To prepare the Nb oxide coating solution, Nb pentaethoxide [Nb(OC2H5)5 (Kojundo, 99.99%)] was dissolved in a solution of ethanol, stirred in an Ar-filled glove box at 40°C for 15 min, and the K-doped Li1.2Ni0.13Co0.13Mn0.54O2 powders were added. The solvent was then evaporated at 70°C under stirring. The resulting precursor was dried under vacuum at 90°C overnight and sintered in air at 450°C for 5 h to form the Nb oxide coating layer. The amount of coating was adjusted to 0.3 and 1.0 wt.% of pristine powder.
The surface morphologies of the samples were observed using field-emission scanning electron microscopy (FE-SEM, JSM-7610F PLUS) and transmission electron microscopy (TEM, JEM-2100F, Cs corrector). X-ray diffraction (XRD) patterns of the powders were obtained using XRD (Empyrean) over a 2θ range of 10–90°. Highscore Plus software was used to refine the lattice parameters for Rietveld analysis. The K 2p and Nb 3d binding energies of the samples were analyzed by X-ray photoelectron spectroscopy (XPS, K-Alpha+). For electrochemical tests, a slurry was prepared by mixing with carbon black (Super P) and polyvinylidene fluoride (PVDF) in a weight ratio of 80 (cathode powder): 12 (Super P): 8 (PVDF). A coin-type cell (2032) composed of a cathode, a Li-metal anode, a Celgard 2400 separator, and an electrolyte (1 M LiPF6 in EC/DMC (1:1 vol%)) was used. The cells were cycled in a potential range of 2.0–4.8 V using a Won A Tech voltammetry system. Impedance measurements of the cells were performed using an electrochemical workstation (Ametek, VersaSTAT 3) by applying an alternating current voltage with an amplitude of 5 mV over a frequency range of 0.1 Hz to 100 kHz.
The morphology and surface coating layer of the samples were observed using SEM and TEM analyses. Fig. 1 shows the SEM images of the pristine Li1.2Ni0.13Co0.13Mn0.54O2, K-doped Li1.2Ni0.13Co0.13 Mn0.54O2 (Li[Li0.18K0.02Ni0.13Co0.13Mn0.54]O2), K-doped and 0.3 wt.% Nb oxide coated Li1.2Ni0.13 Co0.13Mn0.54O2, and K-doped and 1.0 wt.% Nb oxide coated Li1.2Ni0.13Co0.13Mn0.54O2 powders. For convenience, they were named as pristine, K-doped, 0.3 Nb-coated, and 1.0 Nb-coated samples, respectively. As shown in Fig. 1, the sample powders consisted of aggregated nano-sized granules. The size of the powders was several micrometers; however, they were porous and composed of weakly connected nanoparticles. This cluster-type porous shape provides a wide surface area contactable with the electrolyte, which facilitates Li movement and improves the rate capability of the cells. However, the wide surface area of the cathode also activates the undesirable reaction with the electrolyte, which may deteriorate the electrochemical performance during cycling. Considering this fact, the surface coating is expected to influence the electrochemical performance of our samples because of the interfacial stabilizing effect of the coating materials.
The surface morphology of the samples did not significantly change depending on the doping and coating treatments. Particularly, a special coating layer was not observed in the Nb oxide coated samples. Many surface-coated cathodes were covered with foreign nanoparticles composed of coating materials [32–34]. It is anticipated that the surface coating layer was not formed as particle type but as a thin and homogeneous film, thus it was difficult to distinguish in the SEM image. To observe the coating layer in detail, TEM images of the pristine and Nb coated samples were obtained. Compared with the TEM image of the pristine sample (Fig. 2a), the Nb coated samples (Fig. 2b and 2c) presented several nanometer-sized surface layers, which was expected to be the Nb oxide coating layer. This thin and homogeneous coating layer efficiently prevented direct contact between the cathode and electrolyte and protected the cathode surface from the reactive electrolyte. However, there is also a possibility that the surface layer was formed from Li residues such as Li2CO3 and LiOH, attributed to unreacted Li sources.
To verify the Nb oxide coating layer more clearly and confirm the K doping, XPS measurement was performed. Fig. 3 illustrates the XPS spectra of K 2p and Nb 3d of the pristine, K-doped, 0.3 Nb-coated, and 1.0 Nb-coated samples. As shown in XPS spectra for the pristine sample (Fig. 3a and 3b), meaningful peaks were not found in the binding energy region at 291~298 eV and 204.5~212.5 eV. However, XPS spectra for K-doped sample (Fig. 3c and 3d) presented a major peak at ~292.9 eV and a corresponding satellite peak at ~295.7, which are well assigned to K 2P3/2 and K 2P1/2, respectively. These two peaks provide direct evidence of the existence of K in the structure of the K-doped sample. The 0.3 Nb-coated samples exhibited peaks associated with K 2P3/2 and K 2P1/2, and also new peaks located at ~207.0 and ~209.9 eV (Fig. 3e and 3f). The new peaks are attributed to the binding energy of Nb 3d5/2 and Nb 3d3/2, respectively, indicating that the Nb oxide layer was formed on the surface of the 0.3 Nb-coated sample. In the XPS spectra of the 1.0 Nb-coated sample (Fig. 3g and 3h), the intensity of peaks at ~207.0 and ~209.9 eV was increased compared with those for the 0.3 Nb-coated sample. This may indicate that the surface coating layer for the 1.0 Nb-coated sample is thicker than that for the 0.3 Nb-coated sample. The intensities of the peaks for K 2P3/2 and K 2P1/2 were not significantly changed by the coating treatment.
From the TEM and XPS analyses, the K doping and Nb oxide coating were confirmed. Doping and coating may affect the crystal structure of the cathode (Li1.2Ni0.13Co0.13Mn0.54O2). To probe these effects on the structure, XRD measurements were performed. Fig. 4a shows the XRD patterns of the pristine, K-doped, 0.3 Nb-coated, and 1.0 Nb-coated samples. The diffraction peaks indicate that the samples have an isostructure with typical α-NaFeO2 (space group R−3m). The position and intensity of the diffraction peaks for the four samples were similar, indicating that the doping and coating treatments did not critically change the crystal structure of the sample. However, the doped and coated samples may have slightly different lattice parameters, unit cell volumes, and interslab thicknesses. Therefore, to characterize the crystal structure in more detail, Rietveld refinement was employed, as shown in Fig. 4b and 4c. The cell parameters derived from the Rietveld refinement and interslab thickness calculated according to reference 35 are summarized in Table 1.
The lattice parameters a and c of the pristine sample were measured as 2.8514 Å and 14.2312 Å, respectively. Although the ionic radius of K+ ions (1.38 Å) is larger than that of Li+ ions (0.76 Å), the lattice parameters of the K-doped sample were slightly reduced to 2.8513 Å (a) and 14.227Å (c). This constriction of the unit cell is attributed to the lattice distortion and strain generated in the local structure due to substitution of the K ions [21]. However, the interslab thickness of LiO2 (ILiO2) increased from 2.4396 Å to 2.5023 Å upon K doping. ILiO2 means the distance between the oxygen layer located on both sides of the original Li sites; thus, an enlarged ILiO2 can reduce the activation barrier of Li hopping, which facilitates Li migration during cycling. This is attributed to the substitution of K+ ions with smaller Li+ ions in the Li layer of the host structure. However, it is also possible that the K+ ions in the Li diffusion channel can inhibit the migration of Li+ ions during cycling. Instead, the large K+ ions can act as pillars to stabilize the layered structure of Li-rich oxide because they suppress the oxygen atom repulsion during the migration of Li+ ions. The K-doped sample also showed an increased intensity ratio between (003) and (104) peaks (I(003)/I(104)=1.3369) compared to the pristine sample (I(003)/I(104)=1.2028), which means that the K doping reduced the degree of cation mixing of the sample [36]. Some Li ions in the Li layer are replaced by Ni ions (cation mixing), which disturbs Li diffusion and deteriorates the rate capability of the cathode during the charging-discharging process. Thus, the reduced degree of cation mixing leads to the expectation that the rate capability of the sample can be improved by K doping. The Nb coating affects the lattice parameter, interslab thickness, and I(003)/I(104). Some of the Nb ions may diffuse into the structure and act as dopants and form a coating layer. However, the change in these values by coating was not significant compared with the effect of K doping, which is attributed to the fact that large Nb ions may not sufficiently diffuse into the structure during the coating process.
The electrochemical properties of the samples were measured to investigate the effects of doping and coating treatments. Fig. 5a presents initial charge-discharge curves of the samples at a rate of 20 mA·g−1 in the voltage range of 4.8–2.0 V. All profiles showed a smooth voltage slope below 4.5 V along with a plateau region in the range of ~ 4.5 V, whose shape is the typical initial voltage profile of Li-rich oxides. The sloping region below 4.5 V is ascribed to the cationic redox reaction associated with Li+ deintercalation from the host structure by oxidation of transition metal (Ni and Co) ions [6,37]. The plateau region at approximately 4.5 V is associated with the oxygen redox reaction. Early works proposed that the plateau region presents the removal of Li ions from the Li2MnO3 lattice accompanied by the irreversible generation of oxygen gas [6,37]. However, recent studies have suggested that oxygen redox reactions reversibly occur without oxygen loss or major structural changes during cycling, although a portion of oxygen at the surface irreversibly escapes from the lattice [38–40]. Thus, the cationic redox reaction, related to transition metal ions, and the oxygen redox reaction contribute to the extremely large energy density of Li-rich oxide cathodes.
Interestingly, the initial discharge capacity was distinctly increased by the K doping. The discharge capacity of the pristine sample was ~ 240 mAh·g−1, whereas that of the K-doped sample reached ~ 270 mAh·g−1. The existence of K+ ions in the original Li site increases the interslab thickness of LiO2, which can facilitate intercalation/deintercalation of Li ions during the charging and discharging processes. Therefore, the increased discharge capacity is related to the enlarged interslab thickness of LiO2 owing to the effect of K doping. The discharge capacities of the 0.3 Nb-coated and 1.0 Nb-coated samples increased to ~292 and ~294 mAh·g−1, respectively, which means that the introduction of the Nb oxide coating is considerably effective in improving the discharge capacity. This result indicates that the undesirable interfacial layer formed from side reactions between the cathode and electrolyte acts as a strong resistance factor. Therefore, the surface coating with Nb oxide suppressing the side reactions significantly influences the discharge capacity of the samples. The surface coating effect can be more prominent in our samples because the powders prepared by the simple combustion method have a small size and porous structure, which provides a wide interfacial region in contact with the reactive electrolyte.
The discharge capacities of the samples at various current densities (20, 40, 100, 200, and 600 mA·g−1) were observed to compare the rate capability of the samples, as shown in Fig. 5b. The discharge capacities and capacity retentions of the samples are summarized in Table 2. Capacity retention is the percentage of the retained capacity at each current density compared to that at 20 mA·g−1. As the current density increased, the discharge capacity of all the samples decreased. The values of the pristine sample at ~100, ~200, and ~600 mA·g−1 were ~ 157, ~124, and ~69 mAh·g−1, respectively (the values are the 13th, 18th, and 23rd cycles in Fig. 5, respectively). The capacity retentions were ~67% (at 100 mA·g−1), ~53% (at 200 mA·g−1), and ~30% (at 600 mA·g−1). The discharge capacities of the K-doped sample were higher than those of the pristine sample at all current densities. Moreover, the capacity retentions of the K-doped sample were ~77% (at 100 mA·g−1), ~67% (at 200 mA·g−1), and ~42% (at 600 mA·g−1), which are superior to those of the pristine sample, showing an enhanced rate capability by K doping. This is attributed to the enlarged interslab thickness of LiO2 and reduced cation mixing. It is possible that the large K+ ions in the Li sites can disturb the migration of Li+ ions during cycling; however, its influence seems to be lower than the positive effect of K doping.
The 0.3 Nb-coated sample also showed a significantly enhanced rate capability compared to the pristine sample. The capacity retention reached ~77% (at 100 mA·g−1), ~68 (at 200 mA·g−1), and ~51% (at 600 mA·g−1). In particular, the capacity retention at 600 mA·g−1 was superior to that of the K-doped sample, which is related to the surface protection effect suppressing the undesirable side reactions at the cathode/electrolyte interface. However, the retained capacity of the 1.0 Nb-coated sample was lower than that of the 0.3 Nb-coated sample. The Nb oxide layer may act as a new resistance factor when the thickness of the coating layer exceeds a certain value. The 1.0 wt.% of Nb oxide coating seems to be excessively thick for smooth movement of Li ions and electrons at the surface of cathodes.
The cyclic properties of the samples are shown in Fig 6. The cells containing the samples were cycled at 20 mA·g−1 for the initial three cycles, and tested at 100 mA·g−1 for 50 cycles. An initial low current density may induce sufficient initial irreversible reactions, which activate the oxygen redox reaction. At 100 mA·g−1, capacity retention until 50th cycle compared to 4th cycle was ~69% (pristine sample), ~89% (K-doped sample), ~87% (0.3 Nb-coated sample), and ~ 81% (1.0 Nb-coated sample). The K-doped samples clearly showed a considerably improved cyclic performance. Fig. 7 presents the 4th, 15th, and 50th charge-discharge curves of the samples in Fig. 6. The curves for samples containing K doping (K-doped and Nb-coated samples) showed relatively low capacity fading during cycling, as shown in Fig. 7b–d, compared to that of the pristine sample (Fig. 7a). Considering that the capacity fading of Li-rich oxides is mainly attributed to structural transformation from a layered structure to a spinel variant [10–14], it is clear that K doping efficiently alleviated the occurrence of the spinel structure. The existence of K+ ions in the Li layer disturbs the migration of transition metals, which can reduce the phase transition during cycling. Furthermore, large K+ ions acting as pillars increase the stability of the layered structure and suppress the collapse of the lattice structure of the Li-rich oxide. These effects may improve the cycling performance of K-doped samples.
To further investigate the influence of K doping and Nb coating, the impedance of the cells containing the samples was measured. Fig. 8 shows the Nyquist curves of the pristine, K-doped, 0.3 Nb-coated, and 1.0 Nb-coated samples before the electrochemical test, after 1 and 50 cycles. The curves are composed of a semicircle in the high-frequency range and a line in the low-frequency range. The size of the semicircle represents the impedance value of the charge transfer and solid electrolyte interface [25,41]. As shown in Fig. 8a, the semicircles of the cells were similar, regardless of the samples they contained. However, after 1 and 50 cycles (Fig. 8b and 8c, respectively), the K-doped samples presented a considerably smaller semicircle compared to that of the pristine sample. This means that the impedance value of the cells was significantly decreased by the K doping. The enlarged interslab thickness of LiO2 and reduced cation mixing may reduce the impedance of the cell after cycling. The 0.3 wt.% Nb oxide coating further decreased the impedance value of the cells, which is attributed to the stabilized interface between cathode and electrolyte by coating. Although the 1.0 Nb-coated sample showed a slightly higher impedance value than the 0.3 Nb-coated sample, it was still smaller than the impedance value for the pristine sample. This reduced impedance value explains the higher capacity and improved rate capability of the K doping and Nb oxide coating. It is clear that the simultaneous introduction of two methods is an effective approach to obtain enhanced electrochemical properties of Li-rich oxide owing to the synergistic effect of coating and doping.
K doping and Nb oxide coating were simultaneously applied to a Li-rich oxide (Li1.2Ni0.13Co0.13Mn0.54O2) to improve bulk and surface properties. The coating layer formed a thin, homogeneous film-type shape on the surface of the porous powder. Large K+ ions substituted smaller Li+ ions in the Li layer and enlarged the interslab thickness of LiO2, which facilitated Li migration during cycling. Cation mixing, which disturbs Li diffusion, was also reduced by K doping. Owing to these effects, the discharge capacity and rate capability of the Li-rich oxide were improved by K doping. Moreover, the cyclic performance was distinctly enhanced because large K+ ions in the Li layer disturb the migration of transition metals, which reduces the phase transition during cycling. The K+ ions are also expected to act as pillars that stabilize the host structure of the Li-rich oxide.
The Nb oxide coating further increased the capacity of the K-doped sample. The sample prepared by the simple combustion method has a wide interfacial region between the cathode and electrolyte, thus undesirable interfacial side reactions seem to critically influence. Therefore, the suppression of side reactions by the Nb oxide coating significantly improved the discharge capacity of the sample. Owing to the synergistic effect of the K doping and Nb oxide coating, the 0.3 wt.% Nb-coated K-doped sample exhibited the best capacity, rate capability, and cyclic performance in our work. Impedance analysis also confirmed that K doping and Nb oxide coating are effective approaches for reducing the impedance value during cycling, which can explain the enhanced capacity and rate capability by doping and coating.
Acknowledgment
This work was supported by the National Research Foundation of Korea(NRF) grant funded by the Korean government (MSIT) (No. 2020R1A2C1008370) and supported by the Technology Innovation Program (20007034) funded by the Ministry of Trade, Industry & Energy (MOTIE, Korea). This work was also supported by Kyonggi University’s Graduate Research Assistantship 2020.
Fig. 1
SEM images of Li1.2Ni0.13Co0.13Mn0.54O2 (Li-rich oxide) powders. (a) Pristine, (b) K-doped, (c) 0.3 Nb-coated, and (d) 1.0 Nb-coated samples.
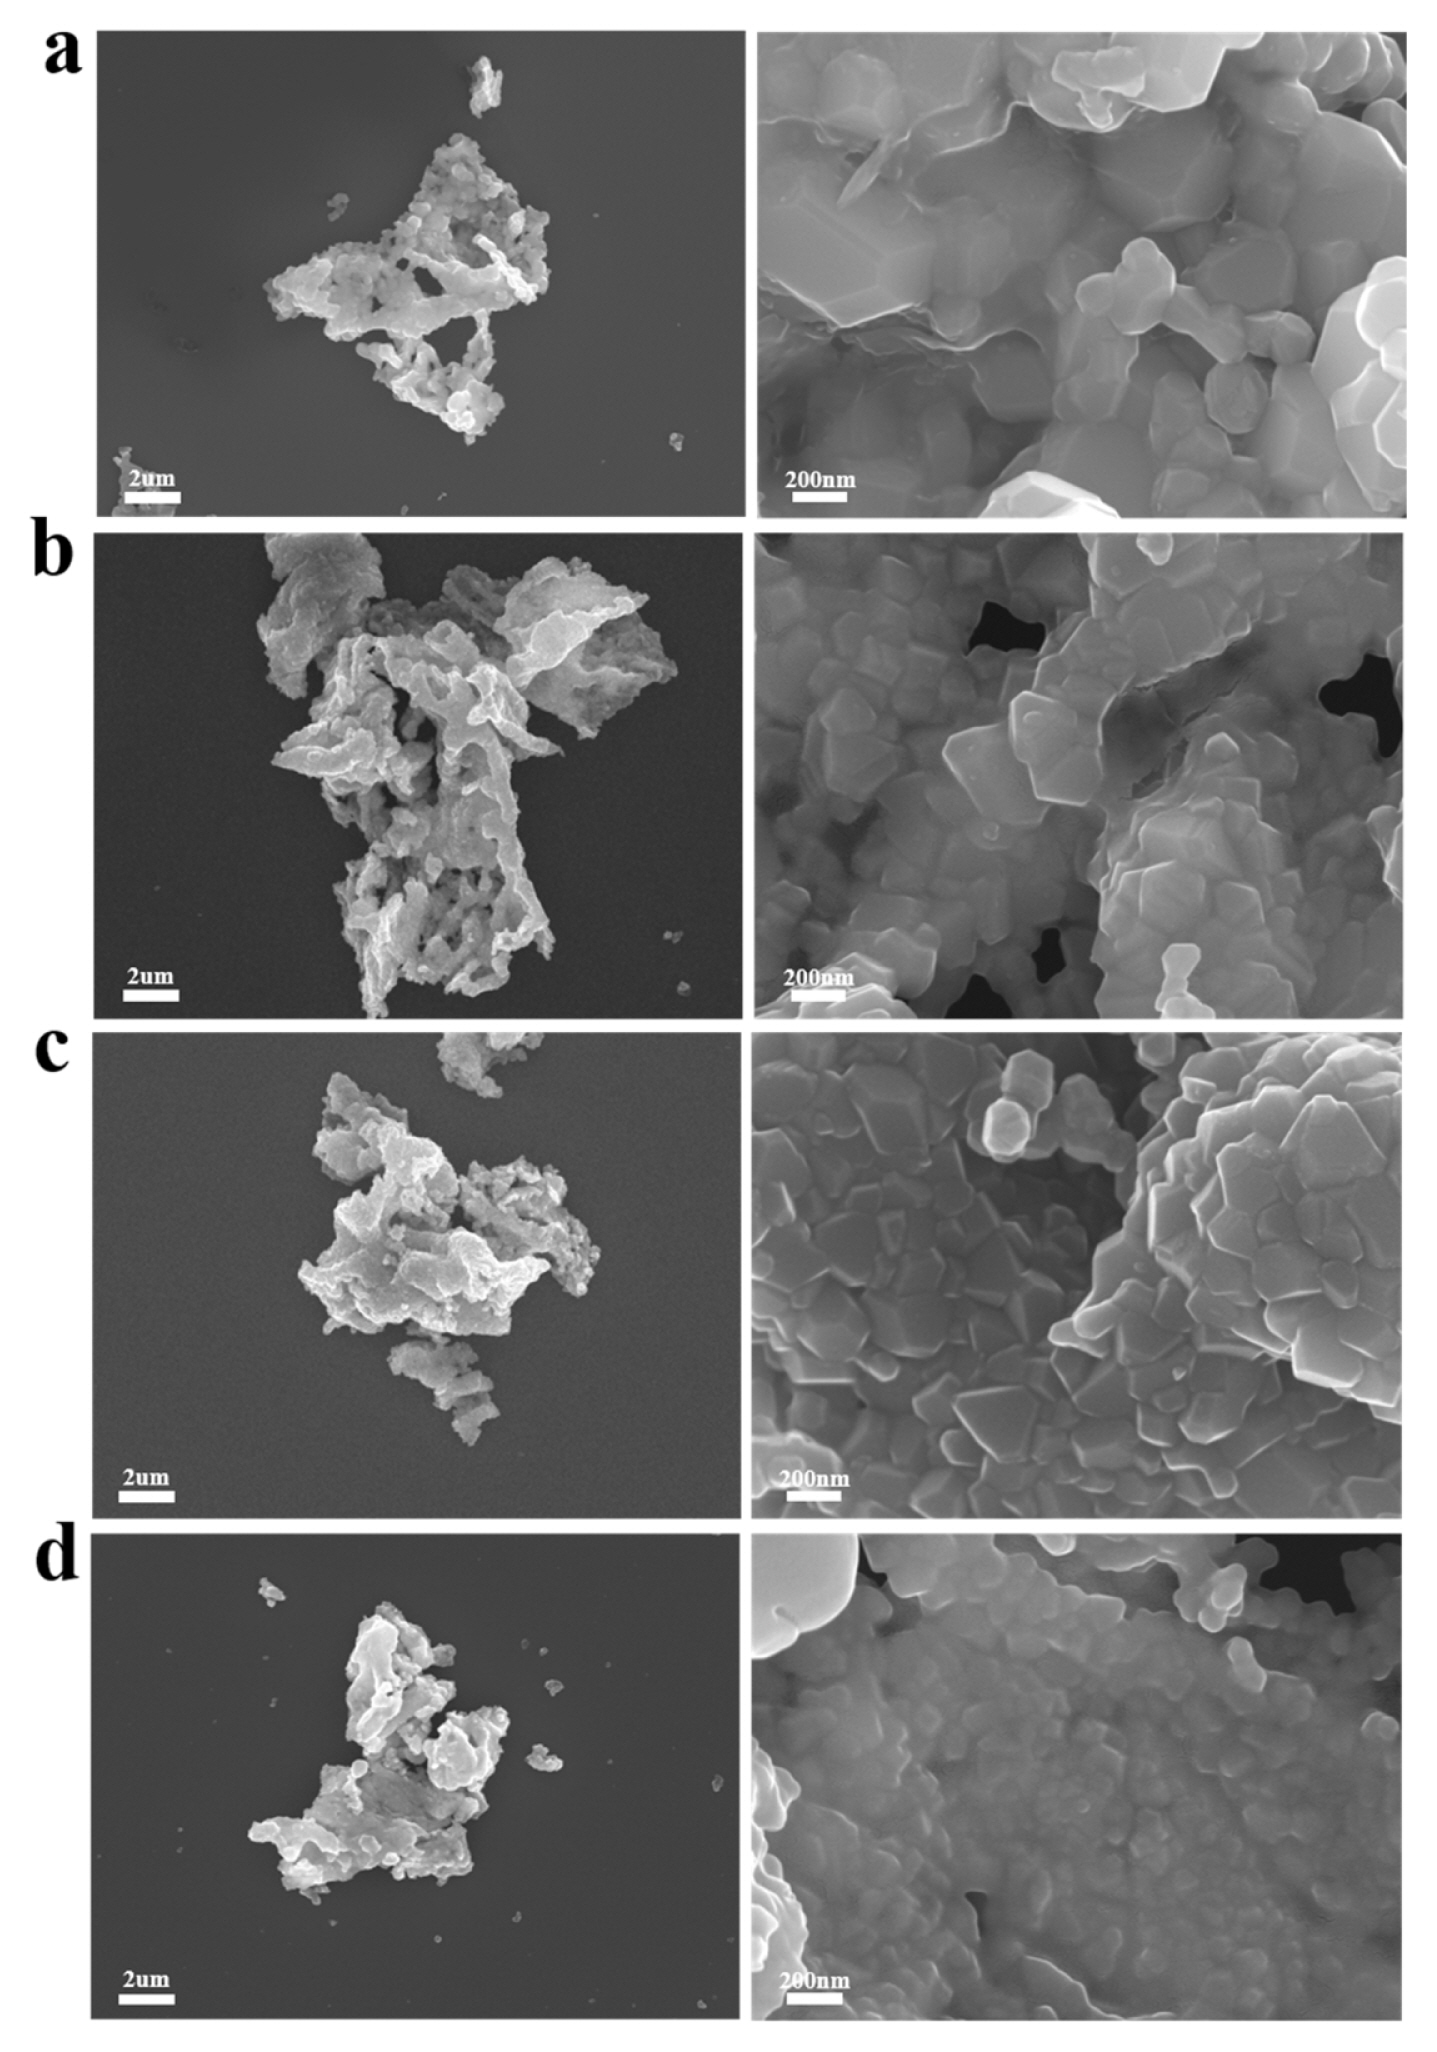
Fig. 2
TEM images of Li1.2Ni0.13Co0.13Mn0.54O2 (Li-rich oxide) powders. (a) Pristine, (b) 0.3 Nb-coated, and (c) 1.0 Nb-coated samples.

Fig. 3
XPS spectra of Li1.2Ni0.13Co0.13Mn0.54O2 (Li-rich oxide) powders. (a) K 2p and (b) Nb 3d for pristine sample, (c) K 2p and (d) Nb 3d for K-doped sample, (e) K 2p and (f) Nb 3d for 0.3-Nb coated sample, (g) K 2p and (h) Nb 3d for 1.0 Nb-coated sample.
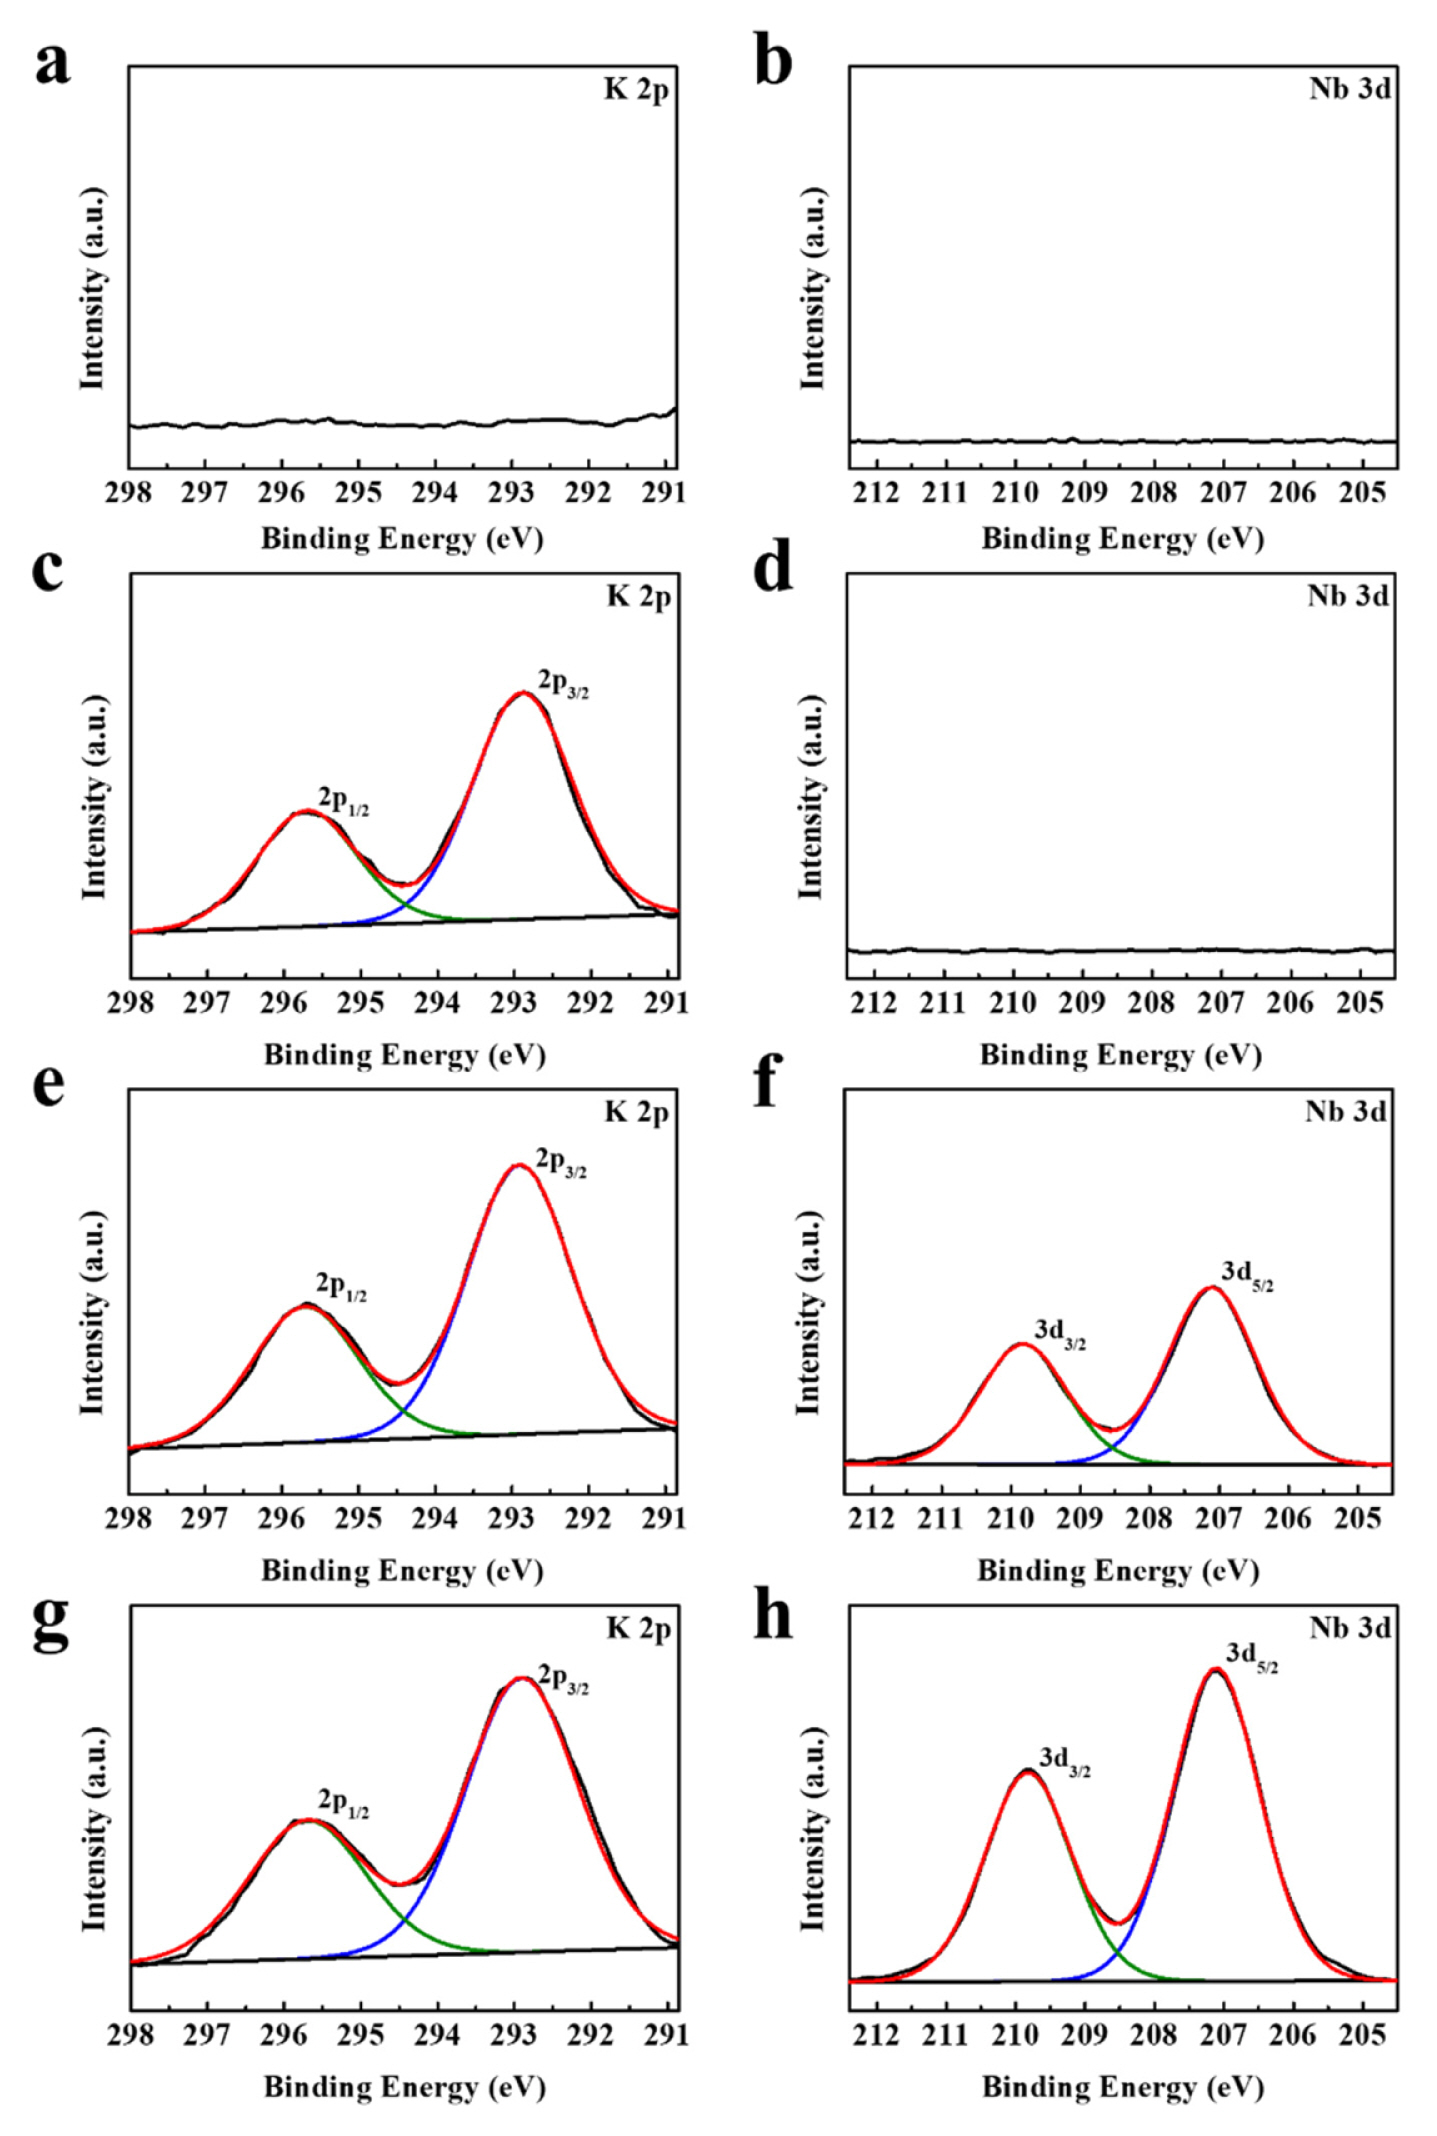
Fig. 4
(a) XRD patterns of Li1.2Ni0.13Co0.13Mn0.54O2 (Li-rich oxide) powders, Rietveld refinement of (b) pristine sample and (c) 0.3 Nb-coated sample.
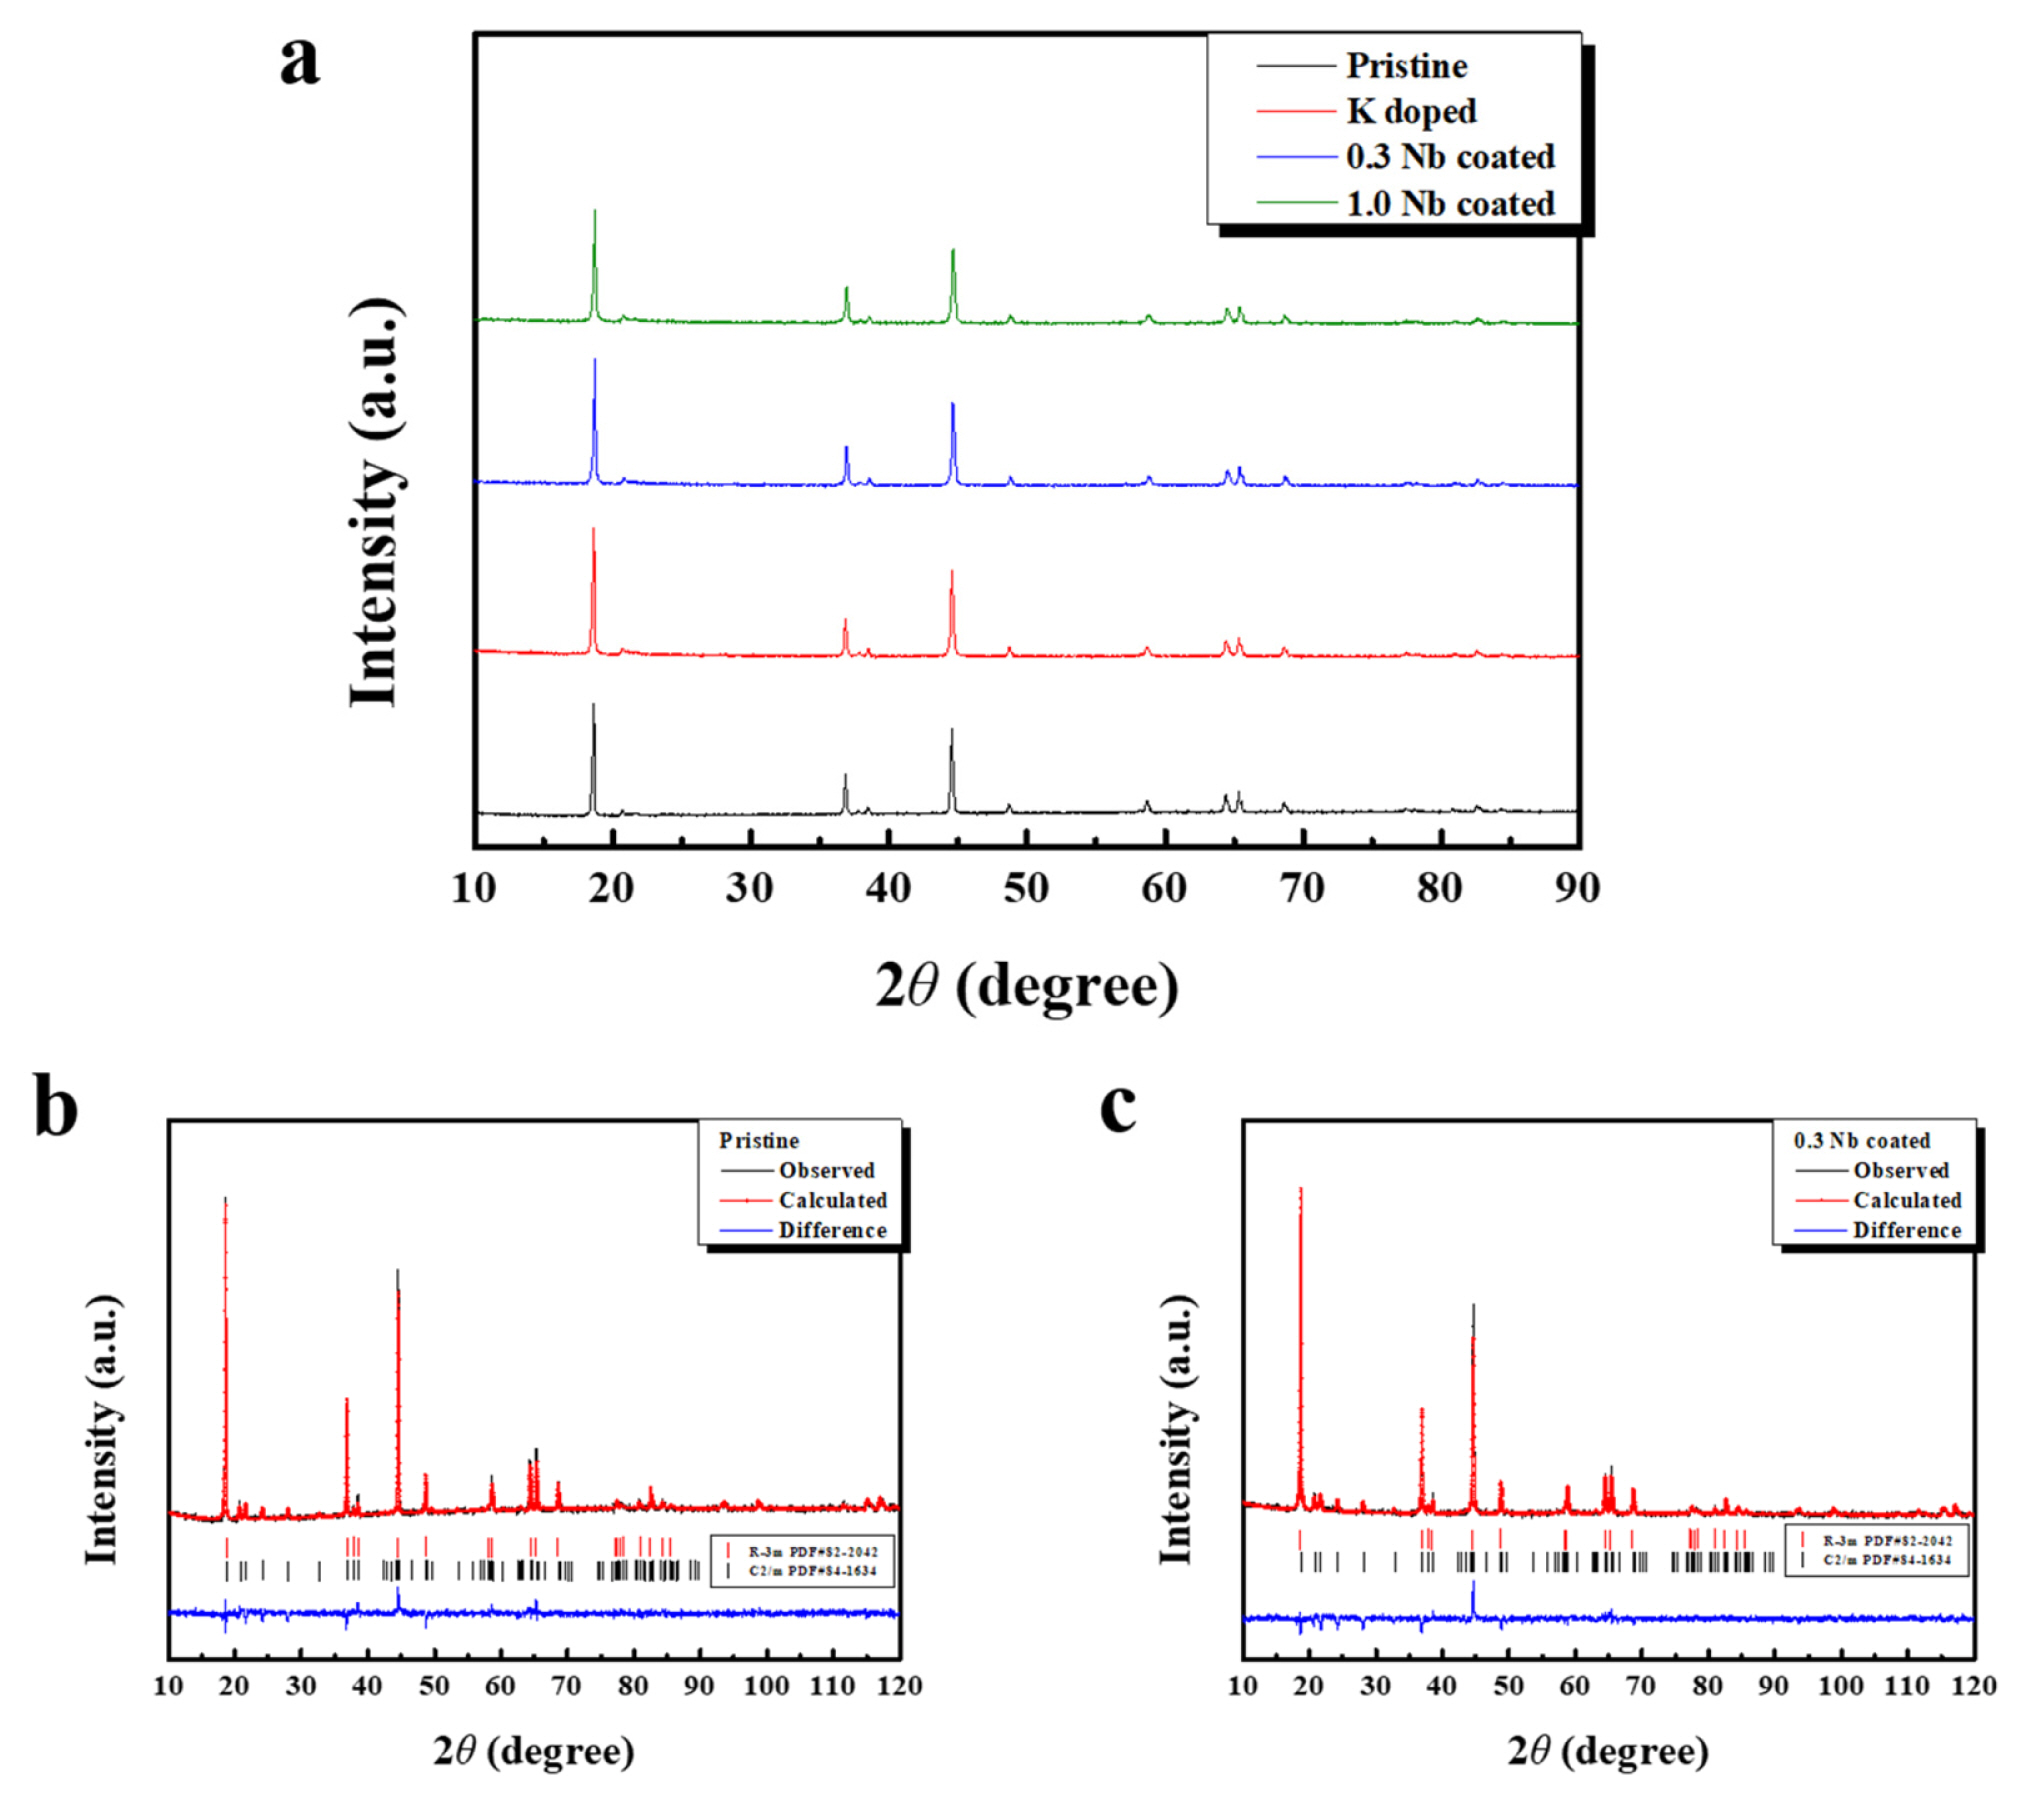
Fig. 5
Electrochemical performance of pristine, K-doped, 0.3 Nb-coated, and 1.0 Nb-coated samples. (a) Initial charge-discharge curves of samples at 20 mA·g−1. (b) Discharge capacities of samples at 20, 40, 100, 200, 600 mA·g−1.
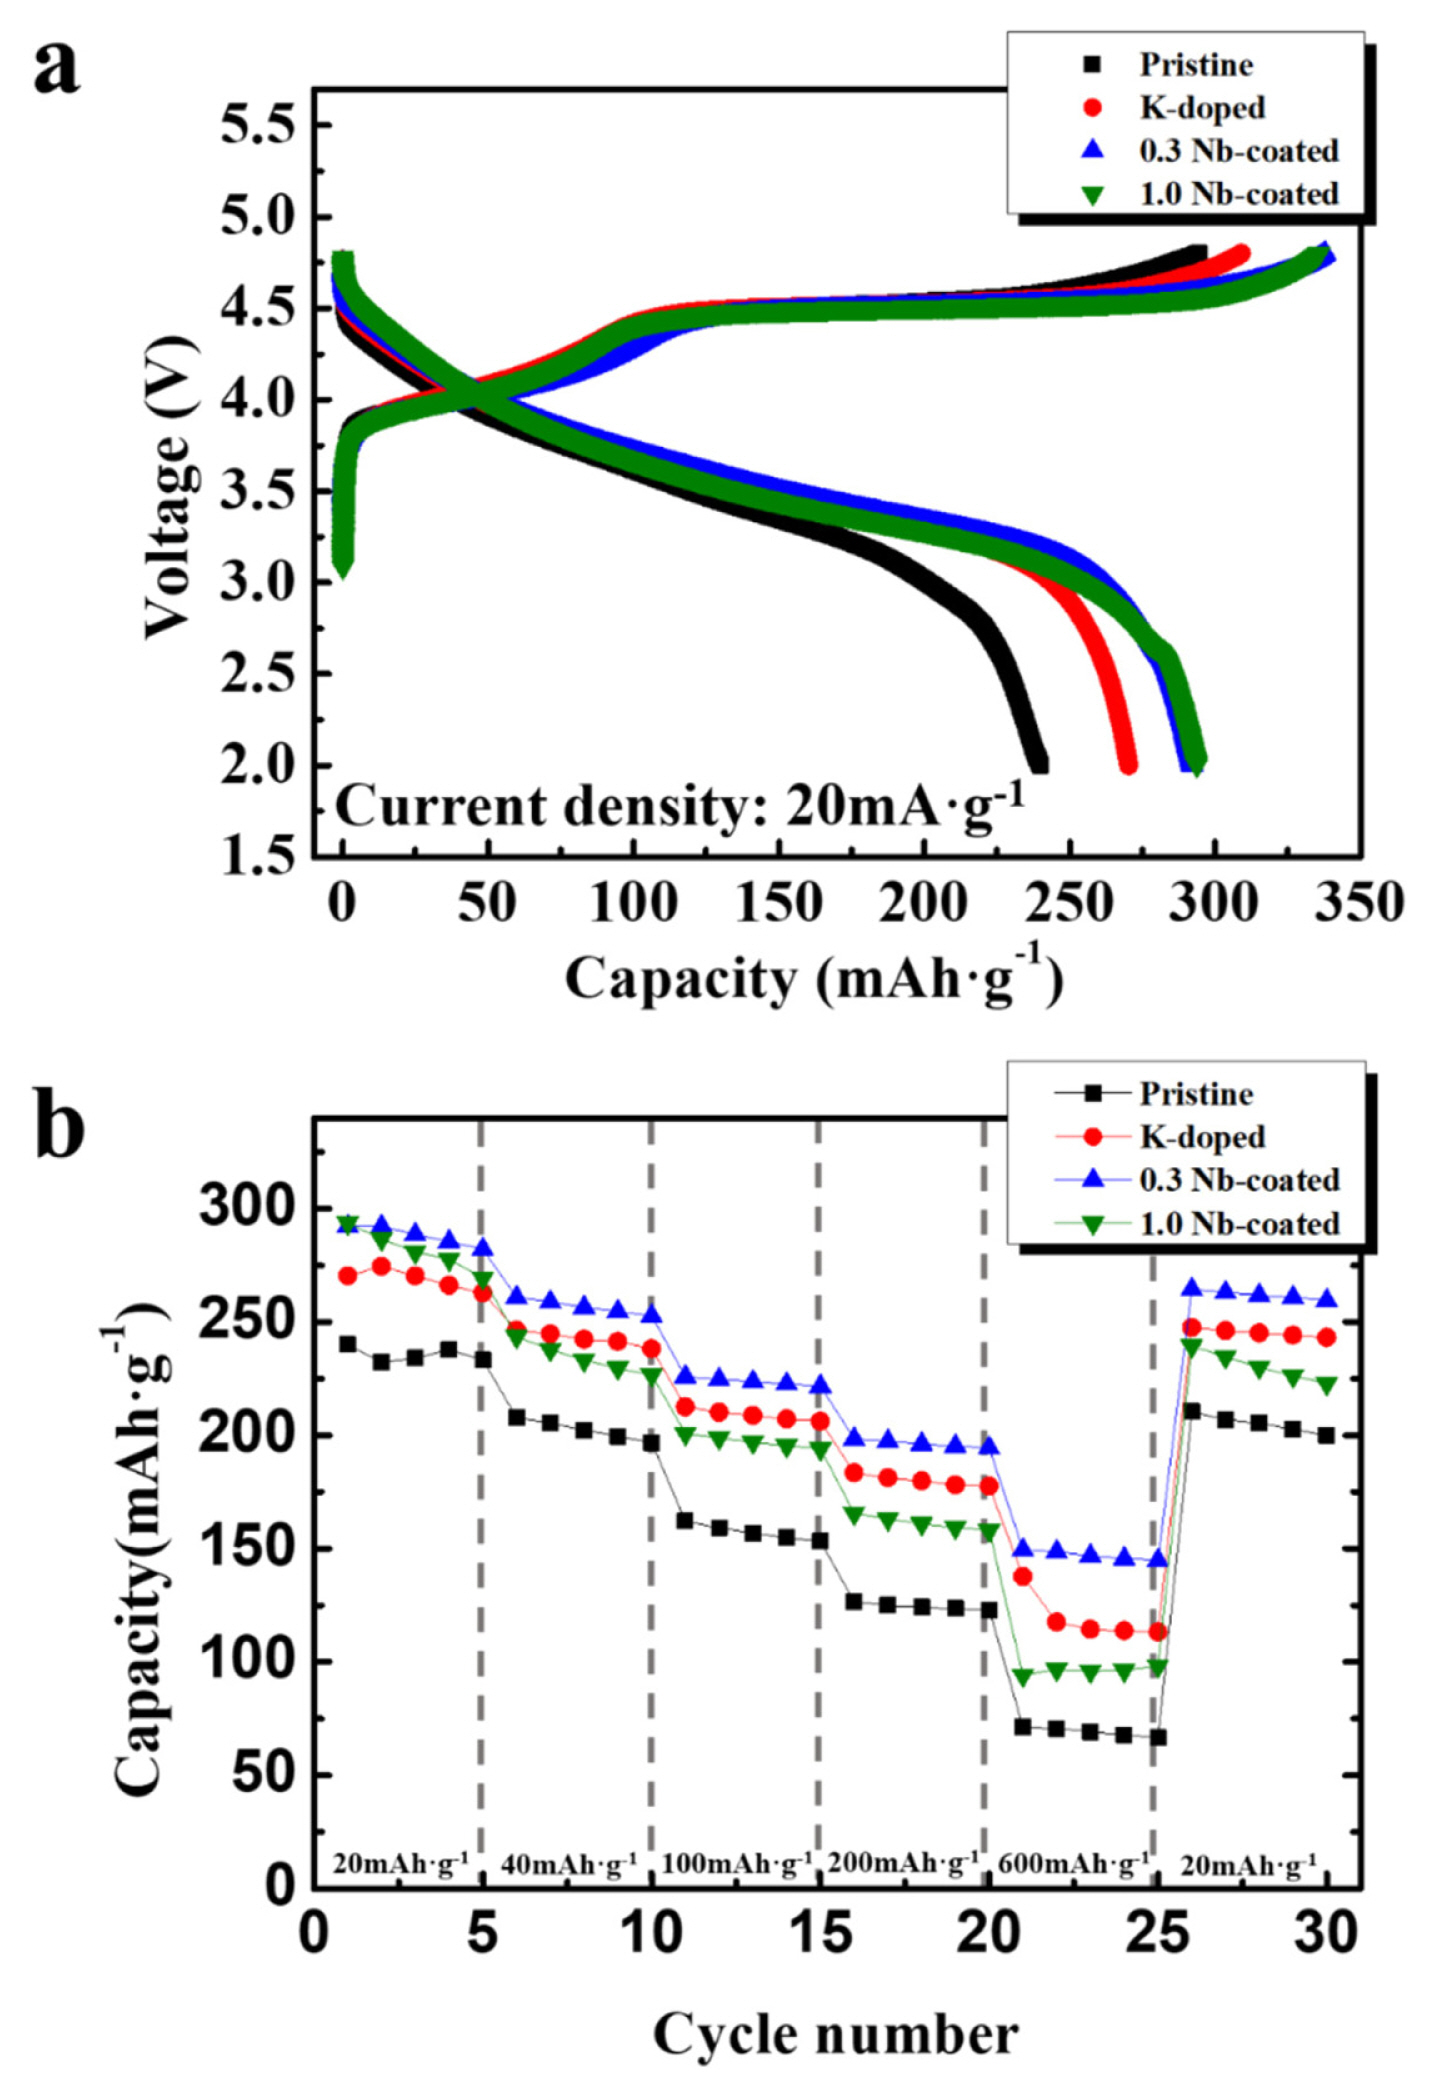
Fig. 6
Cyclic performance of pristine, K-doped, 0.3 Nb-coated, and 1.0 Nb-coated samples (cells cycled at 20 mA·g−1 for initial three cycles, and tested at 100 mA·g−1 until 50 cycles).

Fig. 7
4th, 15th, and 50th charge–discharge curves of the samples measured at 100 mA·g−1. (a) Pristine, (b) K-doped, (c) 0.3 Nb-coated, and (d) 1.0 Nb-coated samples.
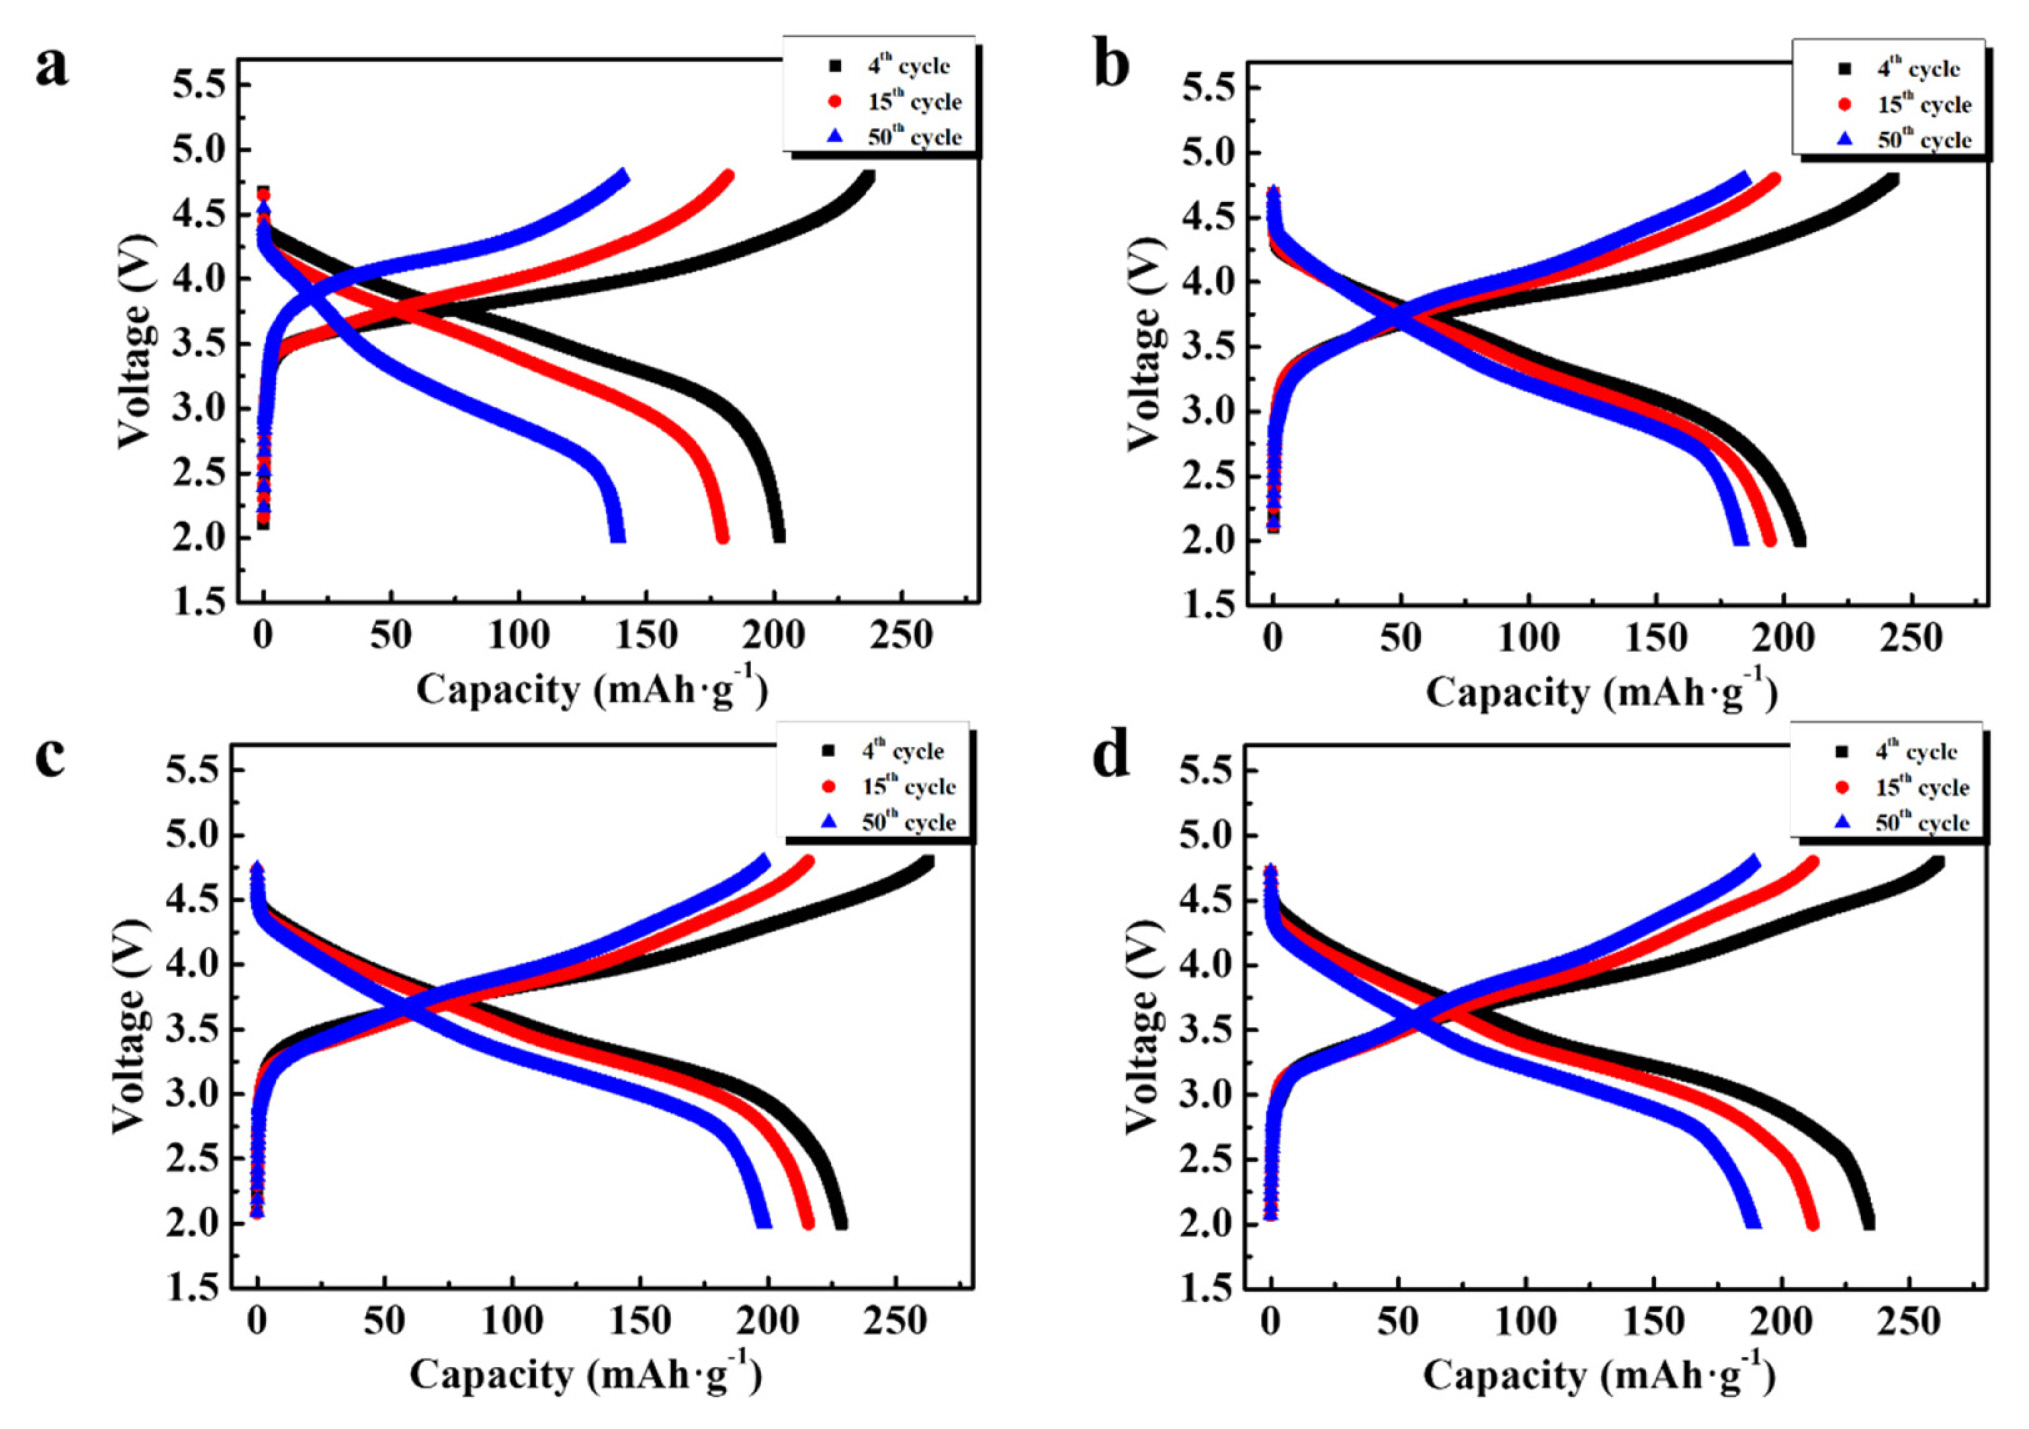
Fig. 8
Nyquist plots of pristine, K-doped, 0.3 Nb-coated, and 1.0 Nb-coated samples: (a) before electrochemical test, (b) after 1 cycle, and (c) after 50 cycles.

Table 1
Crystal structural parameters and interslab thickness of pristine, K-doped, 0.3 Nb-coated, and 1.0 Nb-coated samples.
Table 2
Discharge capacity and capacity retention of pristine, K-doped, 0.3 Nb-coated, and 1.0 Nb-coated samples (capacity retention refers to the percentage of the retained capacity at each current density compared to that at 20 mA·g−1).
References
[1] MM. Thackeray, SH. Kang, CS. Johnson, JT. Vaughey, R. Benedek and SA. Hackney, J Mater Chem, 2007, 17(30), 3112–3125.

[2] KA. Jarvis, Z. Deng, LF. Allard, A. Manthiram and PJ. Ferreira, Chem Mater, 2011, 23(16), 3614–3621.

[3] H. Koga, L. Croguennec, M. Ménétrier, P. Mannessiez, F. Weill and C. Delmas, J Power Sources, 2013, 236, 250–258.

[4] F. Fu, Y-P. Deng, C-H. Shen, G-L. Xu, X-X. Peng, Q. Wang, Y-F. Xu, J-C. Fang, L. Huang and S-G. Sun, Electrochem commun, 2014, 44, 54–58.

[6] D. Luo, G. Li, X. Guan, C. Yu, J. Zheng, X. Zhang and L. Li, J Mater Chem A, 2013, 1(4), 1220–1227.

[7] B. Song, H. Liu, Z. Liu, P. Xiao, MO. Lai and L. Lu, Sci Rep, 2013, 3(1), 1–12.
[8] SJ. Shi, JP. Tu, YY. Tang, YX. Yu, YQ. Zhang, XL. Wang and CD. Gu, J Power Sources, 2013, 228, 14–23.

[9] H. Lee, SB. Lim, JY. Kim, M. Jeong, YJ. Park and WS. Yoon, ACS Appl Mater Interfaces, 2018, 10(13), 10804–10818.

[11] M. Gu, A. Genc, I. Belharouak, D. Wang, K. Amine, S. Thevuthasan, DR. Baer, J-G. Zhang, ND. Browning, J. Liu and C. Wang, Chem Mater, 2013, 25(11), 2319–2326.

[12] AR. Armstrong, M. Holzapfel, P. Novak, CS. Johnson, SH. Kang, MM. Thackeray and PG. Bruce, J Am Chem Soc, 2006, 128(26), 8694–8698.

[14] D. Mohanty, AS. Sefat, S. Kalnaus, J. Li, RA. Meisner, EA. Payzant, DP. Abraham, DL. Wood and C. Daniel, J Mater Chem A, 2013, 1(20), 6249–6261.

[18] MN. Ates, Q. Jia, A. Shah, A. Busnaina, S. Mukerjee and KM. Abraham, J Electrochem Soc, 2014, 161(3), A290.

[19] J-H. Park, J. Lim, J. Yoon, K-S. Park, J. Gim, J. Song, H. Park, D. Im, M. Park, D. Ahn, Y. Paik and J. Kim, Dalt Trans, 2012, 41(10), 3053–3059.

[20] Z. Zheng, XD. Guo, YJ. Zhong, WB. Hua, CH. Shen, SL. Chou and XS. Yang, Electrochim Acta, 2016, 188, 336–343.

[21] Q. Li, G. Li, C. Fu, D. Luo, J. Fan and L. Li, ACS Appl Mater Interfaces, 2014, 6(13), 10330–10341.

[23] BG. Lee and YJ. Park, Sci Rep, 2020, 10(1), 1–11.
[24] X. Wang, Z. Hu, A. Adeosun, B. Liu, R. Ruan, S. Li and H. Tan, J Energy Inst, 2018, 91(6), 835–844.

[26] F. Xin, H. Zhou, X. Chen, M. Zuba, N. Chernova, G. Zhou and MS. Whittingham, ACS Appl Mater Interfaces, 2019, 11(38), 34889–34894.

[27] Y. Seok Jung, AS. Cavanagh, Y. Yan, SM. George and A. Manthiram, J Electrochem Soc, 2011, 158(12), A1298-.
[28] YK. Sun, MJ. Lee, CS. Yoon, J. Hassoun, K. Amine and B. Scrosati, Adv Mater, 2012, 24(9), 1192–1196.

[32] HW. Kwak and YJ. Park, Sci Rep, 2019, 9(1), 1–9.
[36] CB. Lim and YJ. Park, Sci Rep, 2020, 10(1), 1–12.
[39] K. Luo, MR. Roberts, R. Hao, N. Guerrini, DM. pickup, YS. Liu, K. Edstrom, J. Guo, AV. Chadwick, LC. Duda and PG. Bruce, Nat Chem, 2016, 8(7), 684–691.


