


1. Introduction
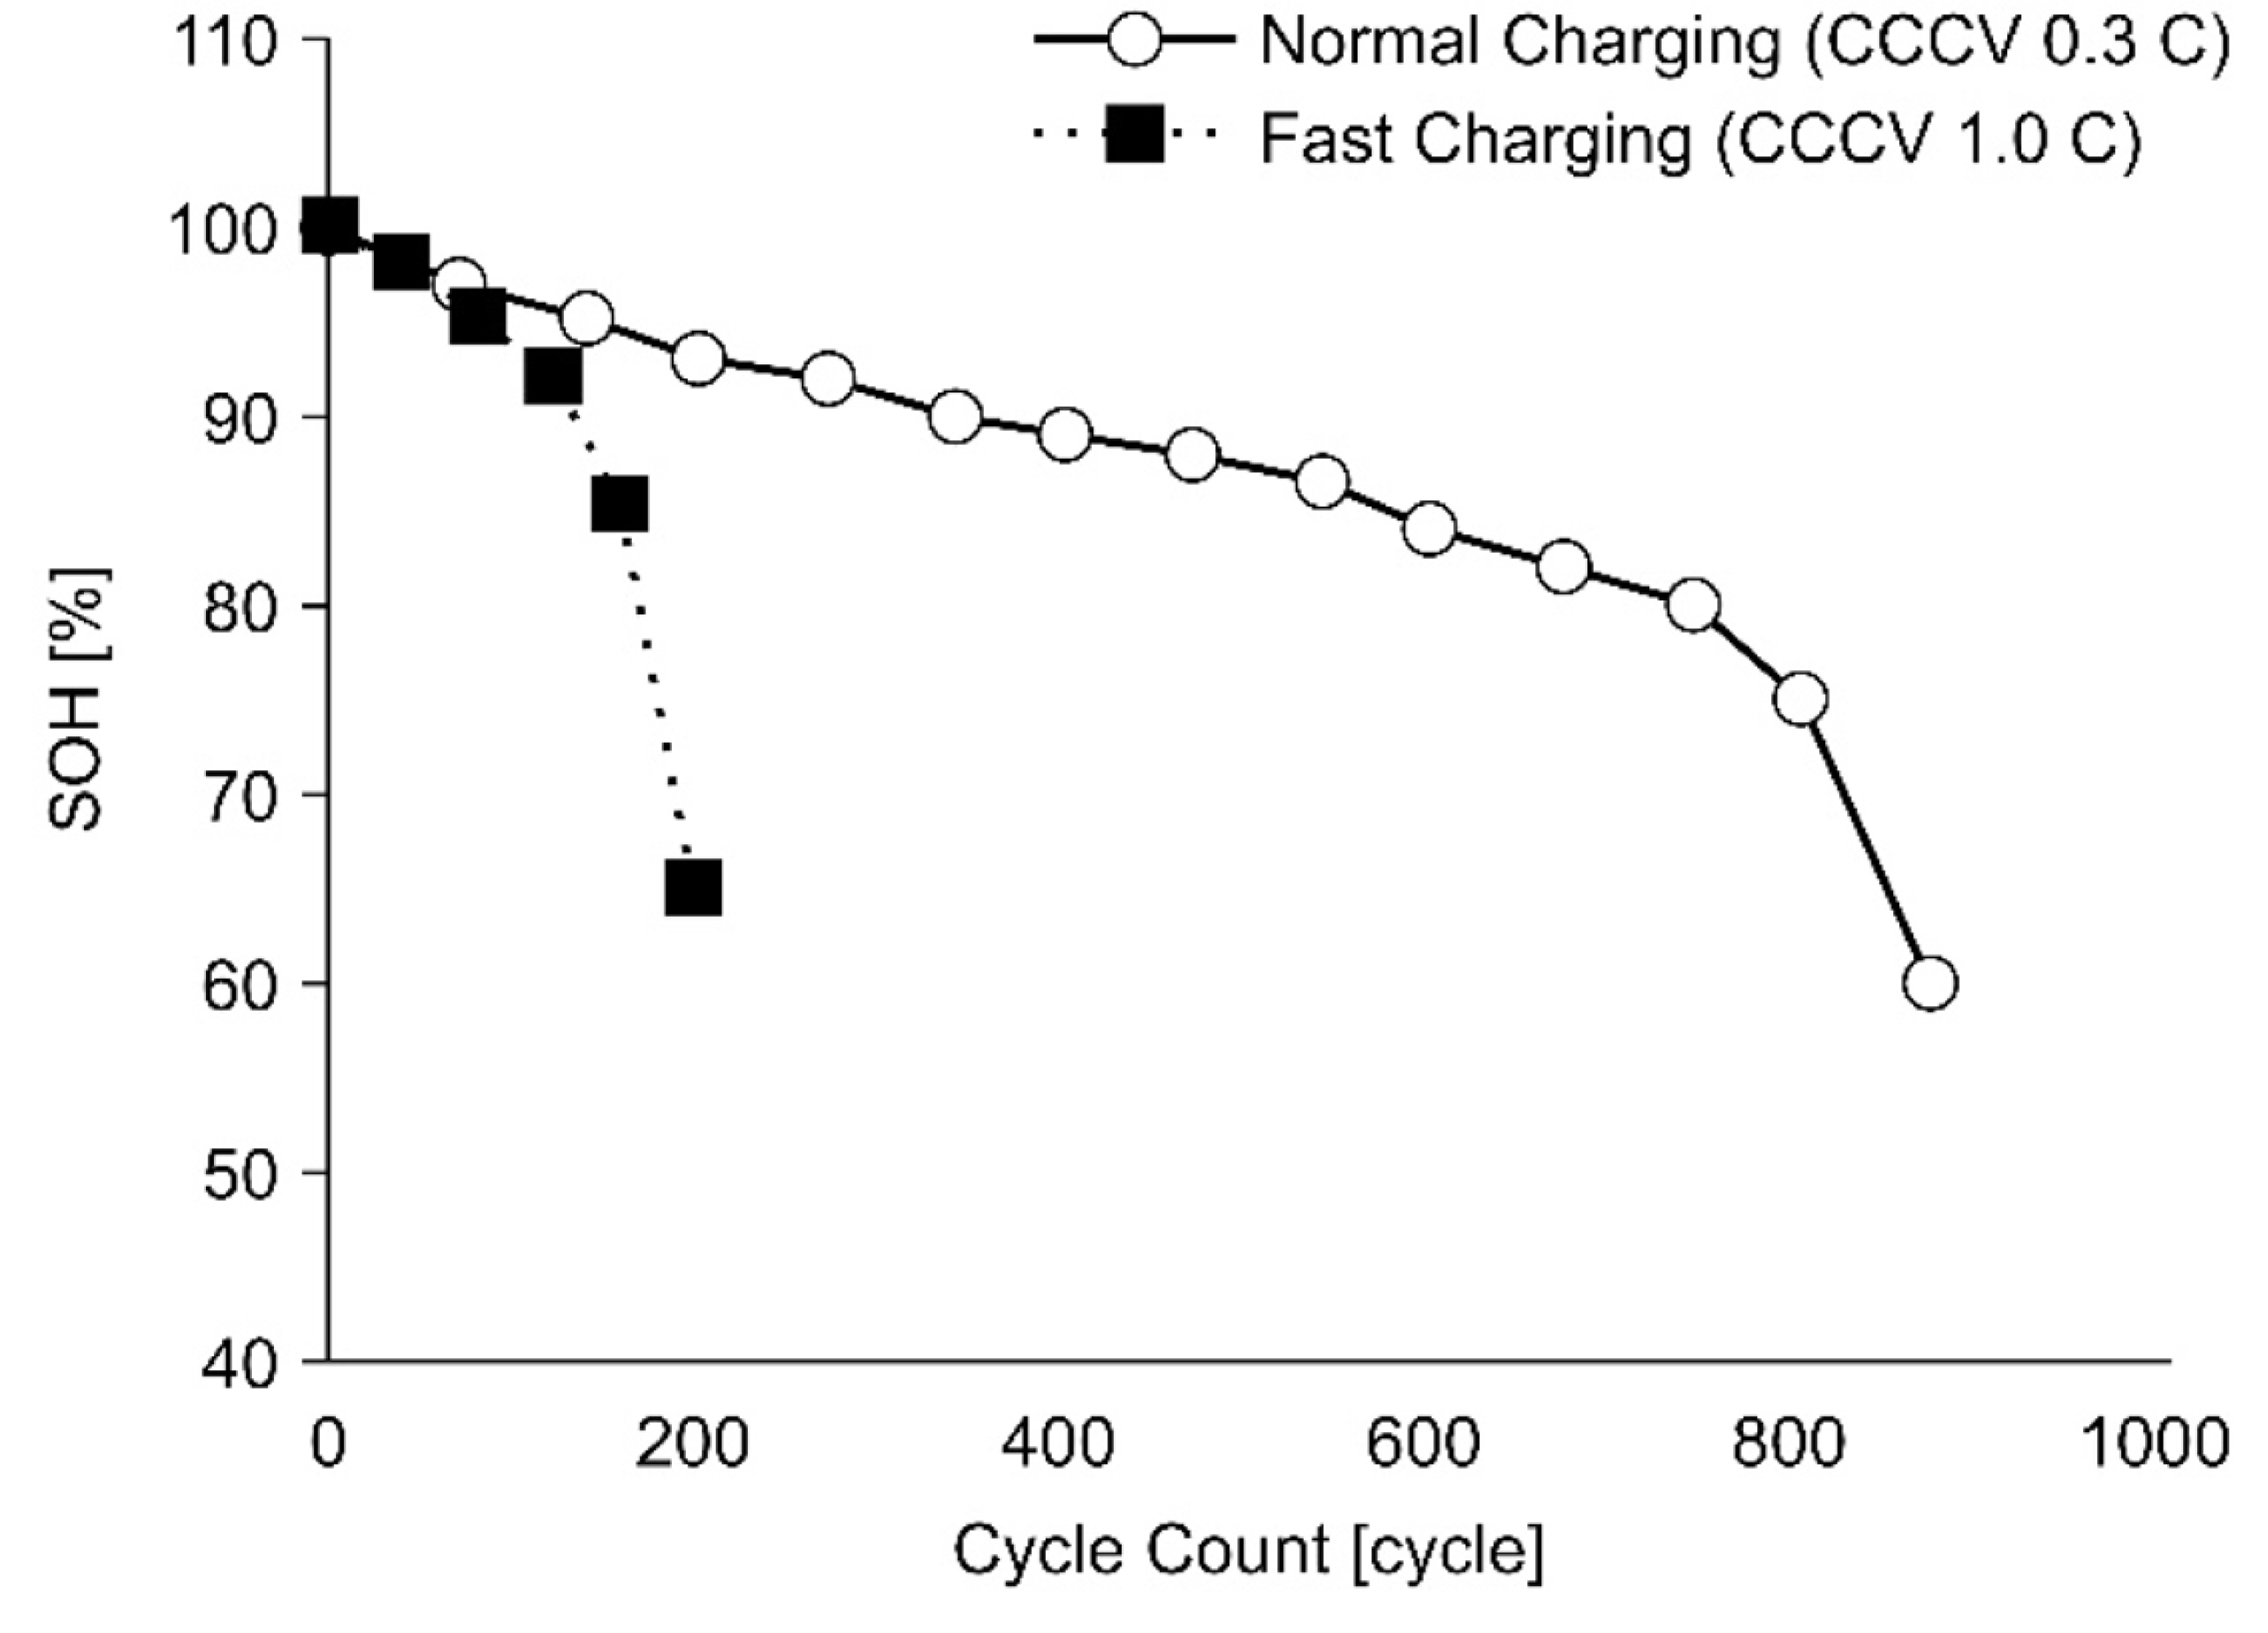
Lead-acid batteries have seen extensive use as low-voltage (12-72 V) energy sources for automotive power systems and other vehicular systems, including forklift power systems [1]. Recently, lithium-ion battery (LIB) packs have become used extensively in cars, golf carts, electric bicycles, and energy-storage devices. Indeed, LIB packs are rapidly replacing lead-acid batteries. LIBs are attracting attention because of their high input-output characteristics, long lives, and high energy densities compared to lead-acid batteries. LIBs used in electric vehicle (EV) battery packs should have a high energy density of at least 200 Wh/kg, a discharge rate of 3 C or higher, a charging rate of at least 1C, and a life cycle of more than 2000 cycles [2,3]. Meeting these conditions requires increased material and manufacturing costs, which increases the battery price. Therefore, in the forklift vehicle market, which has typically used low-cost leadŌĆōacid batteries, attempts to develop battery packs employing 18650-type cylindrical LIBs developed for IT applications have been made. These batteries offer high energy density. However, the rated charging time of a 18650-type high-capacity LIB is 2 to 3 h (0.3 C to 0.5 C), and the lifetime is 500 to 1000 cycles. These specifications do not satisfy the current requirements for use in forklifts. Reducing the charging time increases the charging current, which increases the battery temperature. These dynamics are known to be key factors in accelerating battery aging. High-speed charging above the rated charge C-rate adversely affects battery performance by accelerating deterioration. Fig. 1 shows the rate of change of the state-of-health (SOH) of the battery against charge C-rate [4,5].
Most typical charging patterns comprise conventional single- or multiple-step constant-currentŌĆōconstant- voltage (CCCV) processes [6-9]. Conventional methodologies can reduce the charging time by applying a high constant current (CC) at the beginning to achieve fast charging. These methodologies minimize cell degradation by following a series of multiple steps that decrease the current toward the end of the charge time. However, such approaches do not reflect overall cell behavior and may result in the application of excessive current, leading to rapid cell degradation near the end of charge [6]. Other recent approaches to fast charging include pulse charging and boost charging [10-13]. These methods utilize intermittent rest periods to reduce the buildup of various resistances. Even so, the design of fast-charge patterns always involve trade-offs between the charging time and cell cycle life. Therefore, the incorporation of higher current levels to make up for resting periods often leads to lithium (Li) plating, which results in a rapid loss of capacity [6,7].
The design of conventional chargers for electric vehicle batteries incorporates a two-stage structure, which consists of a power-factor-correction (PFC) converter for harmonic reduction and a DC/DC converter to control both the battery charging voltage and current. The DC/DC converter efficiency strongly depends on the total efficiency of the low-voltage battery charger [14-16]. Several requirements must be met for the chargers used in electric vehicles: 1) the switching frequency should be fixed to remove audible noise over the entire load and battery voltage range, 2) the broad output voltage regulation should be controlled, 3) snubber circuit usage should be avoided to minimize unnecessary losses, and 4) the required secondary-rectifier component voltage ratings should be low. No commercial DC/DC converter topology satisfies all these requirements. The full-bridge converter topology is simple but presents challenging switching characteristics. For example, the switching efficiency is low because the power loss in the switching element is high when the element is being turned on or off. The secondary side-circulating current is also very high [17]. The conventional phase-shift full-bridge (PSFB) topology has excellent characteristics for onboard electric vehicle chargers because it operates in a natural zero-voltage-switching (ZVS) mode, exhibits a low current ripple in the battery charging current, has a simple structure, and is easy to control. However, the voltage spike of the secondary side is too high and requires high-voltage-rating diodes. Thus, an auxiliary snubber circuit is required to improve the performance [18-20]. In contrast, an LLC resonant converter has a soft switching capability that does not require a snubber circuit to accommodate wide load conditions and turn-off voltage spikes. The output diode causes an output voltage spike. However, the battery charger supports a wide output voltage range, which results in a large circulating current [21-23].
In this paper, we introduce a fast-charging method that controls the charging current and voltage of the battery cell or pack and monitors the battery characteristics to ensure low degradation. We focused on the development of a charging algorithm because it offers a low-cost method for improving the charging rate without modifying the cell design and cell capacity, thereby allowing us to optimize the charging conditions in LIBs. In addition, a proposed DC/DC converter based on pulse-width modulation (PWM) with a primary resonant tank (PRT) increases the efficiency of low-voltage LIB chargers. The proposed 6.6-kW rapid-charging system with a rapid-charge algorithm has been implemented and validated. With the proposed rapid-charge algorithm, which is approximately three times faster than the standard charge rate of 0.3 C CCCV, a degradation rate similar to that of the standard charge can be maintained without a sudden drop in capacity.
2. Proposed Fast-Charging Algorithm
The successful introduction of low-cost 18650 cylindrical batteries to forklift energy storage systems depends on these batteries satisfying the customer requirement of reduced charging time. The charging current must be increased to reduce the battery charging time. However, this affects the characteristics of the LIB and degrades its useful life. The battery degradation mechanisms are complex and depend on the temperature, voltage, and cell performance [24]. Therefore, formulating an effective fast-charging algorithm depends on understanding the degradation mechanisms of LIBs under various charging conditions and reviewing the main factors associated with the control charging rate. Then, based on this information, an optimal fast-charging profile can be designed, and the useful life of LIBs can be evaluated.
2.1. Degradation Mechanism
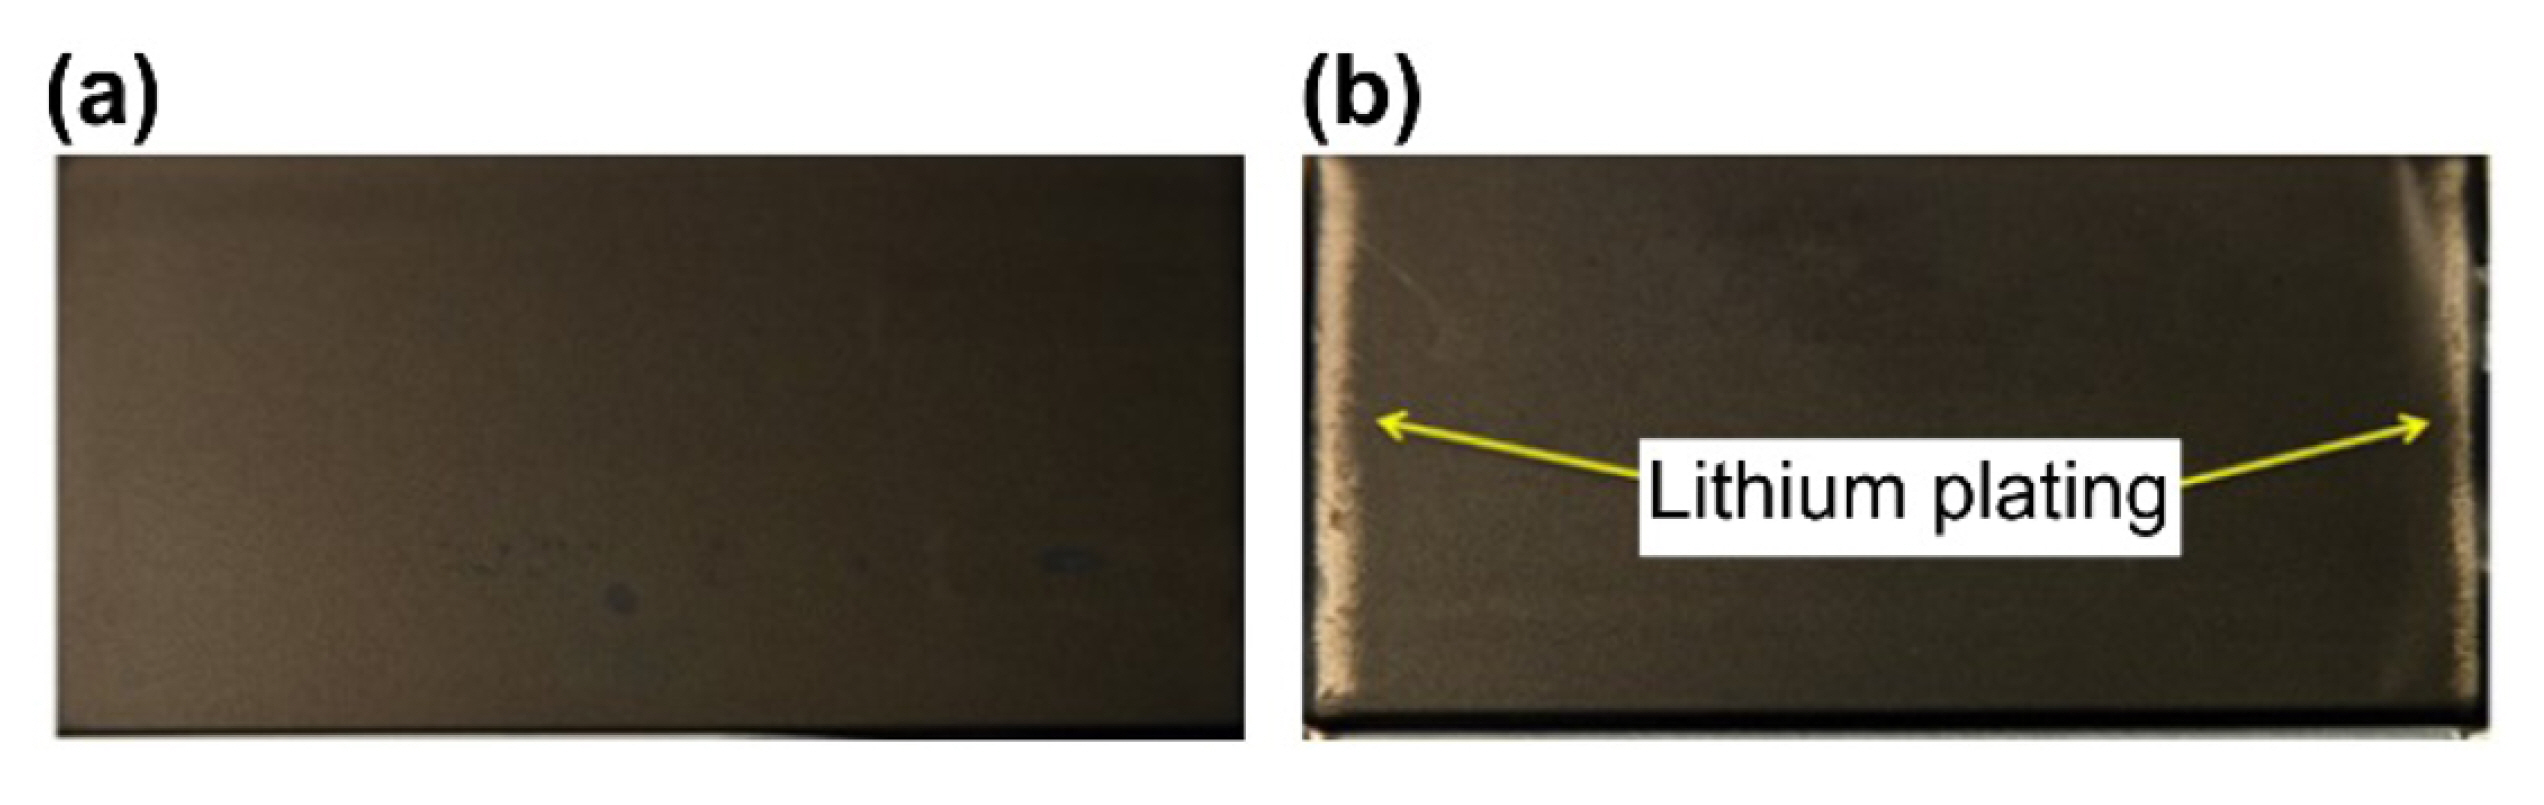
When conditions include either low temperatures or high charge currents, Li plating becomes the main factor that contributes to LIB capacity degradation. Li plating accelerates cell degradation and, sometimes, leads to internal short circuits because of dendrite formation. Fig. 2(a) shows the initial state of a LIB, while Fig. 2(b) depicts the occurrence of Li plating. Fig. 2(b) illustrates the lithium deposits and byproducts on the electrode plate typically seen in cells that show a rapid decrease in cycle life [25,26].
Fig.┬Ā2.
Scanning electron microscope image of the graphite anode surface of a LIB during normal (a) and abnormal (b) charging after degradation.
The Li-plating effect is determined by the cell characteristics and charging current. The exact conditions under which Li plating occurs are difficult to determine from experiment alone [27]. This difficulty is especially apparent in motor applications, in which wide variations in operating temperature, user driving patterns, and charging patterns would require multiple tests. An efficient means of reproducing cell performance and determining the amount of degradation attributable to a given charge profile is required to determine the charging profile.
2.2. Electrochemical Model
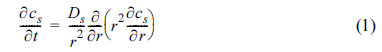
The most common model geometry for LIBs, described by Newman [28] and others, is the sandwich type, featuring a positive electrode (cathode, the source of Li+ when the battery charges), negative electrode (anode, source of Li+ when the battery discharges), and neutral porous separator between the electrodes. The separator prevents electron conduction between the anode and cathode. The anode and cathode are modeled as uniformly distributed arrays of spherical particles. The concentration of Li within the particles can be described in terms of the diffusion of solid particles, where
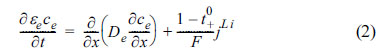
Similarly, the concentration of Li within the electrolyte can be viewed in relation to the diffusion in electrolytes, where
The potentials within solid electrodes and electrolytes obey relationships governing the charge transfer in electrodes, where

and the charge transfer in electrolytes, where
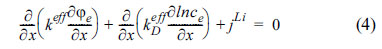
The interdependence of the Li-ion flow and electrode potential is described by the Butler-Volmer equation, i.e.,
In this instance, the results of electrode open-circuit-voltage (OCV) measurements can be used to estimate the activation overpotential, ╬Ę = Žås ŌłÆ Žåe ŌłÆ OCV, which can be applied to Eqn. (5).
The OCV data for the anode and cathode were obtained from the coin-cell experiment shown in Fig. 3. The relative potentials of the positive and negative electrodes were measured using the Li metal potential as the reference electrode. The measurement of the OCV of the two active materials was carried out using the galvanostatic intermittent titration technique [29]. The electrochemical model permits the estimation of the distributions of Li ions in both the solid state and electrolyte. It also defines the potential distribution within the electrode and electrolyte, thereby allowing the battery overvoltage to be measured under both charging and discharging conditions.
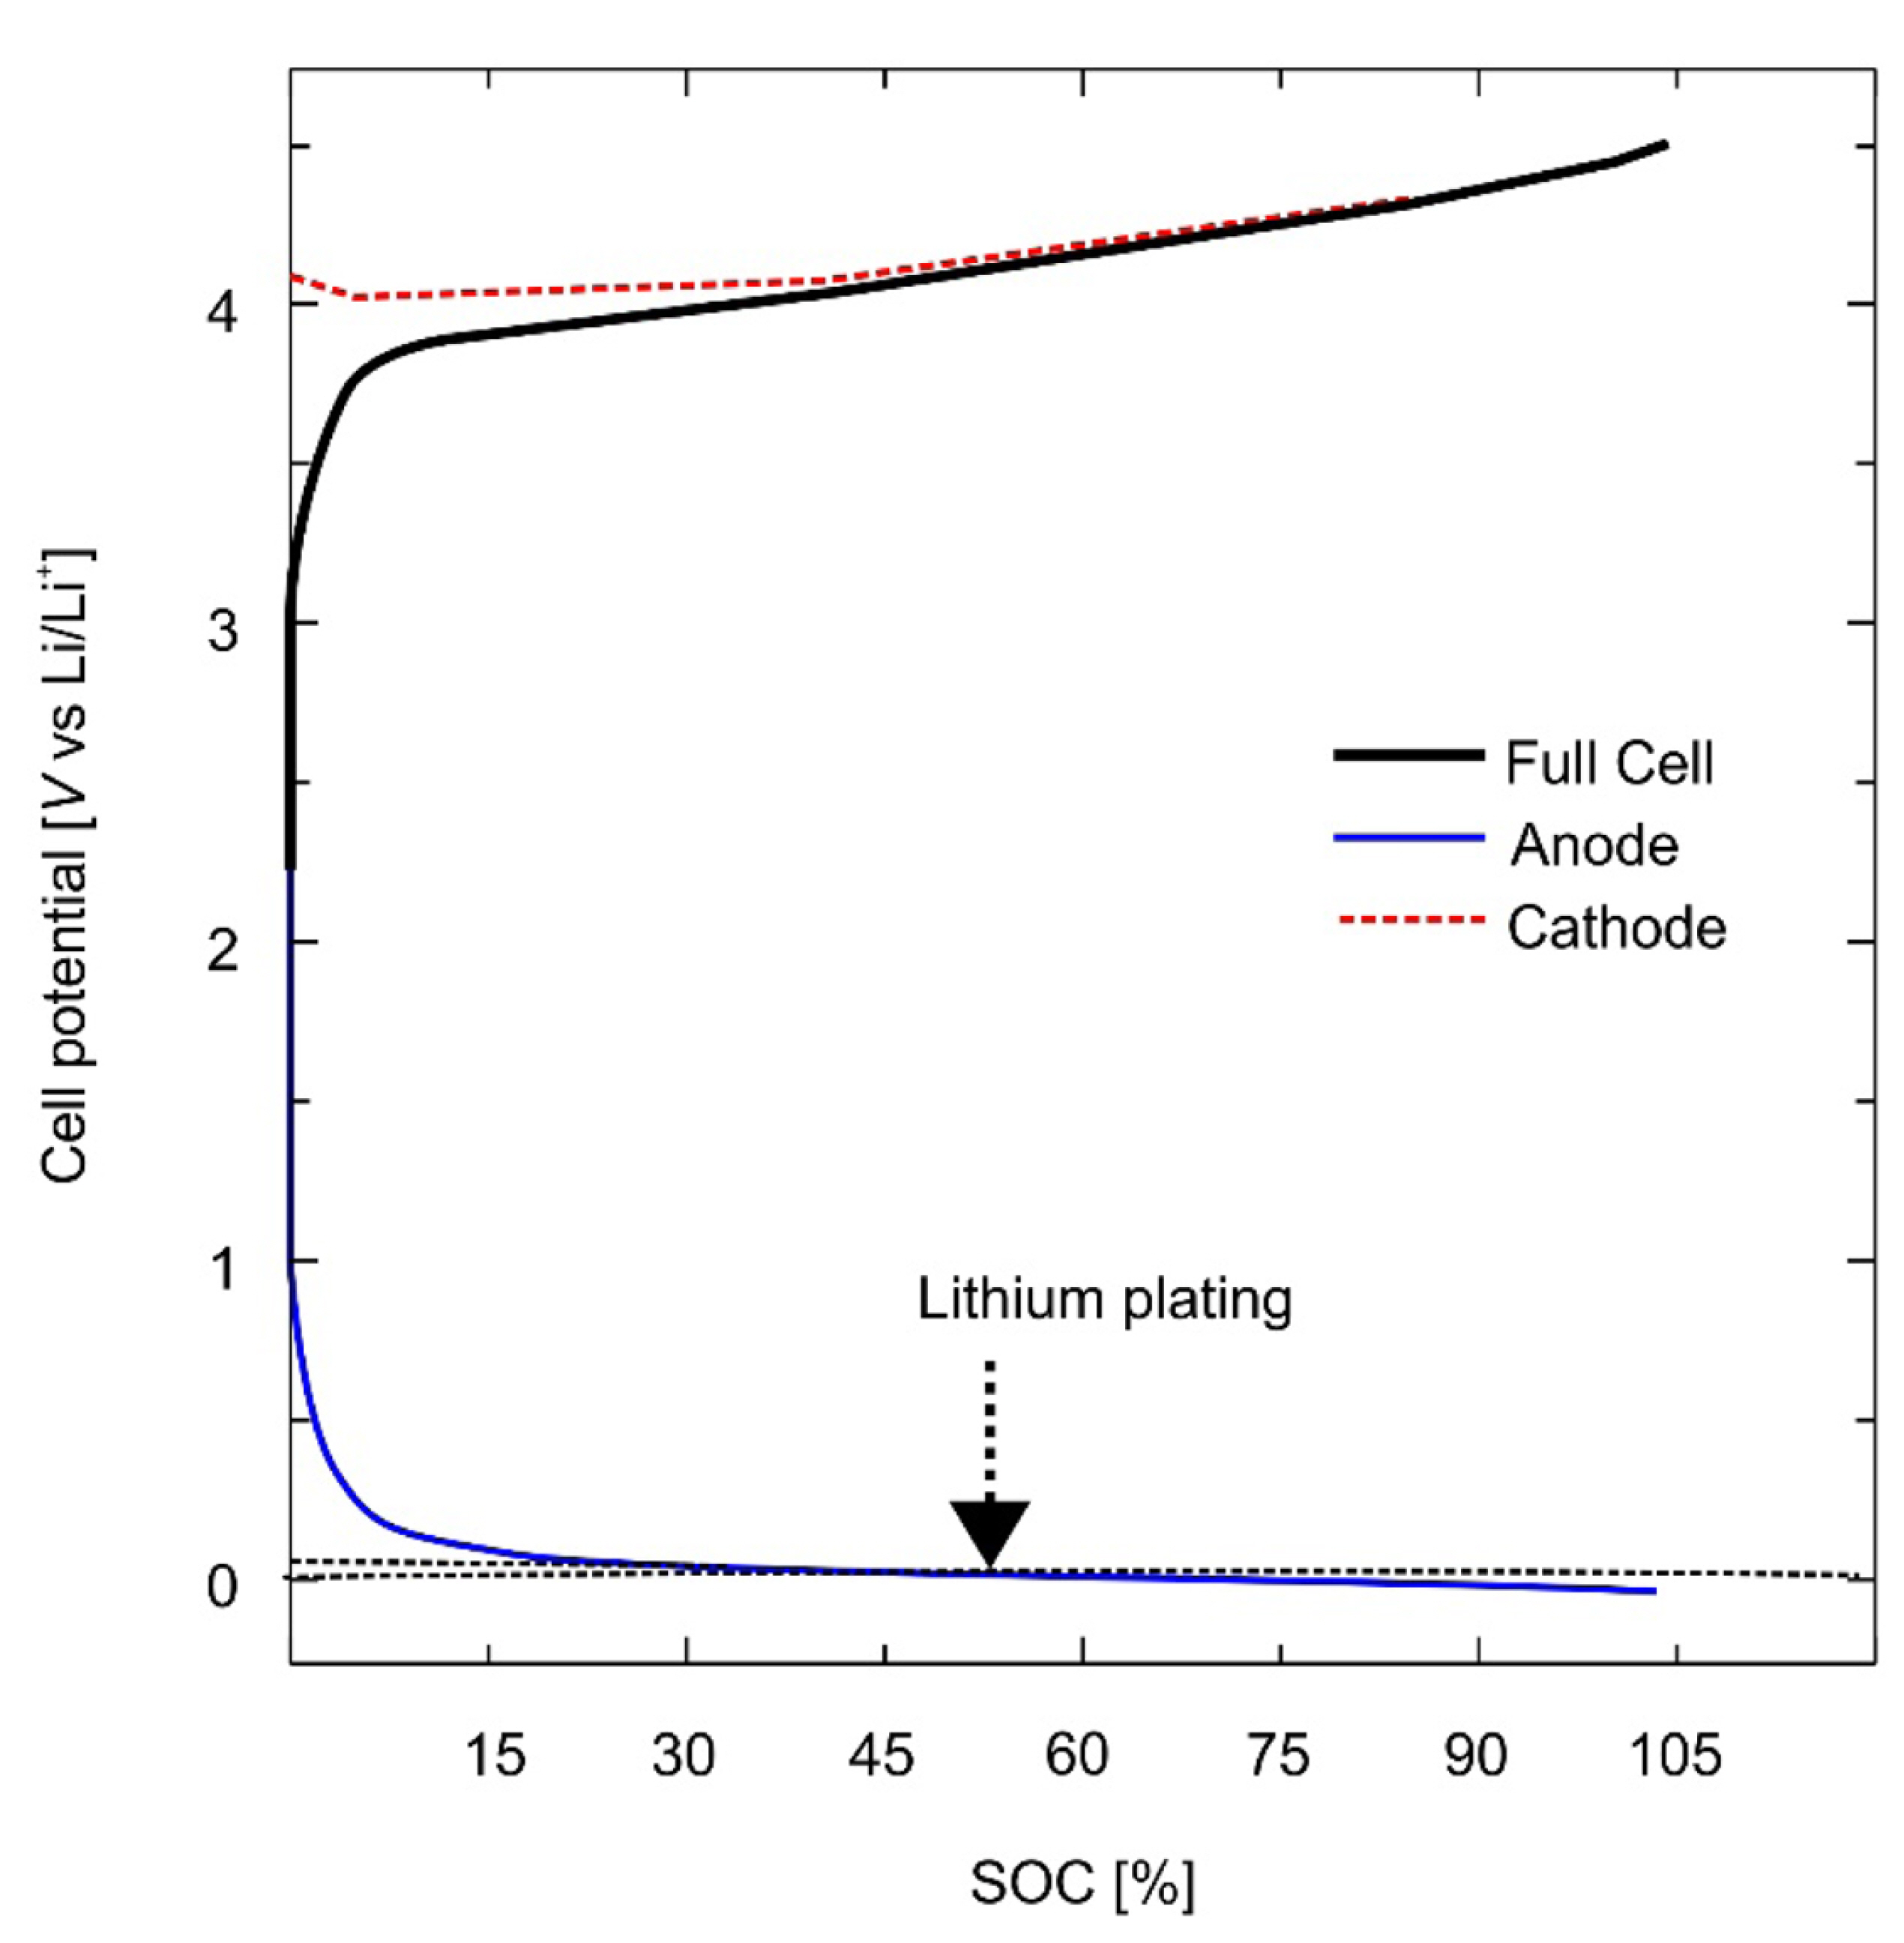
First, we developed an electrochemical model using such cell information as the material properties and OCV curves. Some initial parameters, such as diffusion coefficients in the solid state and electrolyte and reaction rates, were not known accurately. We performed preliminary charging and discharging tests using reference CCCV algorithms with widely ranging charging currents of 0.3 C, 0.6 C 0.9 C, and 1.2 C. Then, we made a LIB model of experimental and simulation curves by varying the parameters listed above, as shown in Fig. 4.
2.3. Li-Plating Prediction Model
The phenomenon involving the deposition of metallic Li merits consideration and description. The desired reaction can be described as

An overcharging reaction occurs under certain voltage or temperature conditions. Thus,

The lithium plating rate can be calculated using

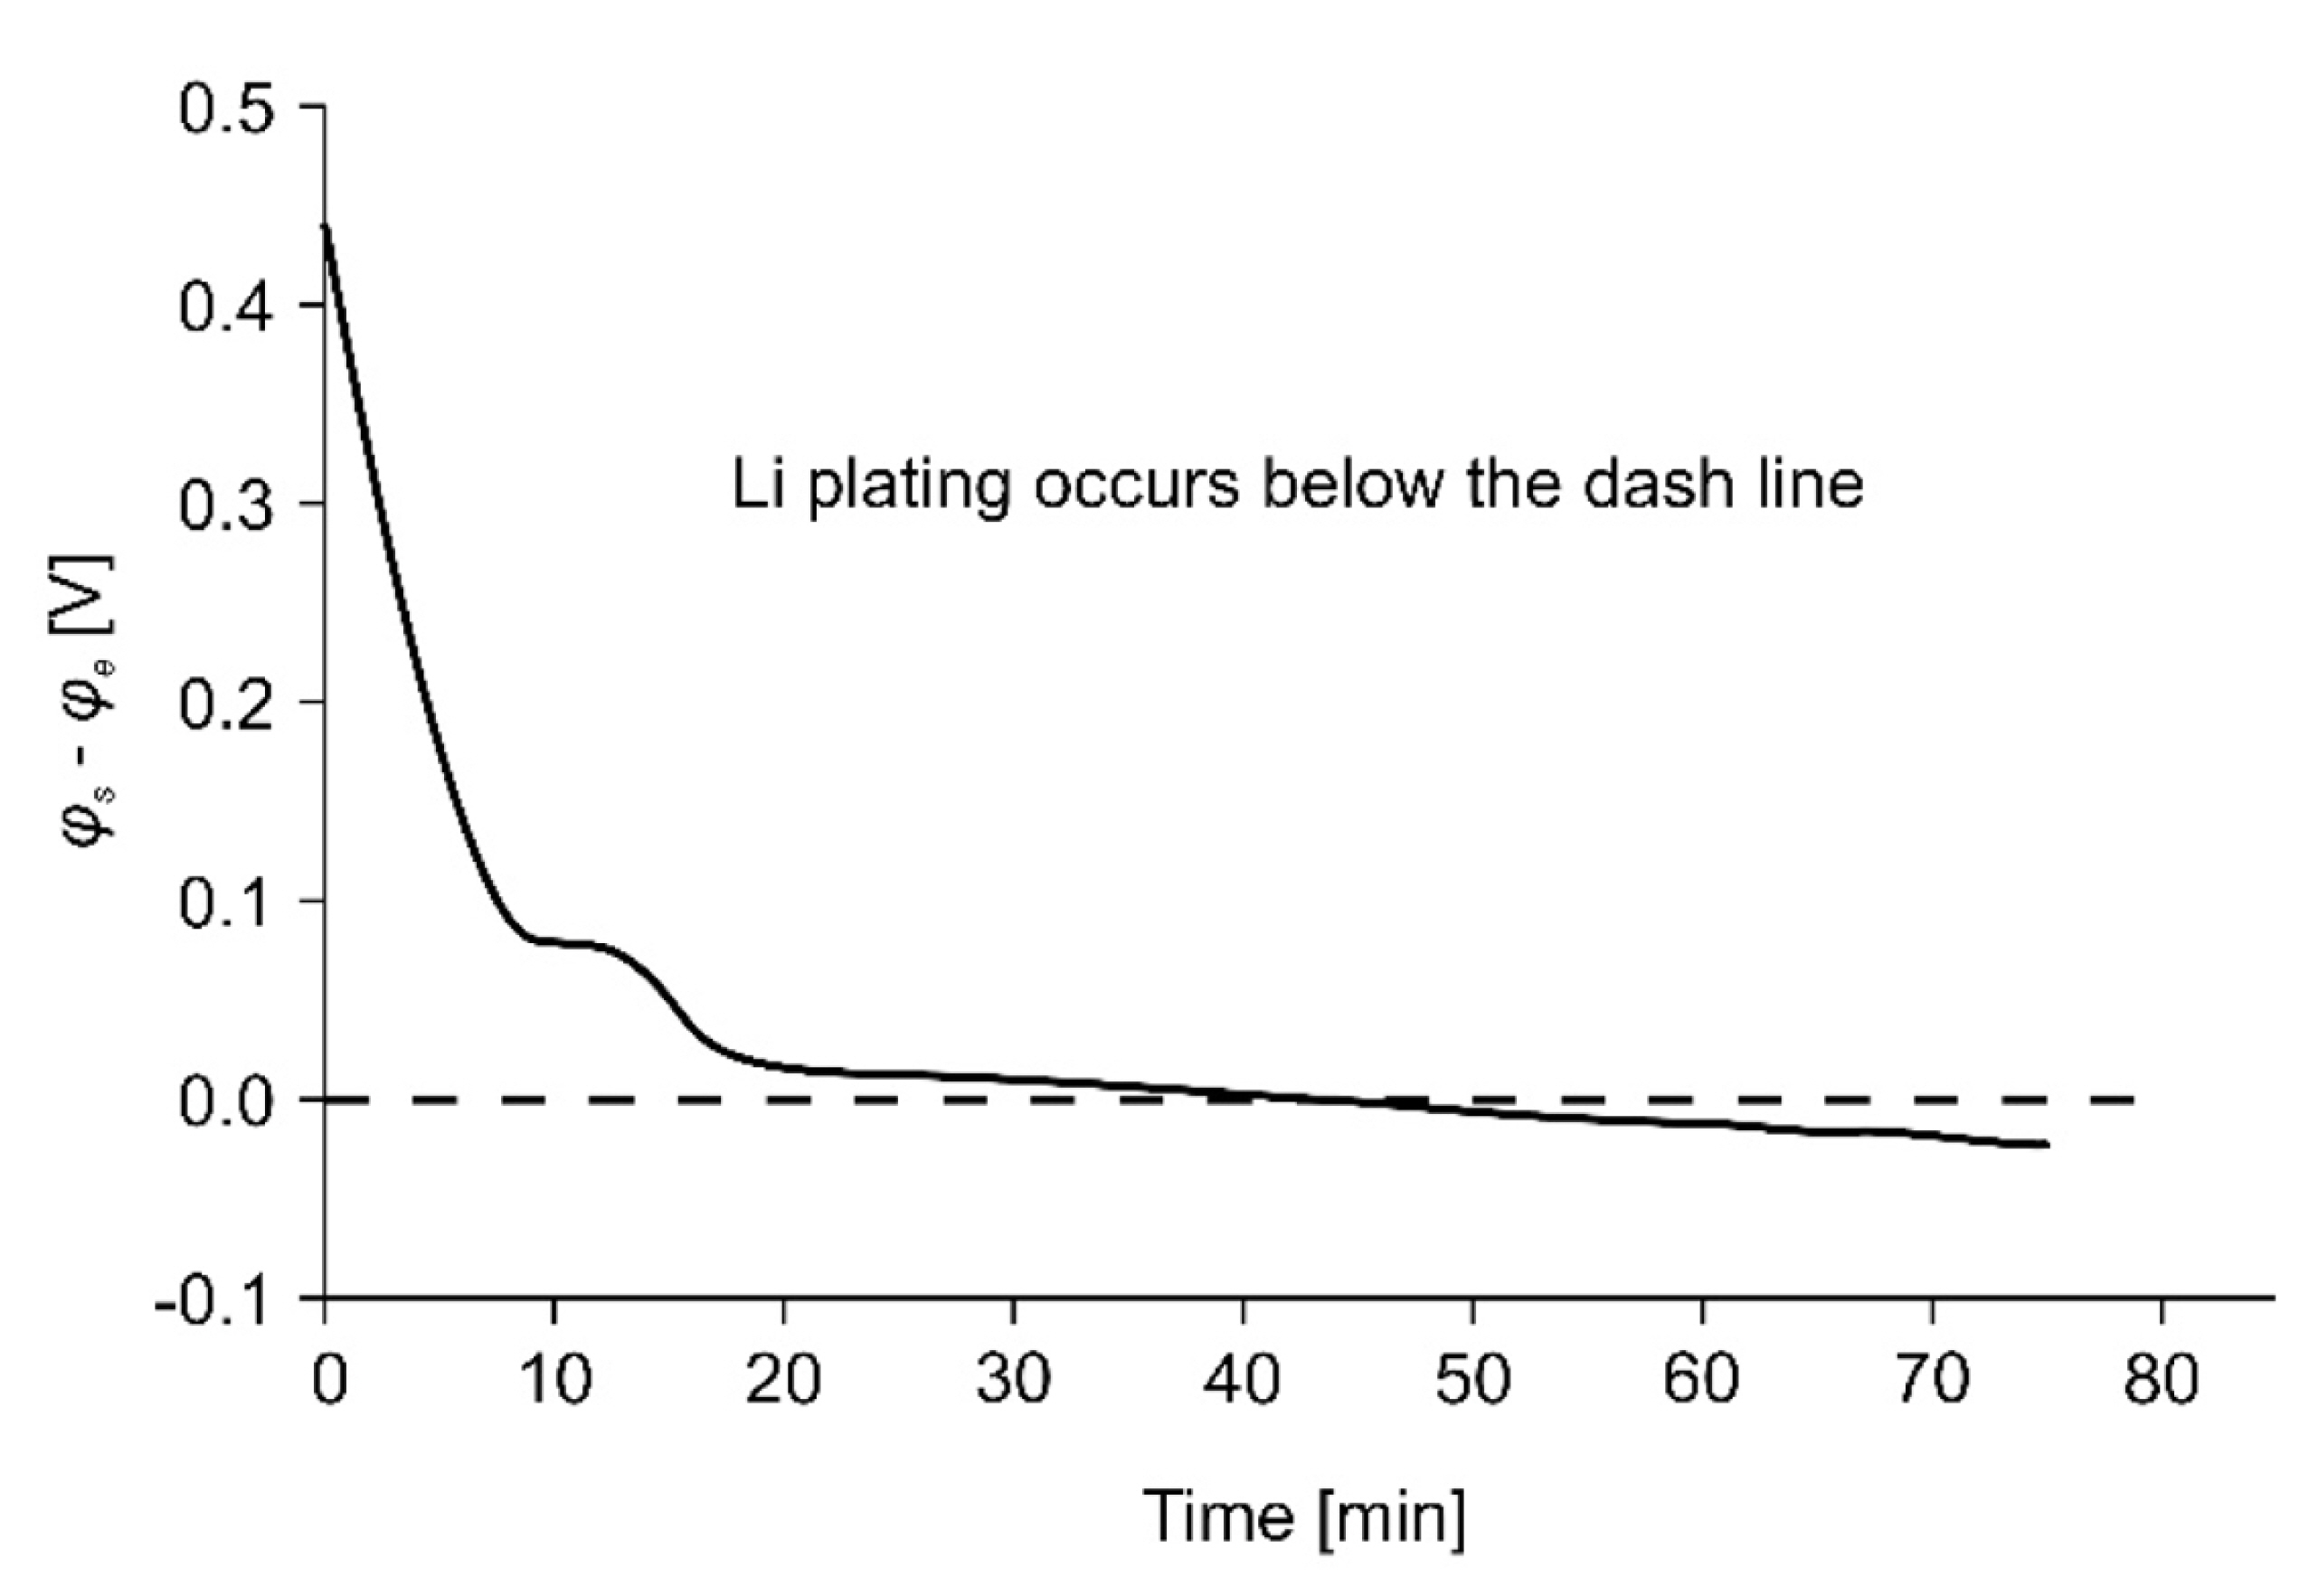
if conditions
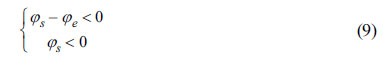
are satisfied.
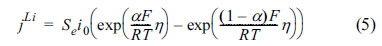
Fig. 5 shows the difference, Žås ŌłÆ Žåe, between the electrode and electrolyte potentials for a specific C-rate condition that causes Li plating. Li plating occurs when the difference in the relative value of the electrode and electrolyte potentials falls below the dotted line marking zero difference. Žåe has a very small positive value under these conditions and satisfies the Žås < 0 condition [30]. The determination of the charging conditions for which Li plating does not occur at various temperatures, voltages, and values of state of charge (SOC) and state of health (SOH) is achieved using an electrochemical model that accurately represents the battery characteristics. The fast-charging profile proposed in this paper was designed and verified using the electrochemical model described earlier.
2.4. Concept of the Fast-Charging Method
CCCV charging is widely used in industry. The CC charge rate in this method reaches its maximum within the given charge time and current-and-voltage limits but is not optimized for the cell characteristics. Performance degradation may be reduced if the charge current is controlled in relation to the SOC dependency.
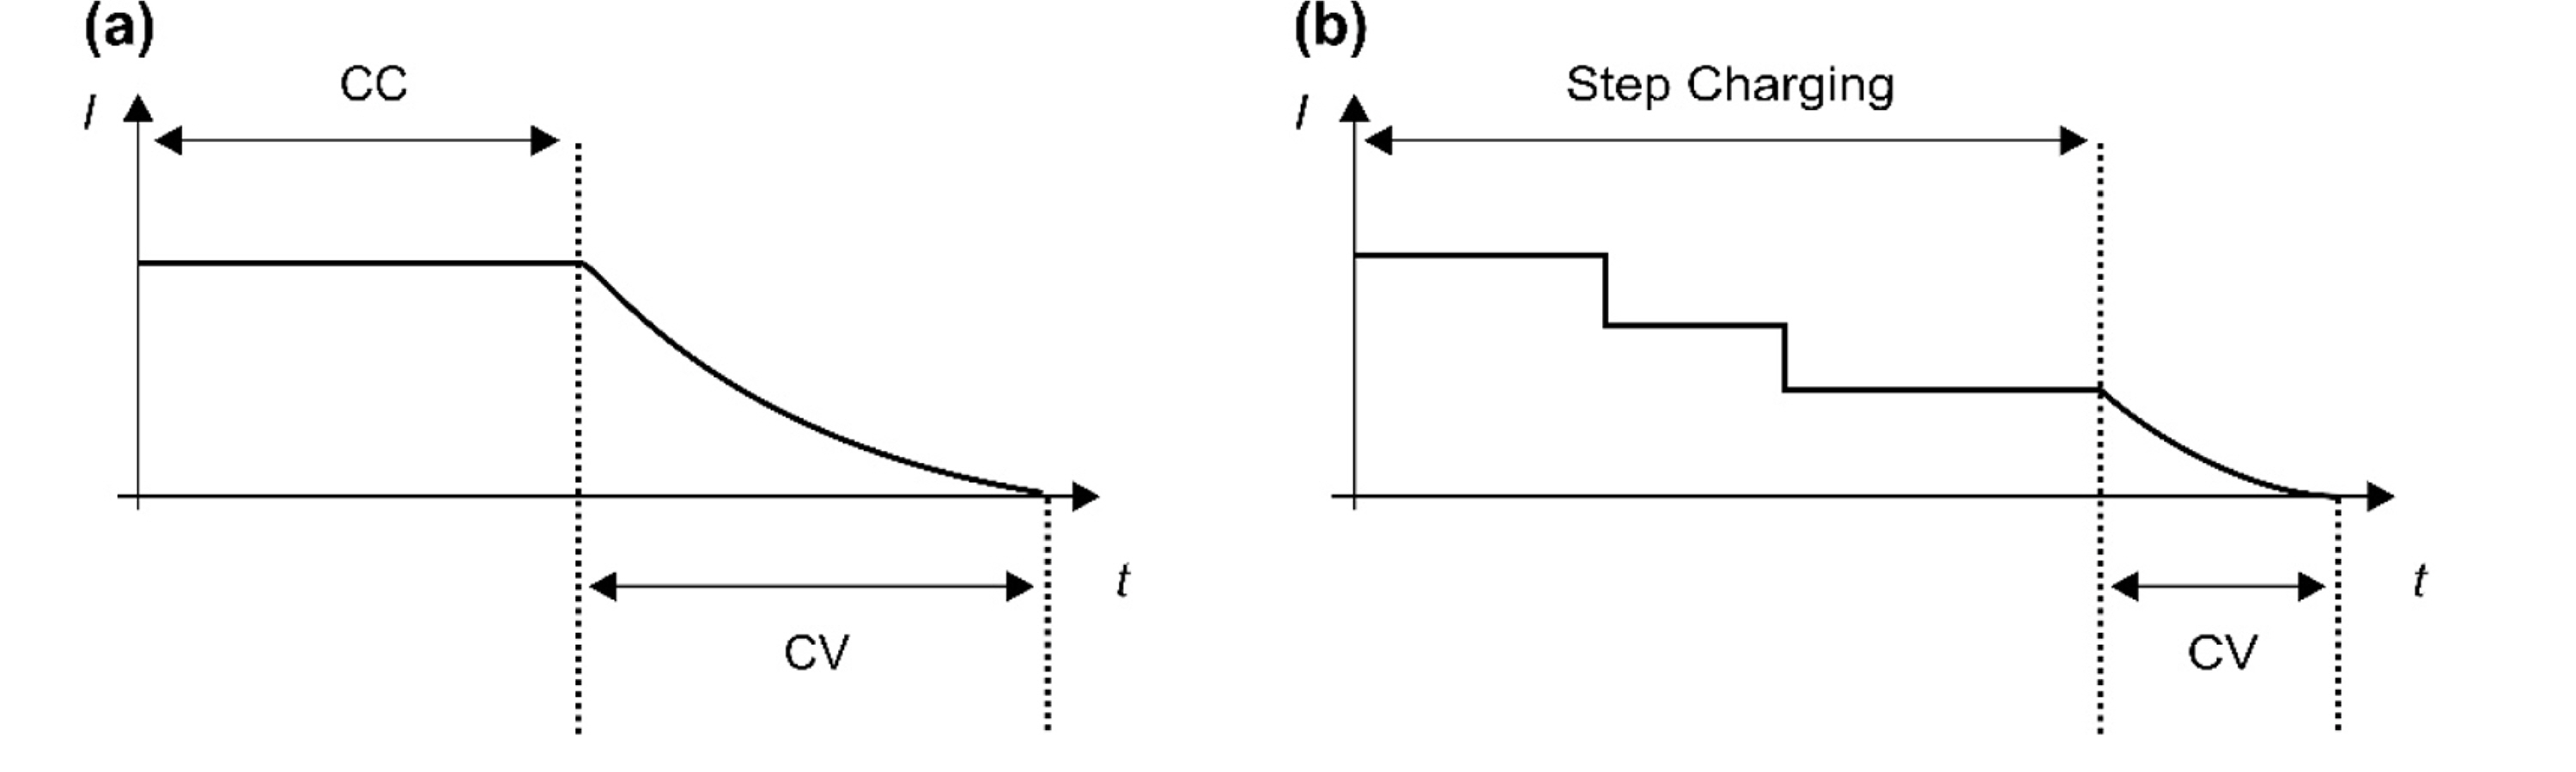
Fig. 6 depicts plots of the CCCV and step-charging methods. The main goal of developing the fast-charge algorithm was to find the optimal charge profile that simultaneously provides low degradation and fast charging. The optimized charge current can be expressed as a function of several parameters. Thus,

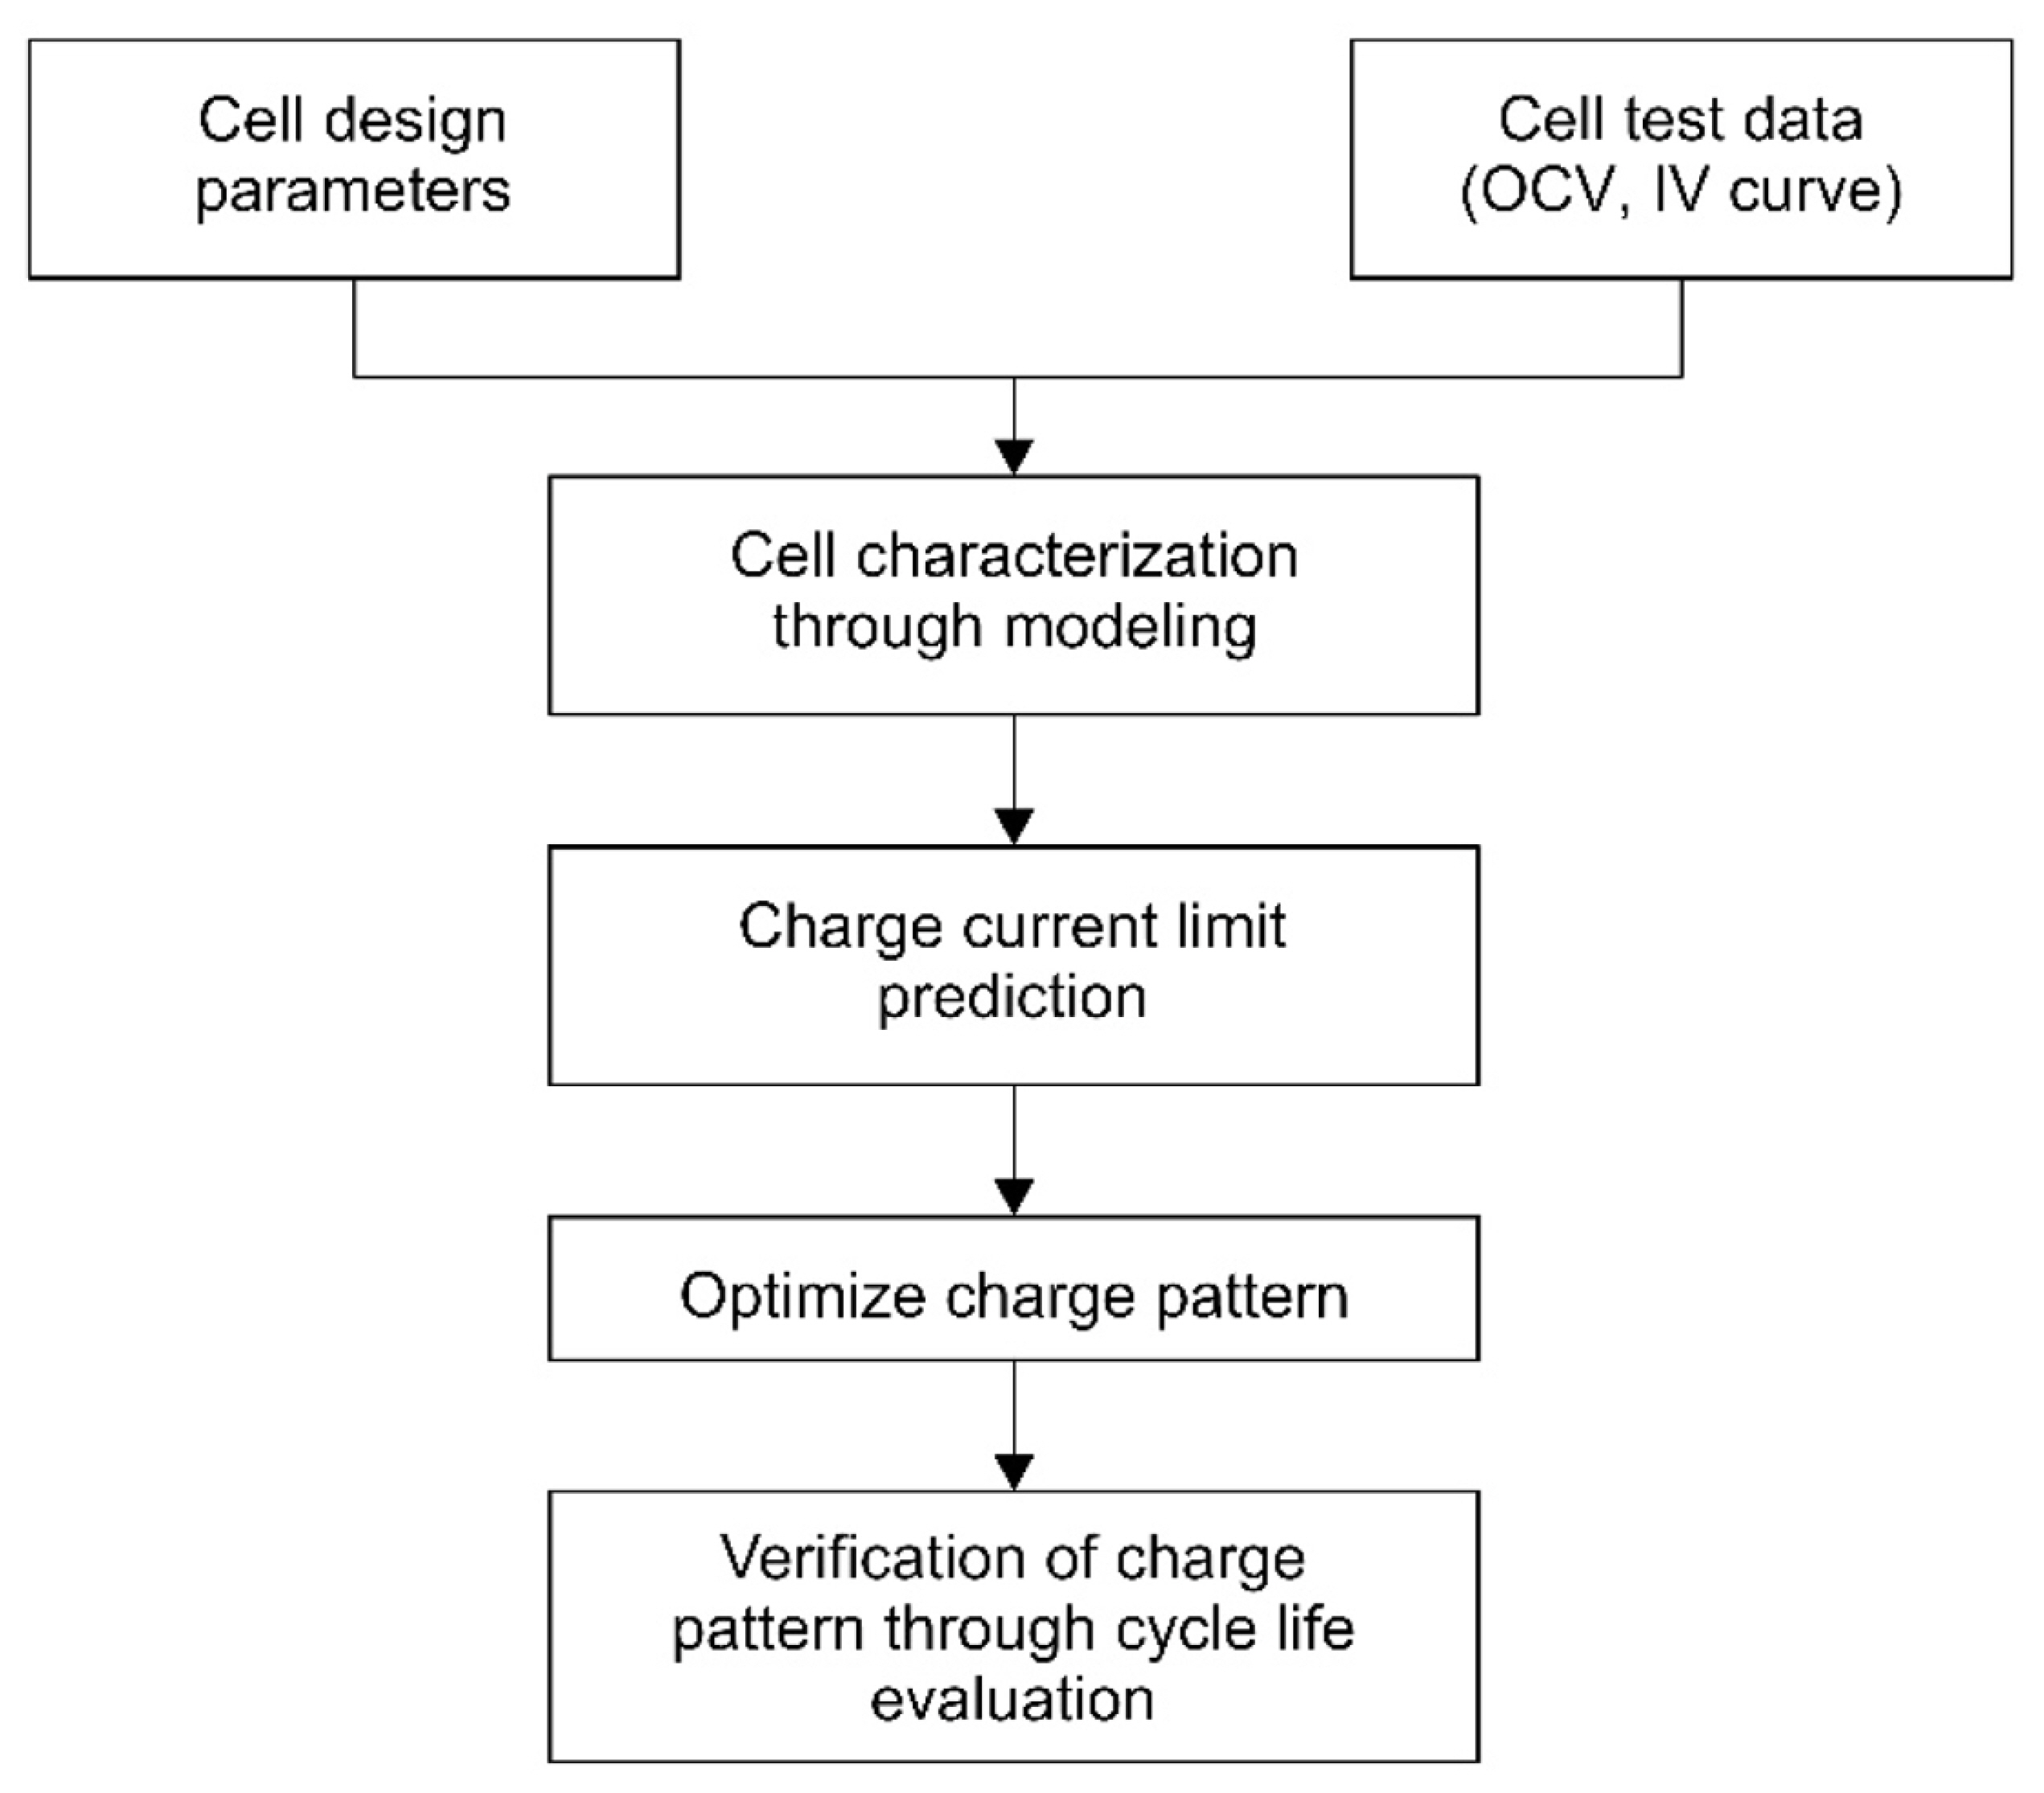
where V is the voltage, SOC is the state of charge, T is the temperature, and SOH is the state of health. Quantifying the cell degradation based on the charging current is necessary for determining the optimal charging current. Our approach estimates the optimal charging current by applying the electrochemical model proposed in the previous section. Fig. 7 shows our process to determine the fast-charging profile.
2.5. New Charging Profile
An electrochemical model was developed for a given cell, and a step-charge profile with a Li-plating limiting current was developed to yield a fast-charging profile.
Fig. 8 shows the Li-plating limit curve under two temperature conditions. Cell temperature increases led to decreases in both the internal resistance of the cell and the overvoltage. As a result, the upper limit of the charge current that could be applied to the cell could be increased. Therefore, at higher temperatures, less time was required for charging. Consequently, the developed step-charging profile featured a high charge current that could be applied in the initial region where the SOC was low and a low charge current that could be applied in the late SOC region. The efficient optimization of the charging time, amount of charging, and degree of degradation was made possible by a simulation-based methodology.
Fig.┬Ā8.
Charging current limitation curve for determining the maximum current without Li plating of ICR18650-26F at 25 and 45Ōäā.

Fig. 9 shows comparisons between the simulation and experiment for a multistep CCCV-type charging profile optimized for each temperature. The results of the simulation and experiment show good agreement for the current and cell voltage at temperatures of 20 and 45Ōäā. The 45Ōäā case allowed a higher initial charging current than the 20Ōäā case, which yielded a shorter charging time.
Fig.┬Ā9.
ICR18650-26F cell behavior for experiment and simulation results at (a) 20Ōäā and (b) 45Ōäā.
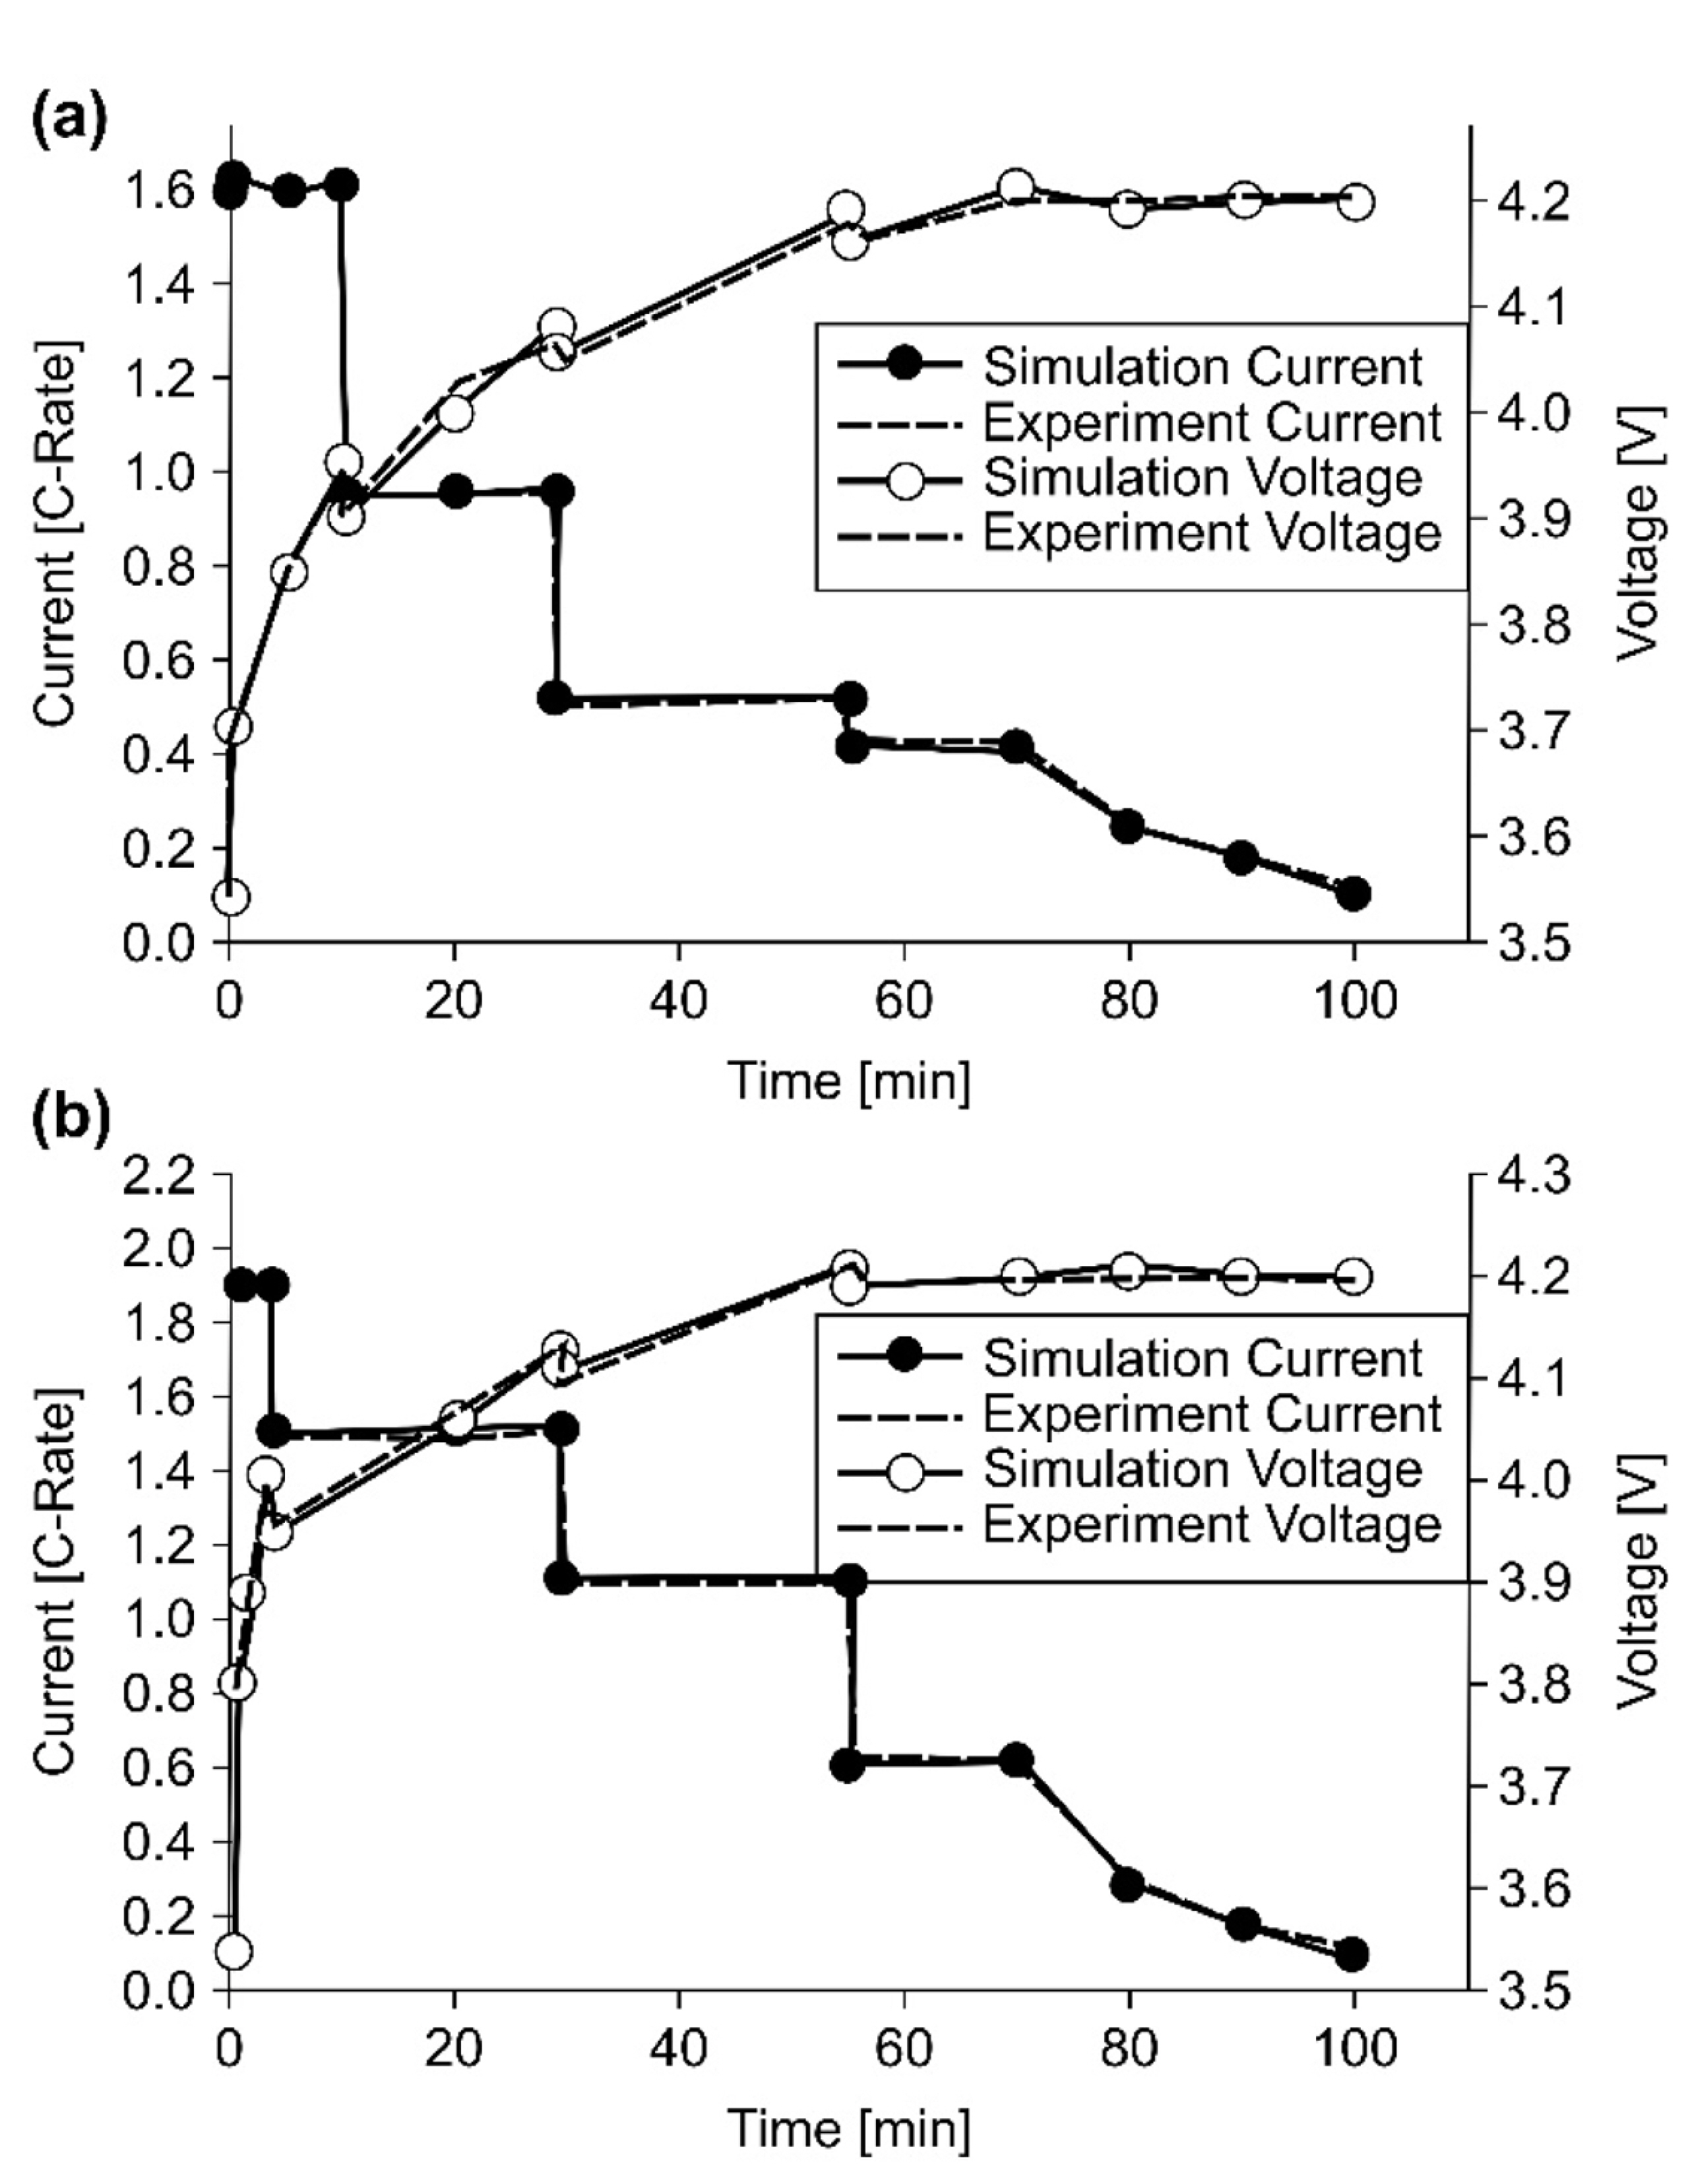
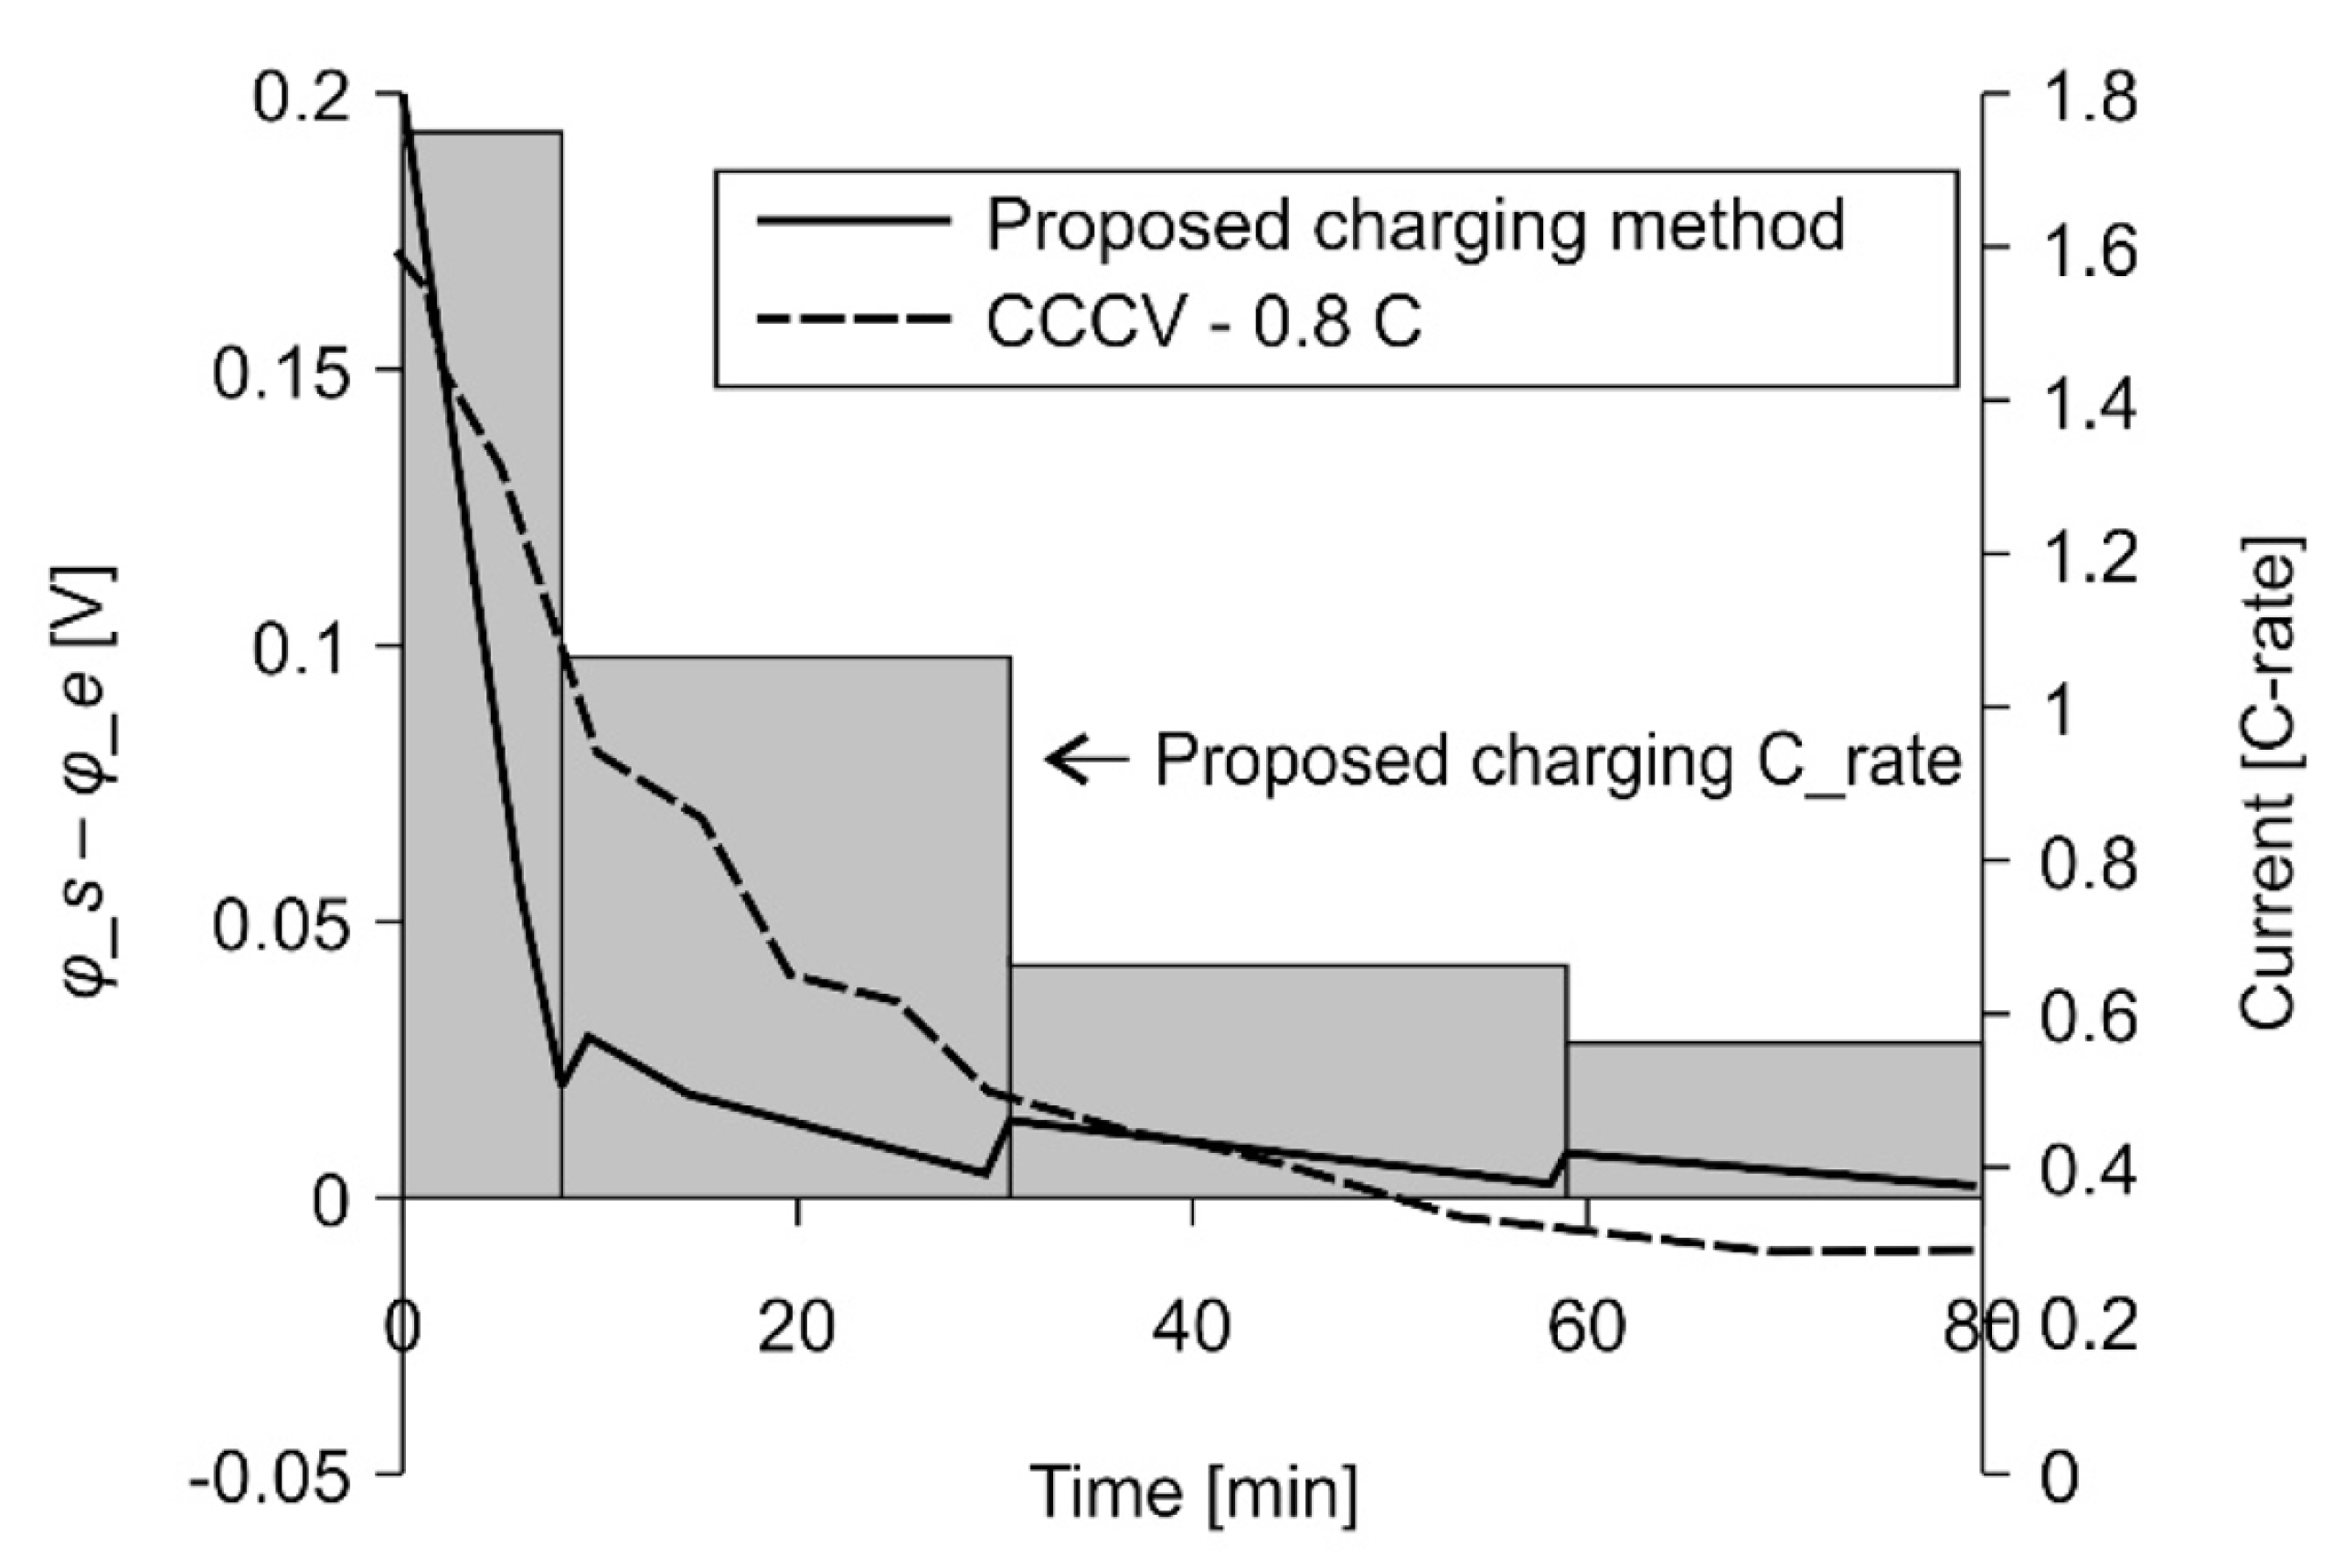
Fig. 10 shows the simulation results for the optimized charging profile at 25Ōäā. This simulation checked whether the profile caused Li-plating conditions to occur. Here, the 0.8 C CCCV condition caused Li plating, but the proposed charging profile condition did not.
3. Proposed Converter
The configuration of the proposed converter, shown in Fig. 11, is based on a conventional resonant converter that offers several advantages, including transformer-leakage inductance absorption by a resonant tank and a low-voltage rectifier. The proposed converter, unlike existing resonant converters, is controlled only by PWM; this arrangement addresses the efficiency degradation caused by high-frequency operations and the low-load regulation problem caused by frequency variations. Fig. 12 shows the key waveforms of the proposed converter.
Fig.┬Ā11.
(a) Configuration of the proposed converter and (b) block diagram of current and voltage charging control.

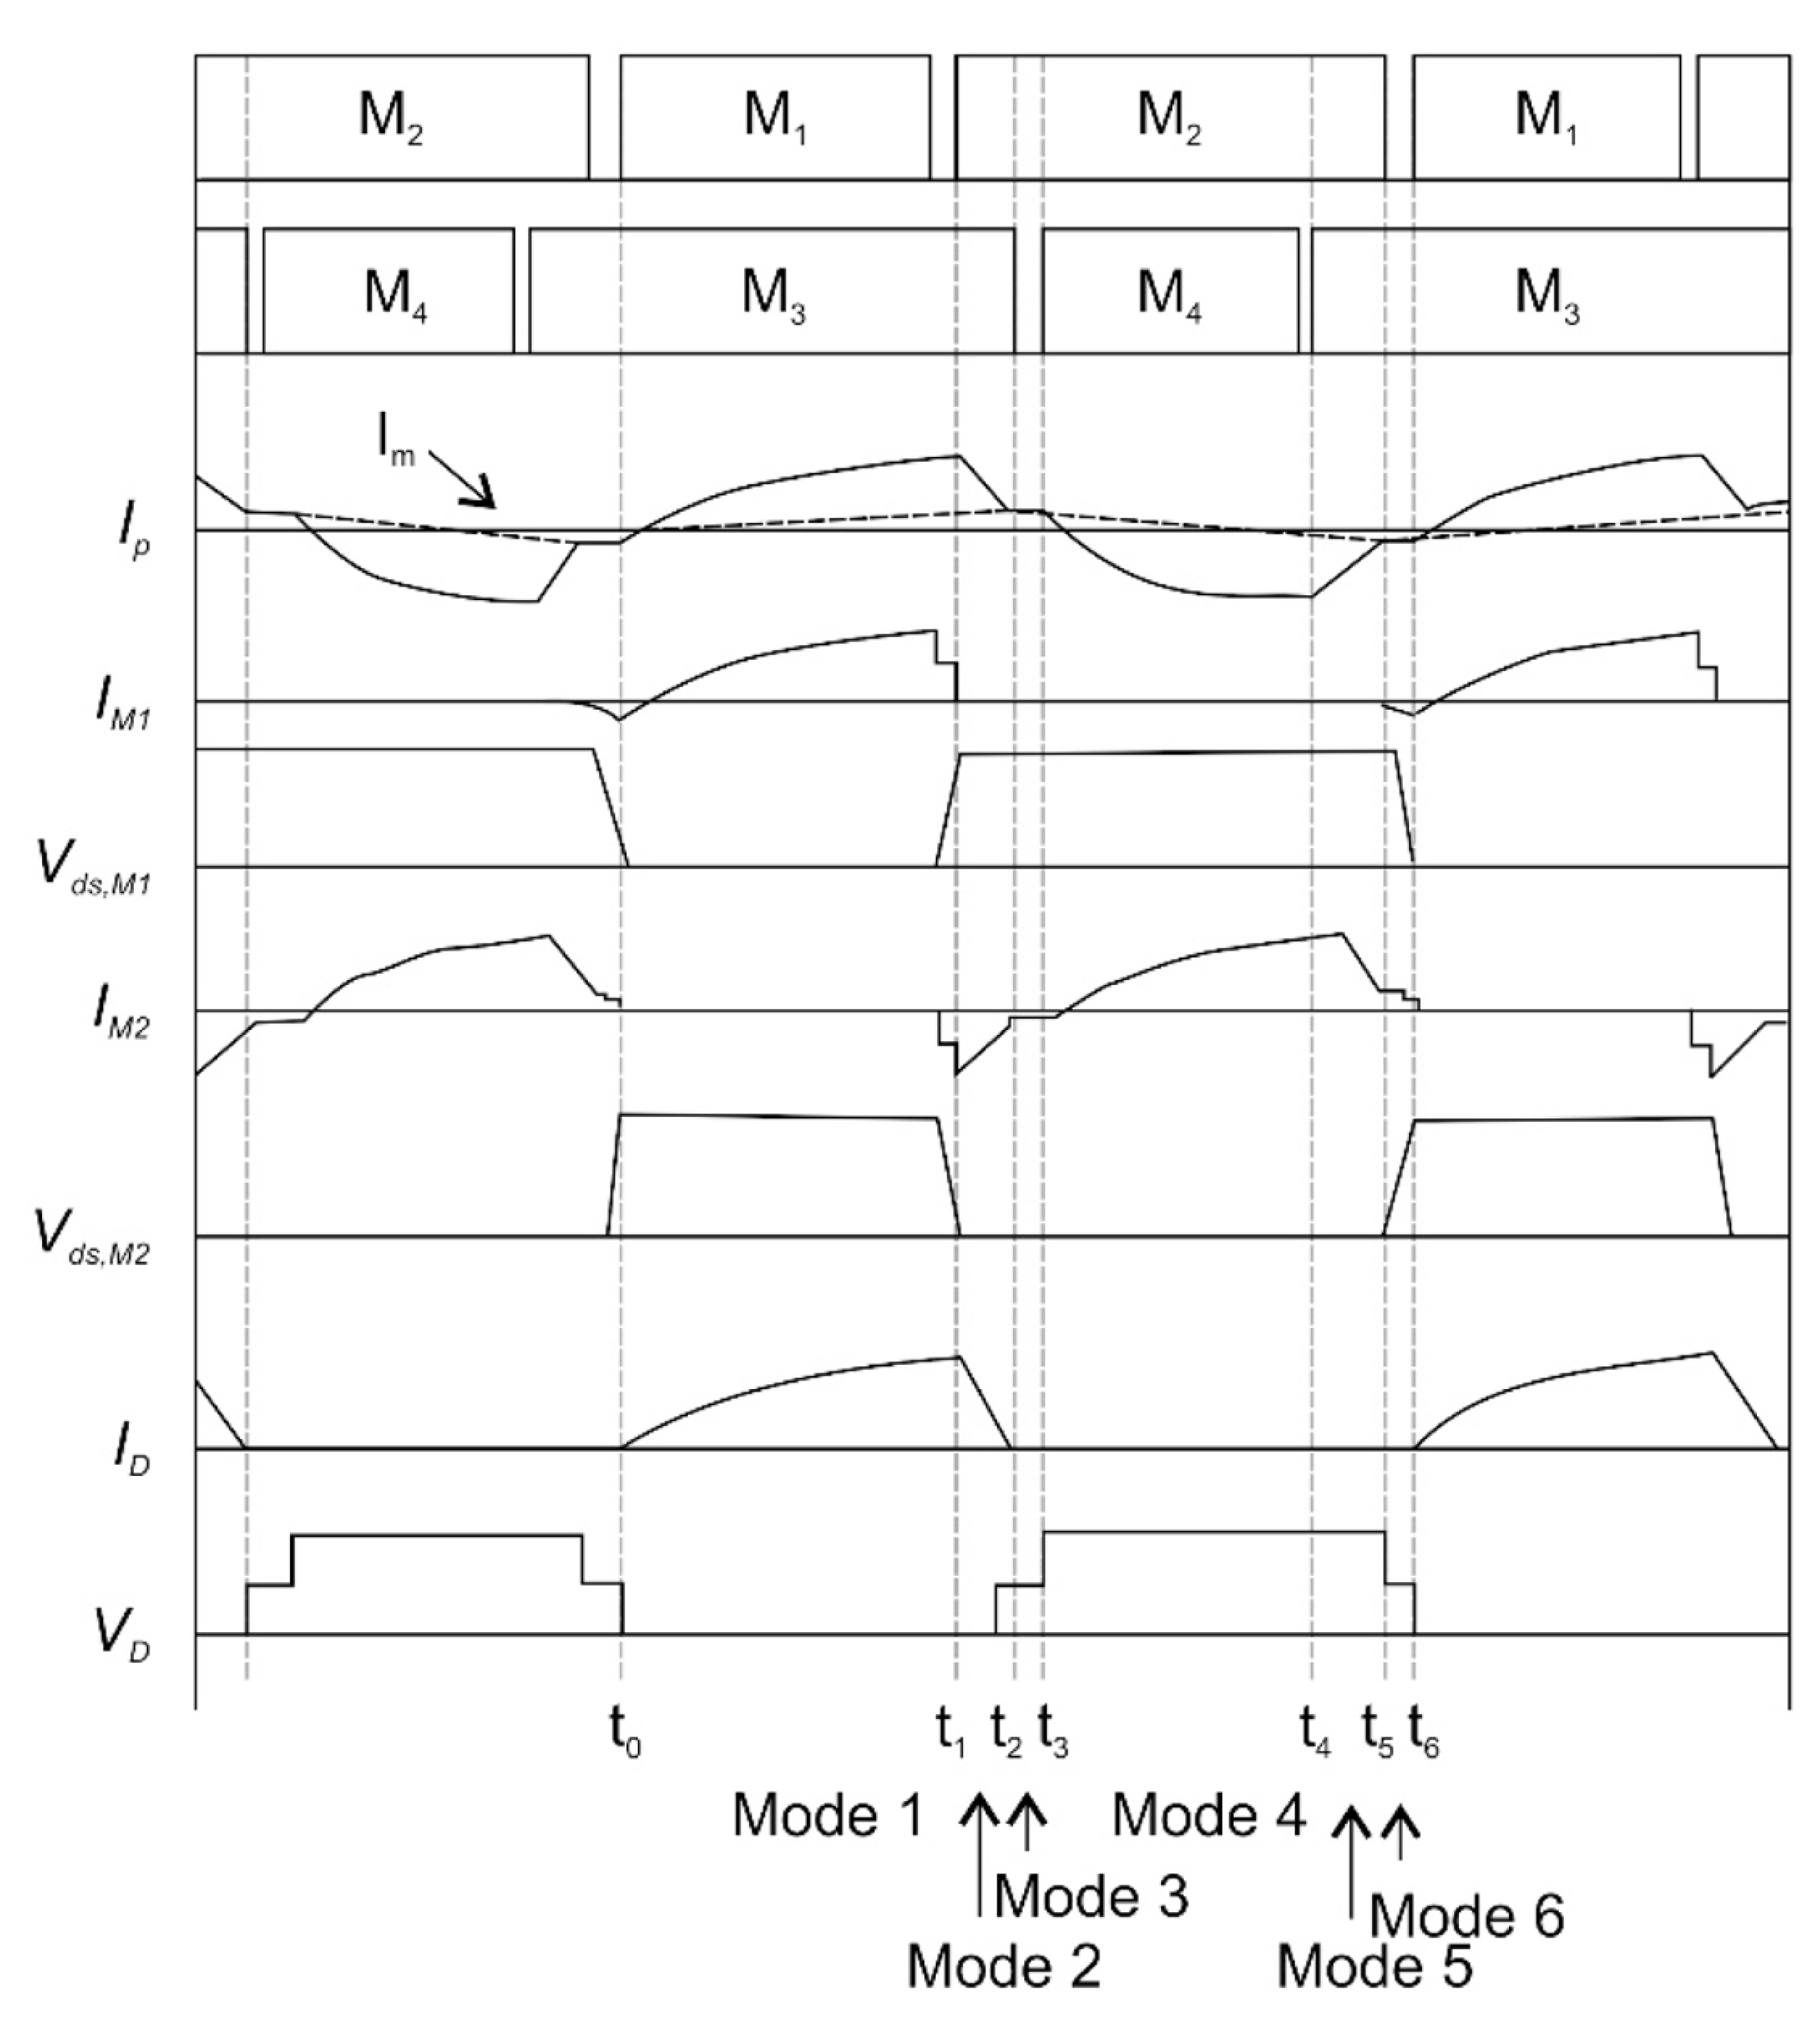
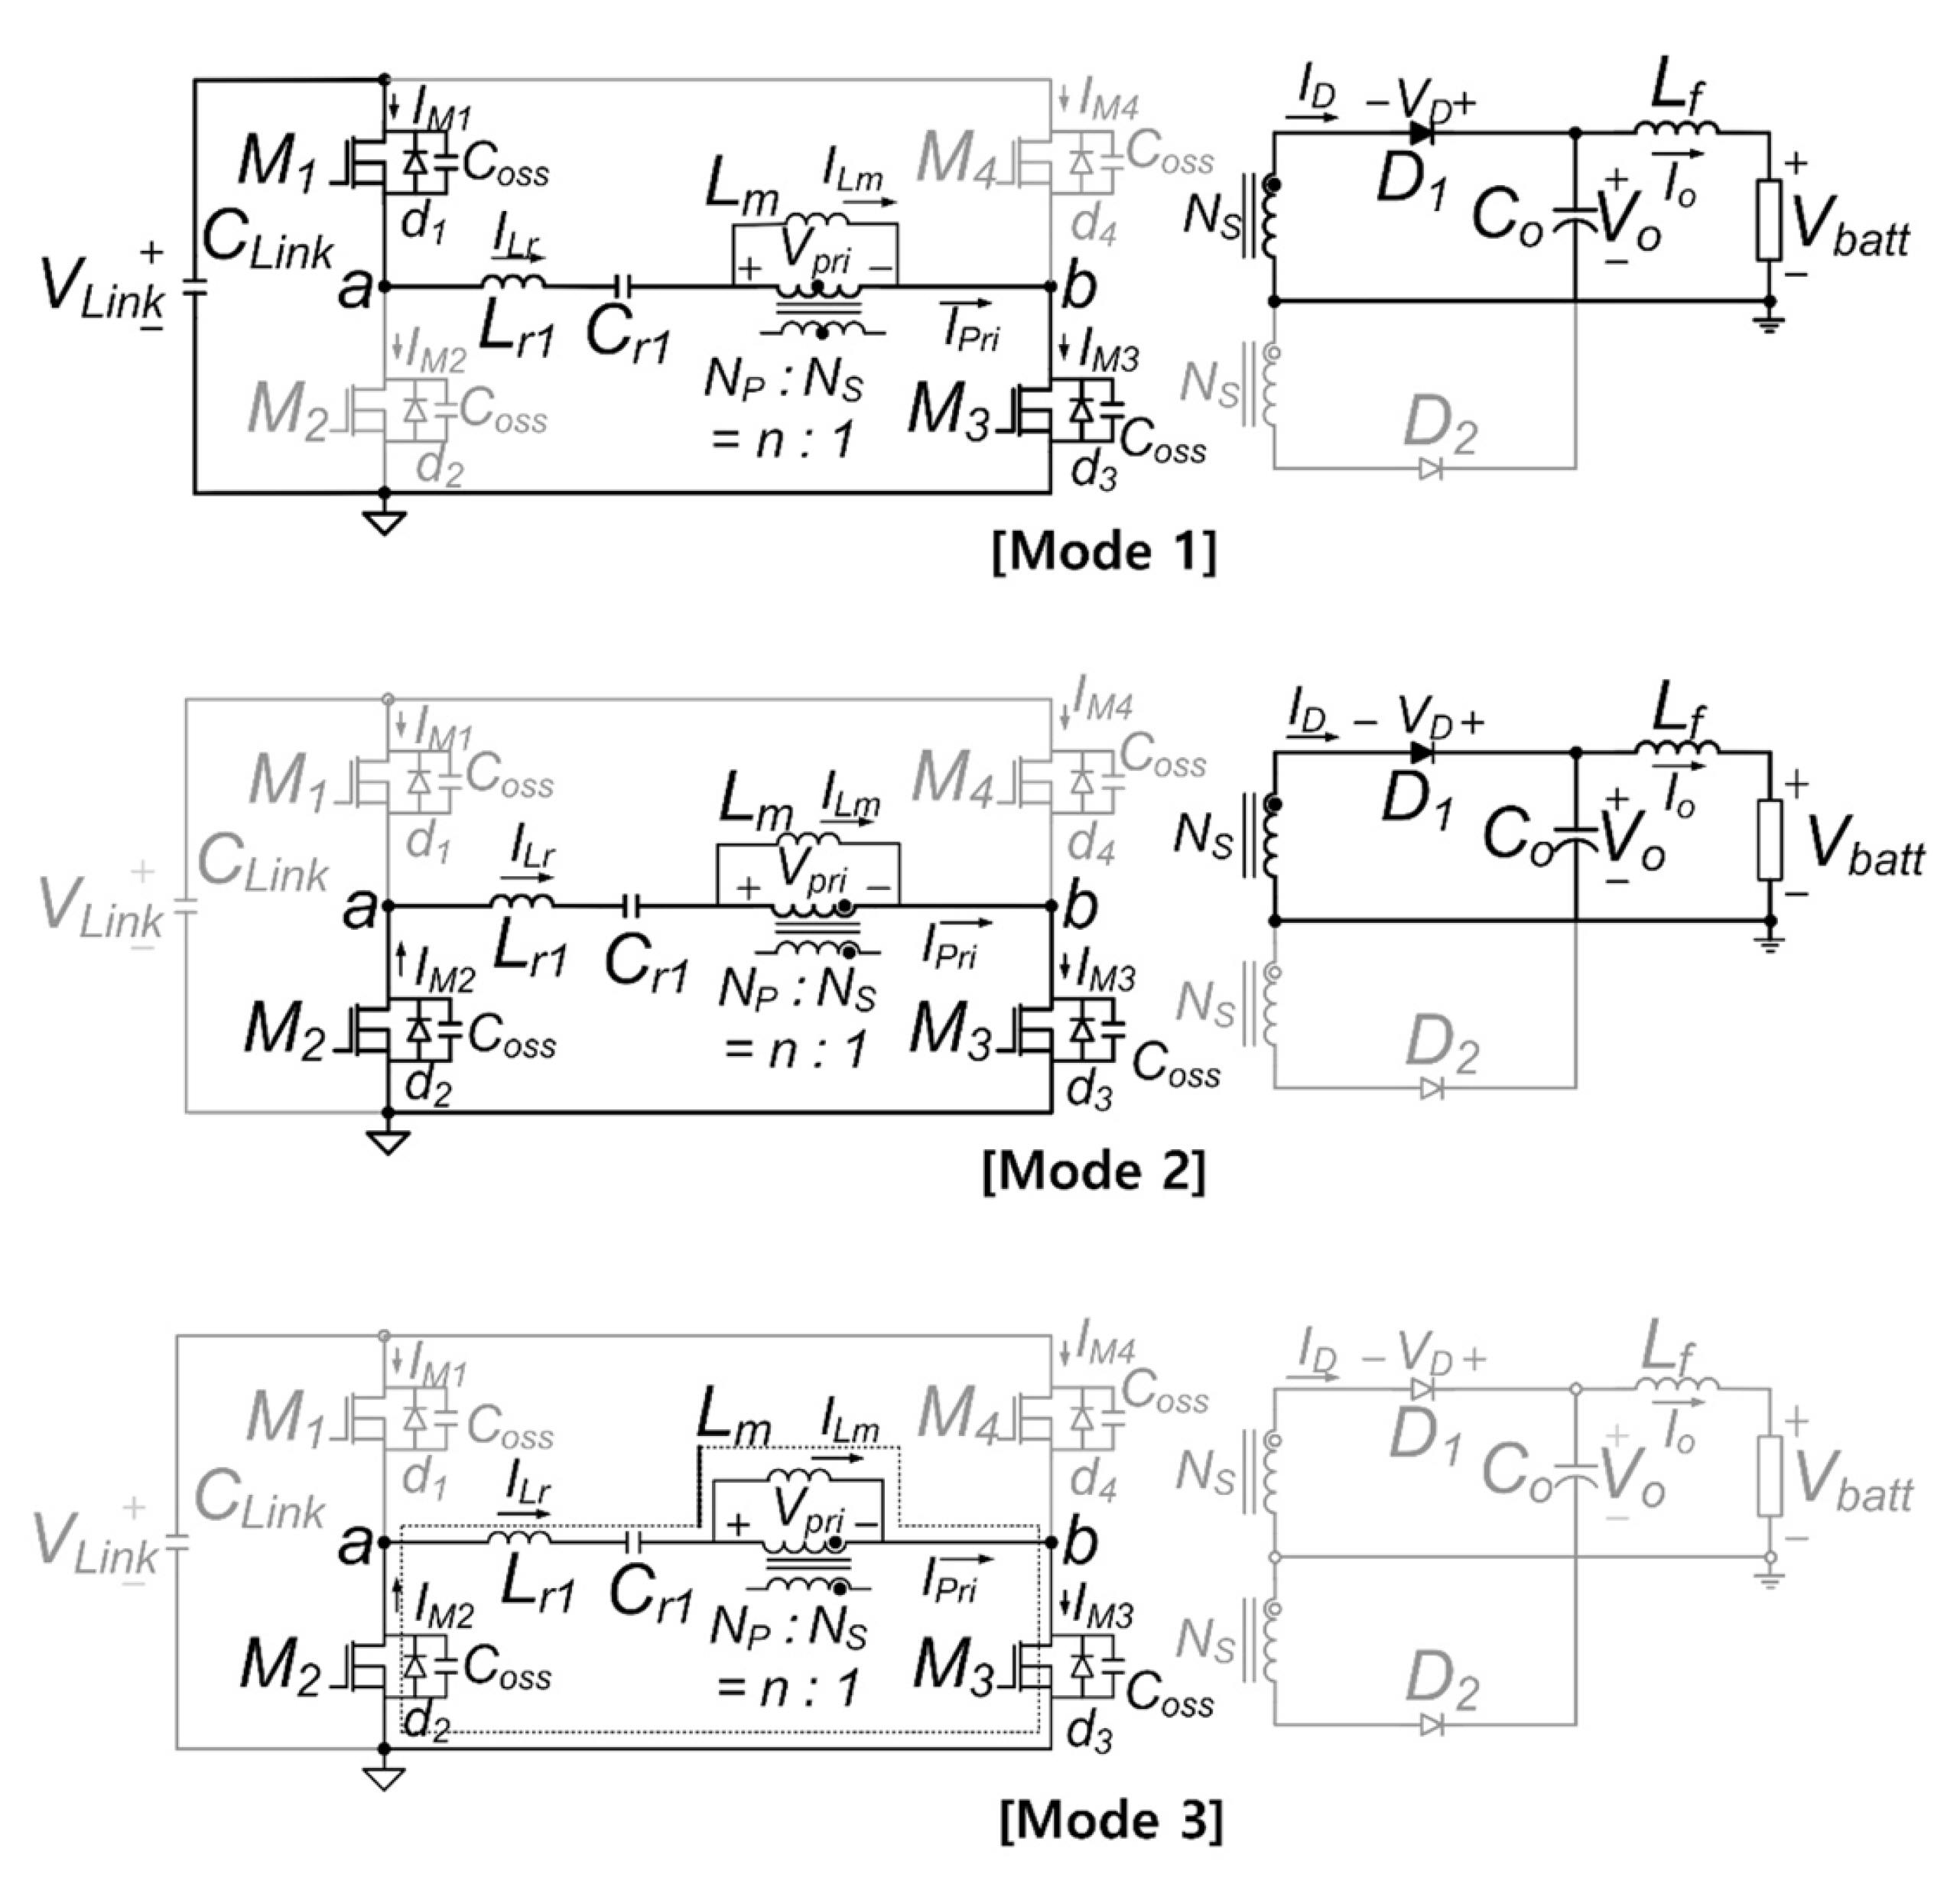
The proposed converter operation can be divided into two half cycles; cycle 1 spans t0 to t3, and cycle 2 covers t4 to t6. The operational principles of the two half cycles are symmetric. Hence, only the first half cycle is explained briefly. A half cycle can be divided into three modes. Fig. 13 presents the equivalent circuits for the operation modes. Mode analysis and the design procedure for the proposed converter have been reported previously [31].
4. Results and Discussion
A 6.6-kW prototype charger was implemented to verify the performance and feasibility of the proposed rapid-charging system. The prototype met several parameters: input voltage Vin = 400 ┬▒ 15 V; output voltage Vbatt in the range of 30-60 V; maximum output current Ibatt = 120 A; and switching frequency of 50 kHz. Switching devices M1 through M4 were metal-oxide-semiconductor field-effect transistors with specifications Vds = 600 V and Rds = 21m╬®, and devices D1 and D2 were fast-recovery diodes with specifications VKA = 600 V and Von = 1.28V.
Fig. 14 shows photographs of the implemented prototype charger comprising the PWM PRT converter and the bridgeless PFC converter. Fig. 15 presents the experimental waveforms measured with Vbatt = 54V and Po at 3.3 and 6.6 kW. The switching waveforms were consistent with the results of the theoretical analysis. The prototype design specifications guaranteed proper operation in the presence of battery voltage variations. Fig. 16 shows the switching waveforms measured at Vbatt = 54 V to illustrate ZVS operation and to demonstrate that ZVS operation can be completed with the output power at 6.6 kW.
Fig.┬Ā14.
Implemented 6.6 kW charger prototype: (a) bridgeless PFC converter and (b) PWM PRT converter.

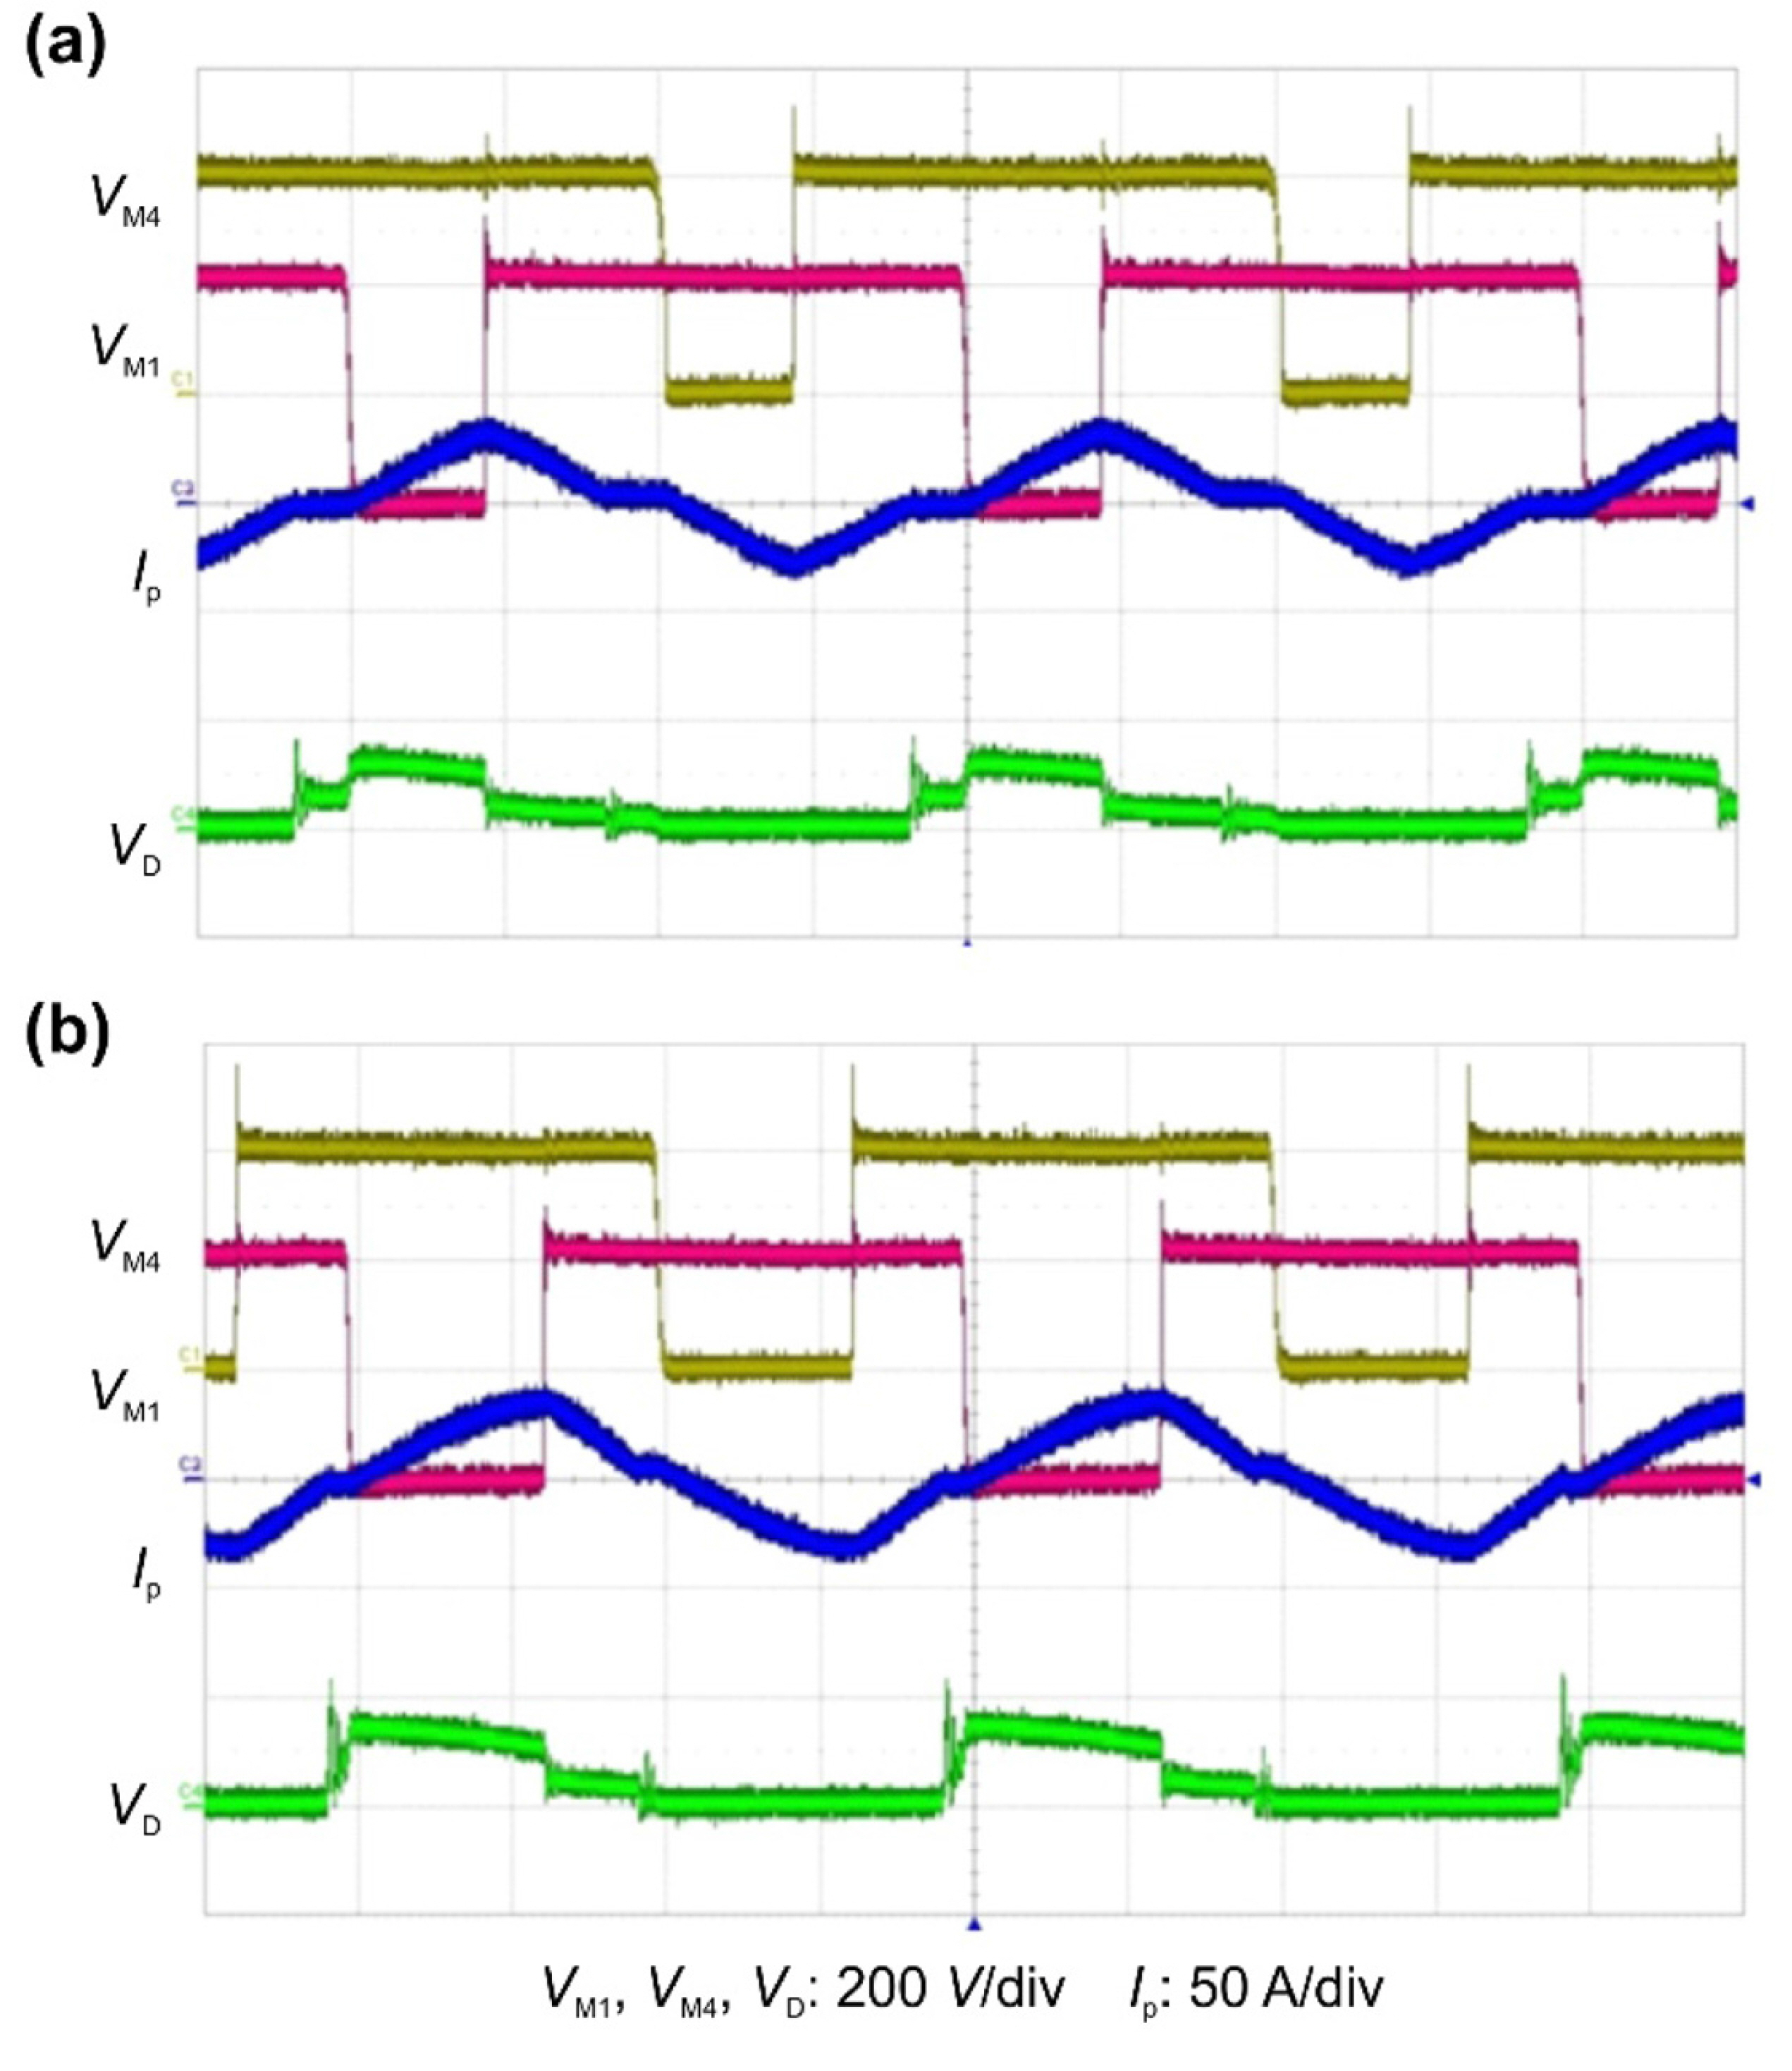
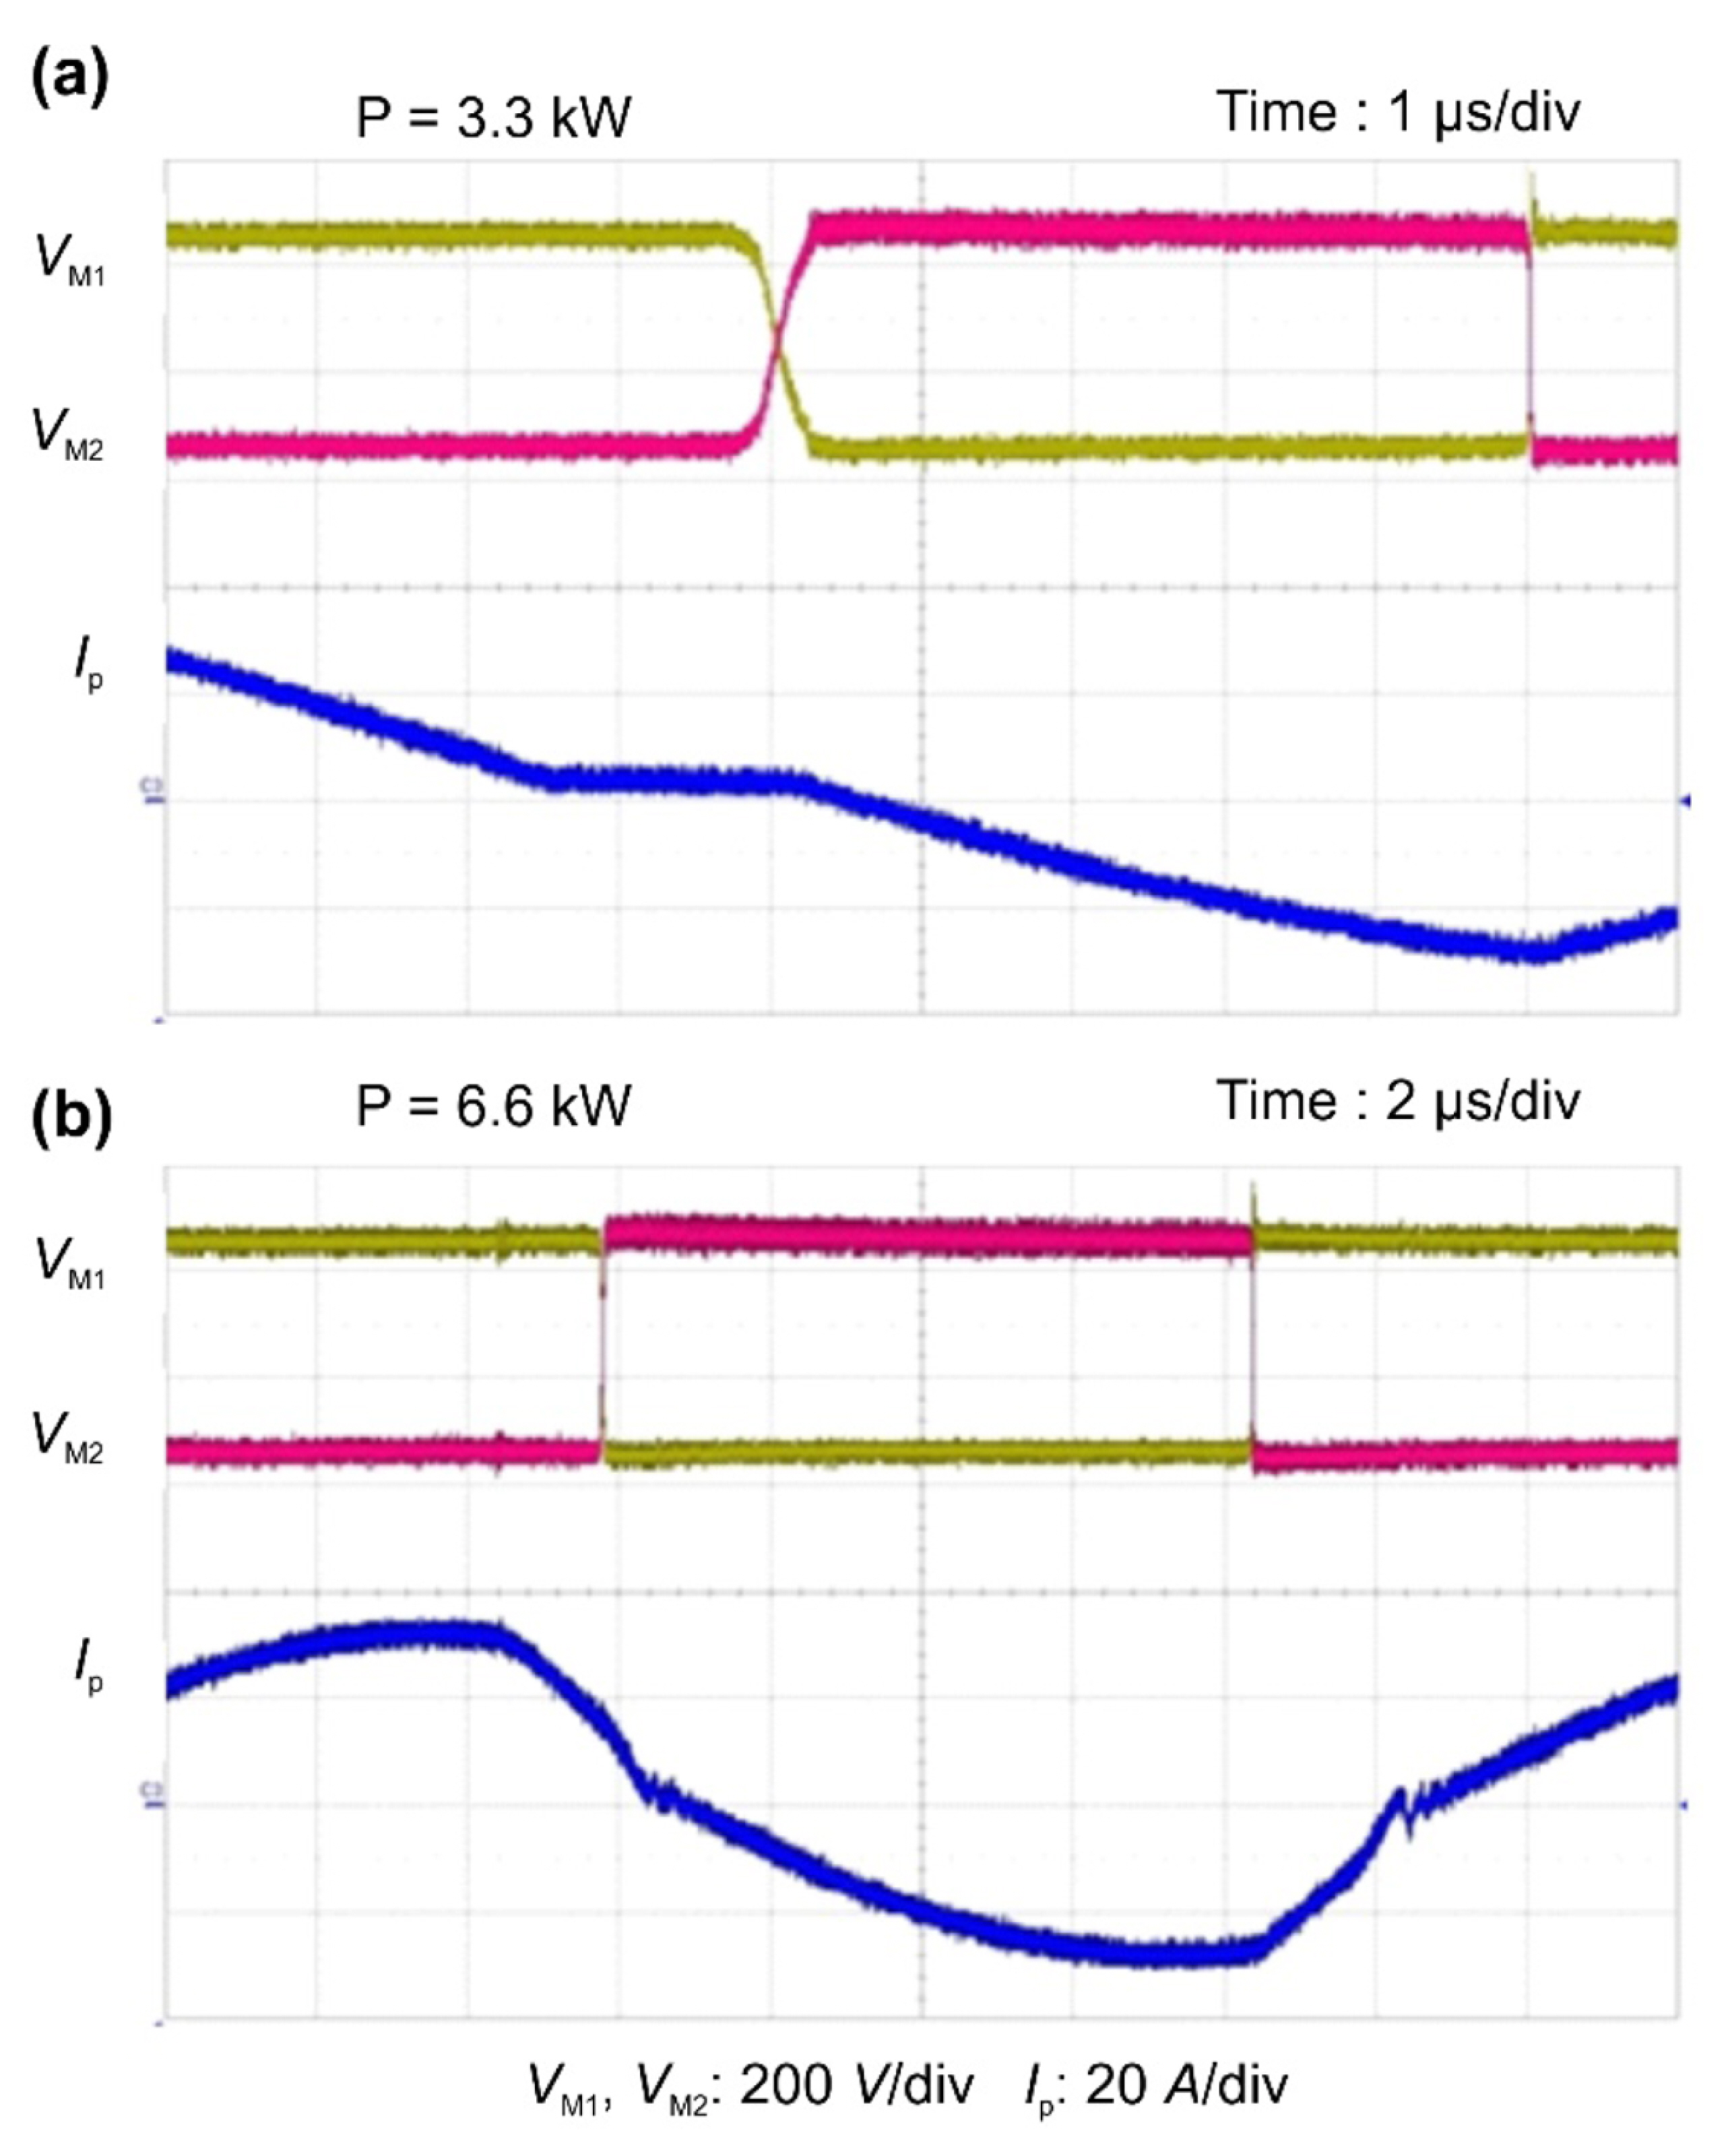
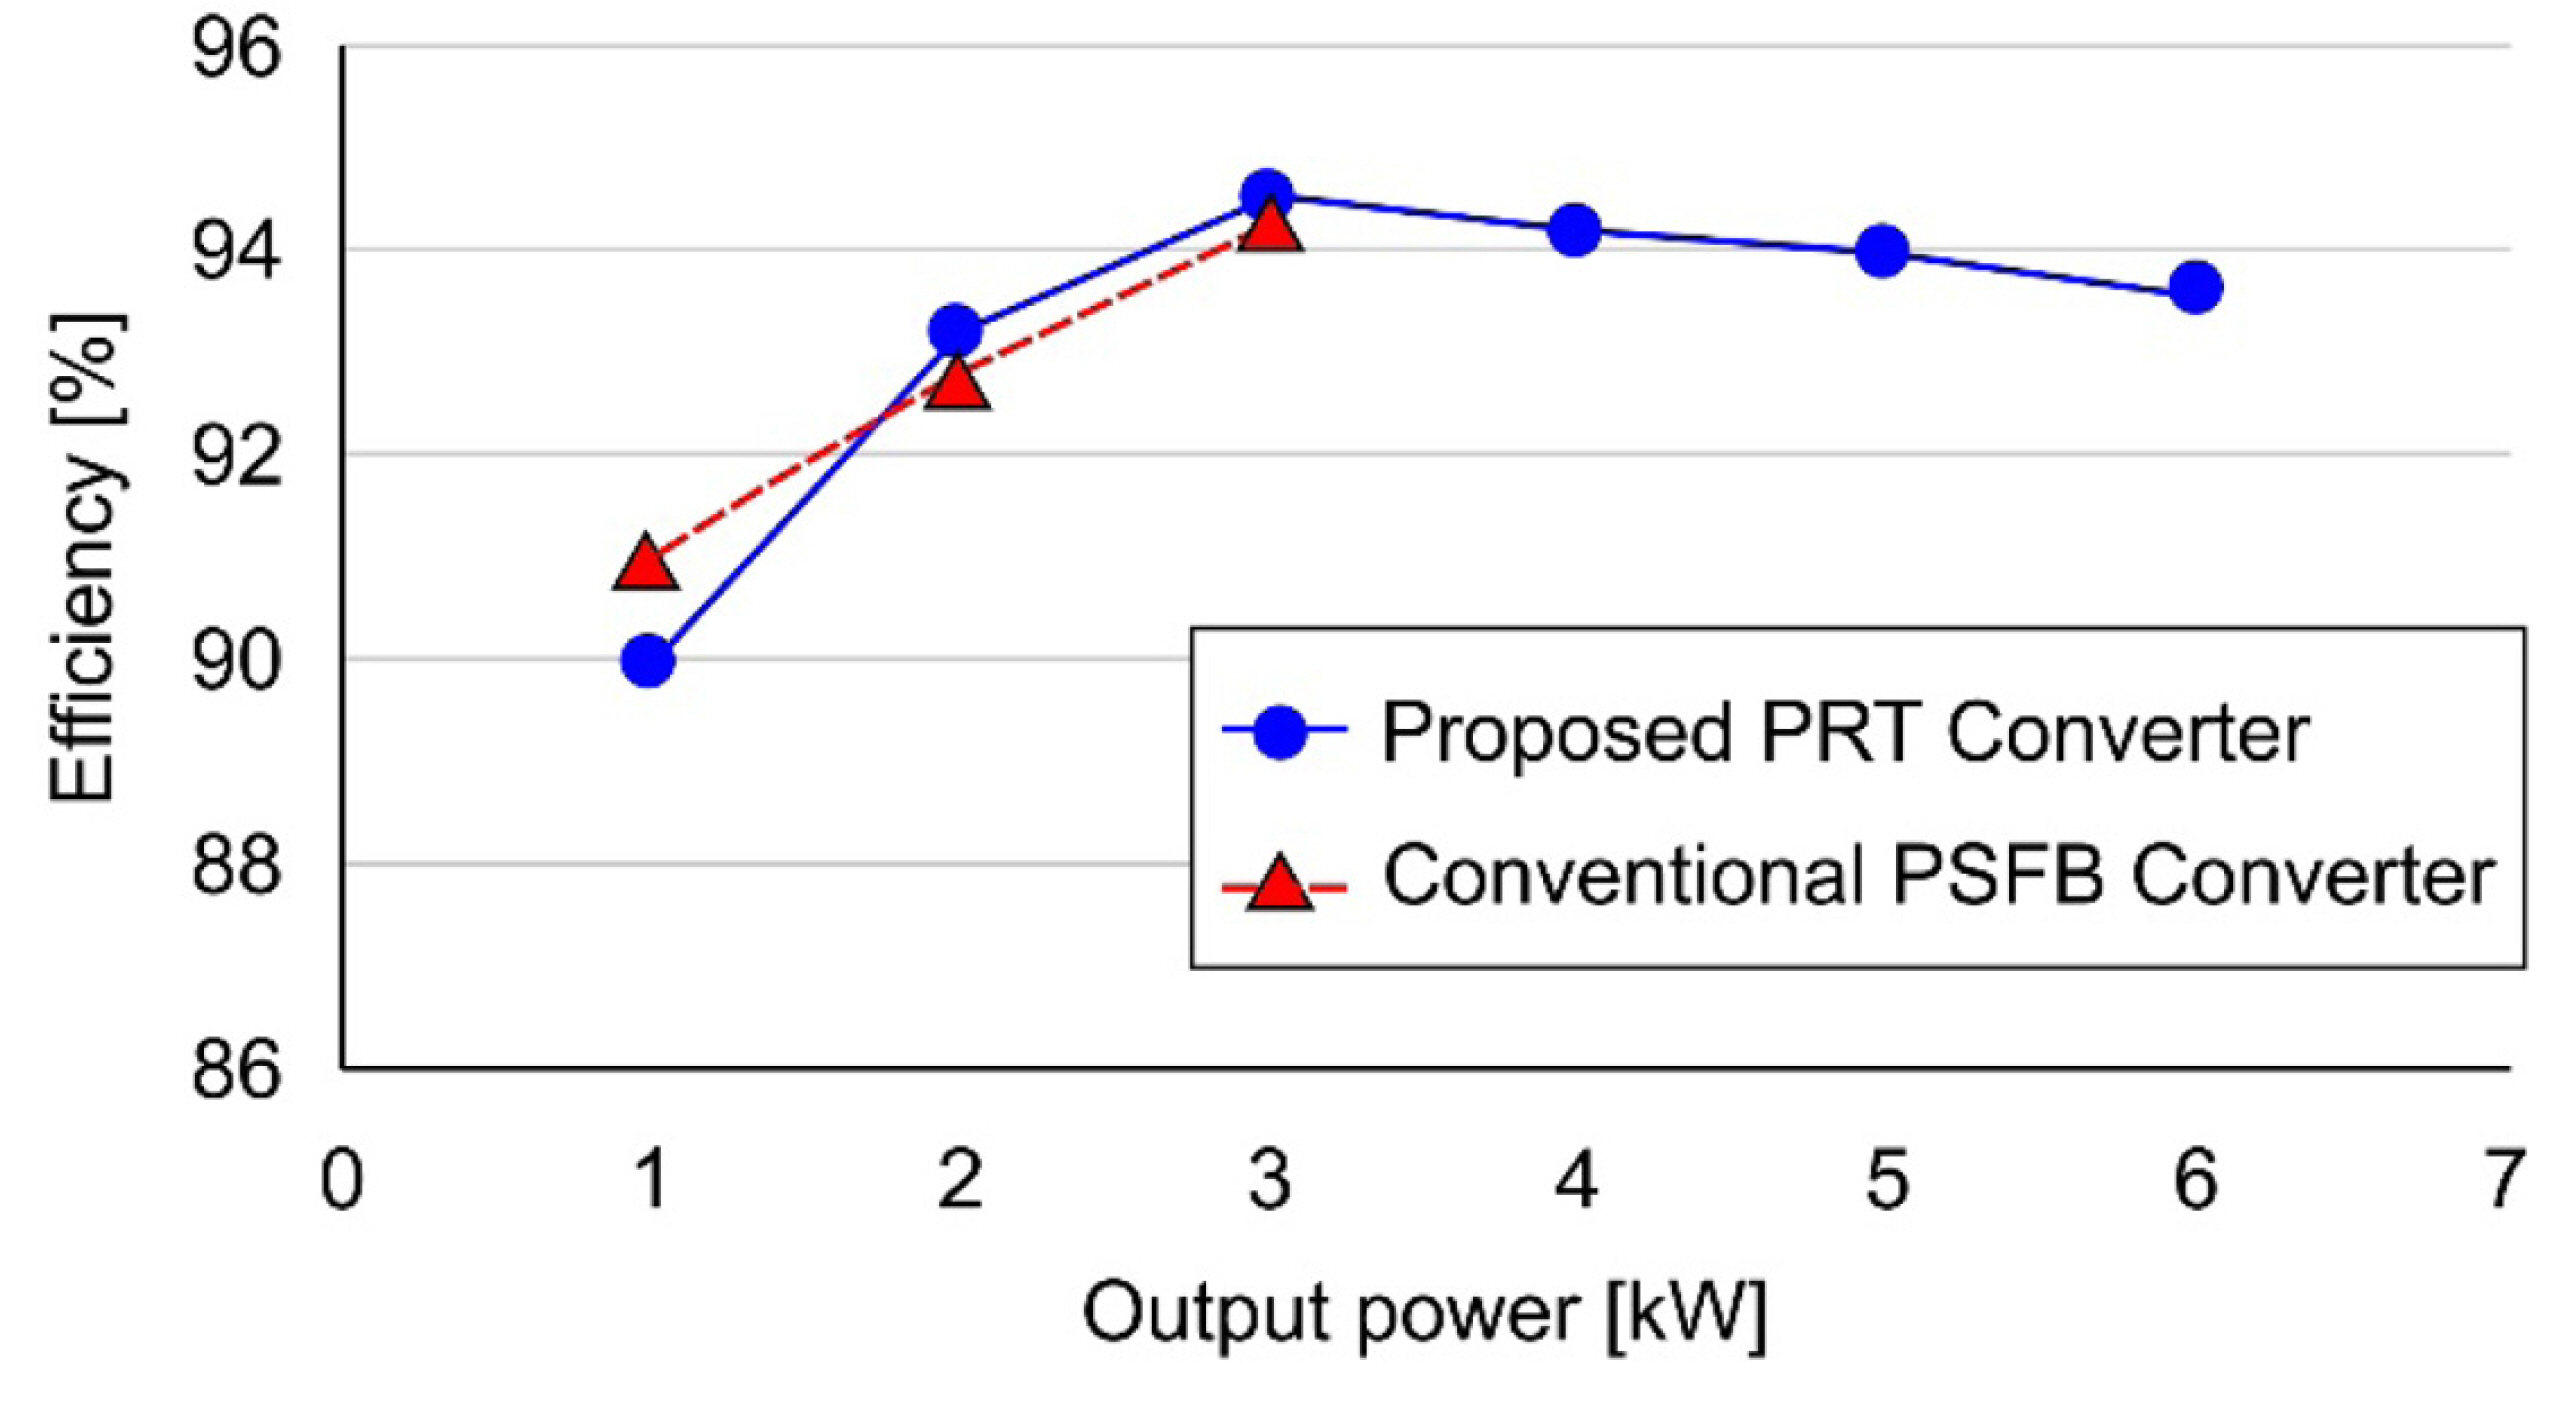
Fig. 17 illustrates the measured efficiency of the proposed PRT converter and a conventional PSFB converter. The maximum efficiency of the PRT converter was 94.5%, which is higher than the maximum efficiency of the conventional PSFB converter [32]. An efficiency of 93.6% was achieved at 56 V and 6.6 kW, and the maximum efficiency of 94.5% was achieved at 56 V and 3.3 kW.
An electric forklift LIB pack was used to validate the developed battery-charging algorithms. Fig. 18 shows the LIB pack, and Table 1 lists its specifications.
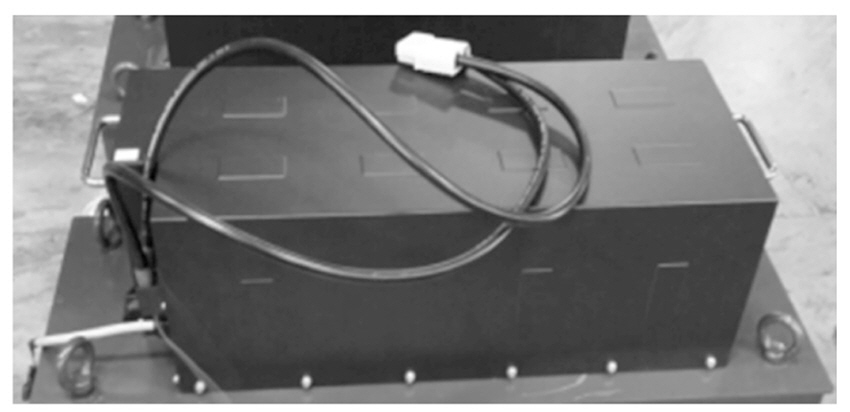
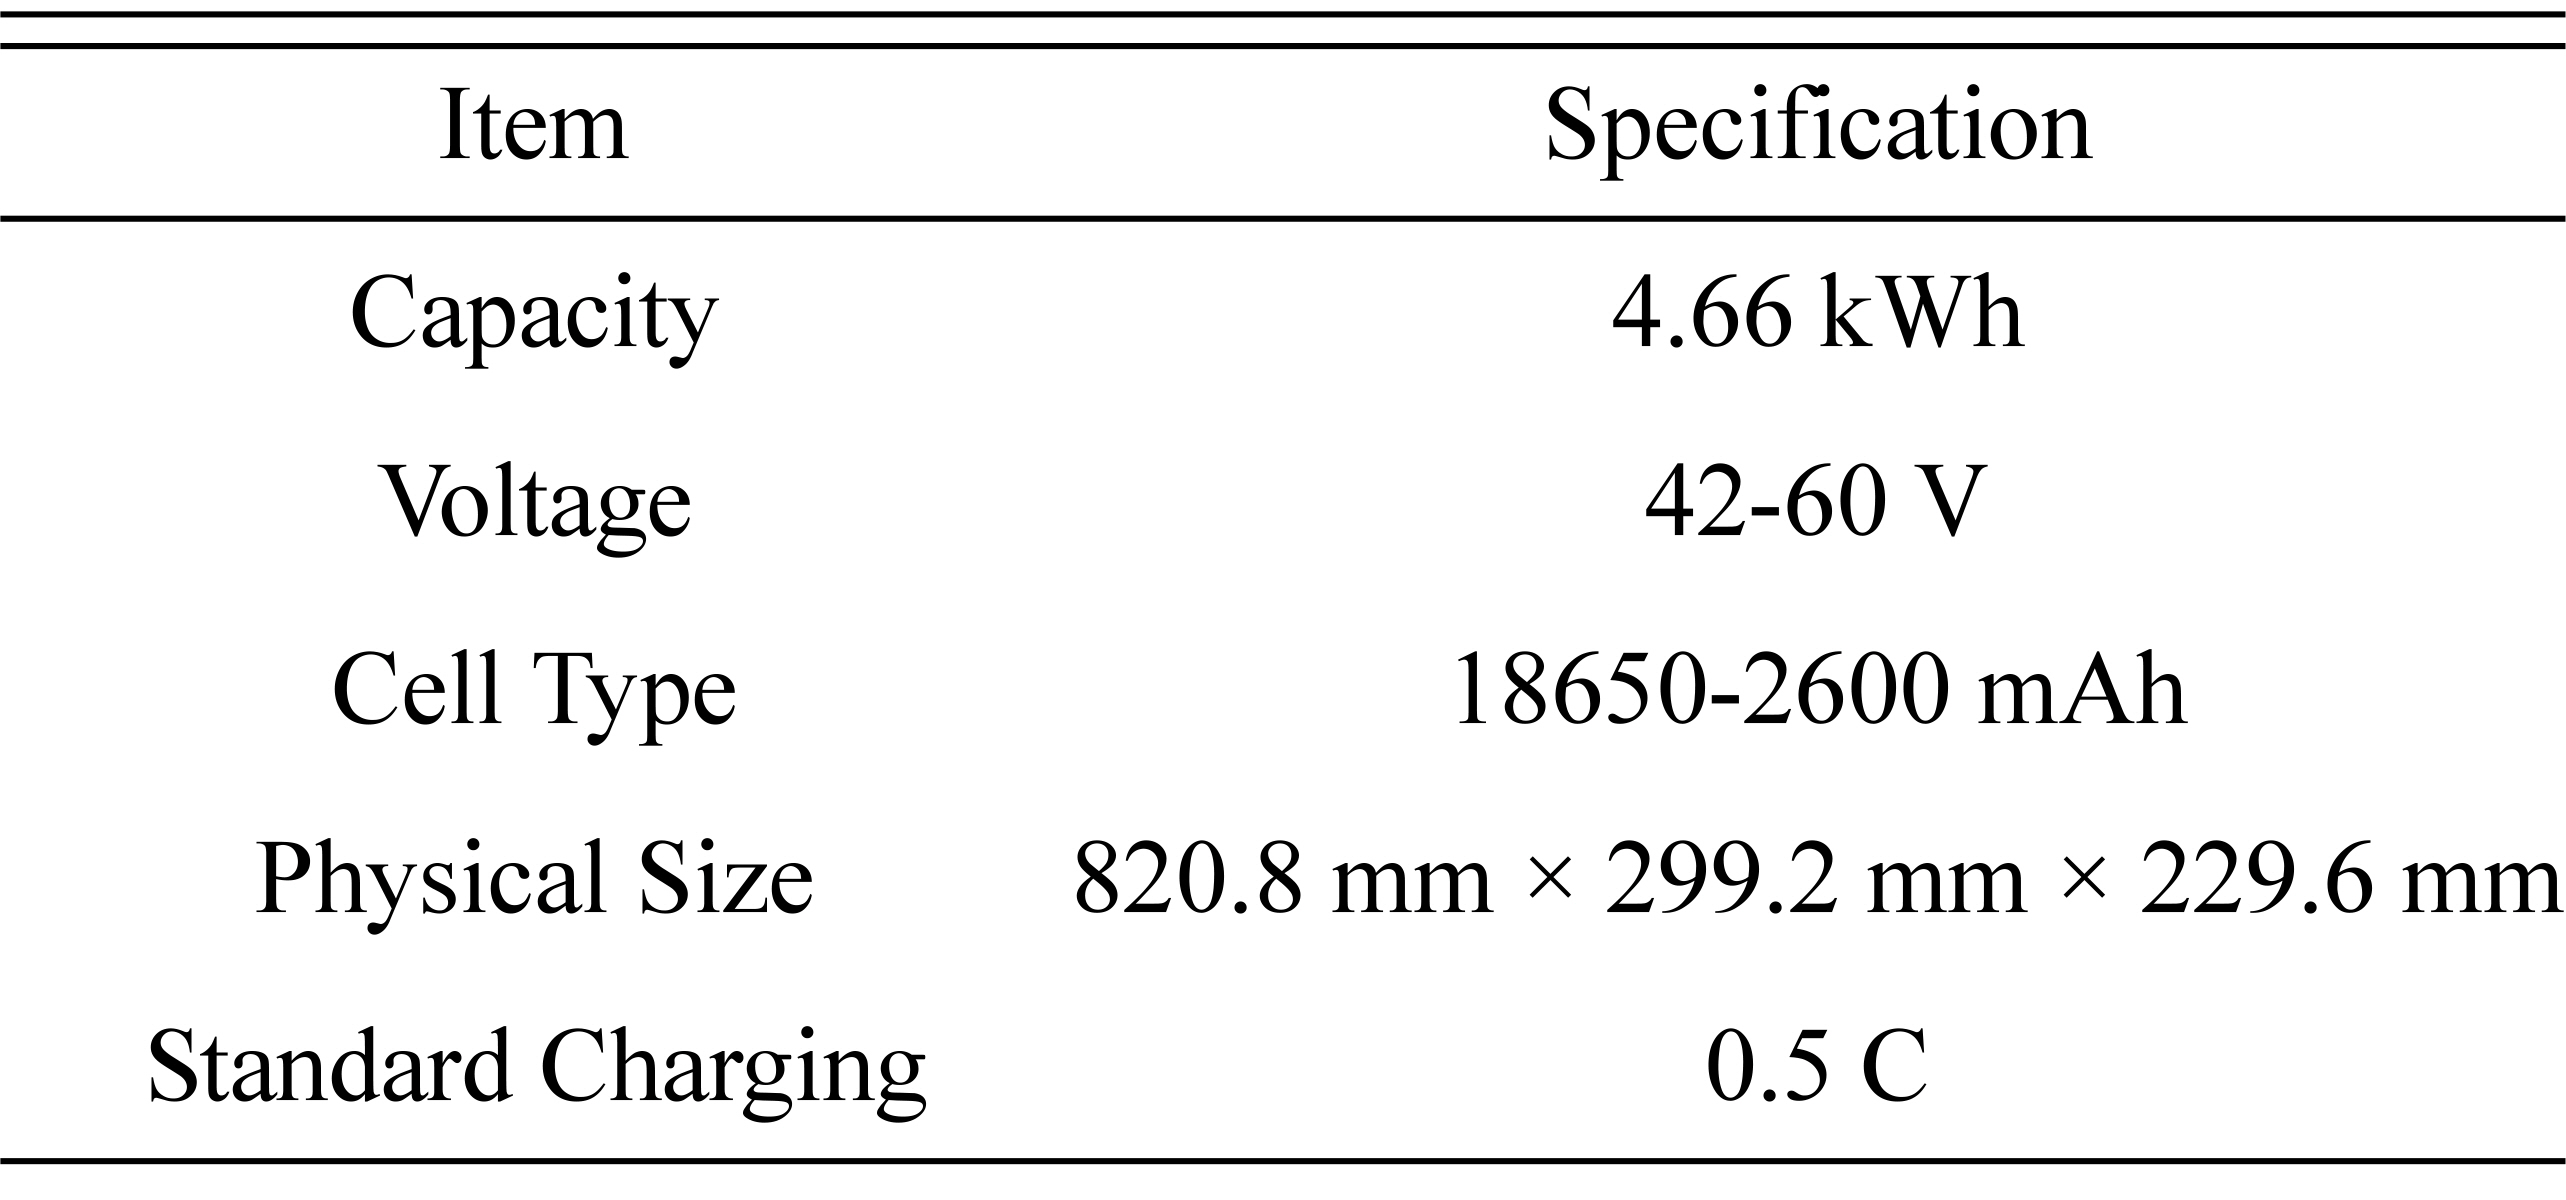
The battery pack was composed of 14S40P cylindrical cells (ICR18650-26F, Samsung). The battery specifications guaranteed a 0.5 C maximum charging current and a 500-cycle lifetime. The required charging time employing the standard CCCV charging method was 3 h from 0% to 100% SOC. Users of these batteries had expressed dissatisfaction with this charging time. An SOC estimation method using the discharge capacity based on the current integration method was used. When the initial SOC is set to an arbitrary value, the accumulation information of the discharge or charge current with respect to the discharge capacity is compared, and the result is added to the initial SOC after defining it as the amount of SOC change (ΔSOC).
Fig. 19 depicts the rapid-step charging algorithm, developed for the new charging method, which controls the charge current based on the battery voltage state during charging. The charge current is controlled by determining the maximum charge C-rate at which Li plating does not occur. This C-rate depends on the battery SOC state described above. A rapid-charge pattern consisting of five steps requires 30 and 60 min to reach 50% SOC and 80% SOC, respectively.
Fig.┬Ā19.
Proposed rapid-step charging algorithm at 25 Ōäā and test results for a 5 kWh battery pack.

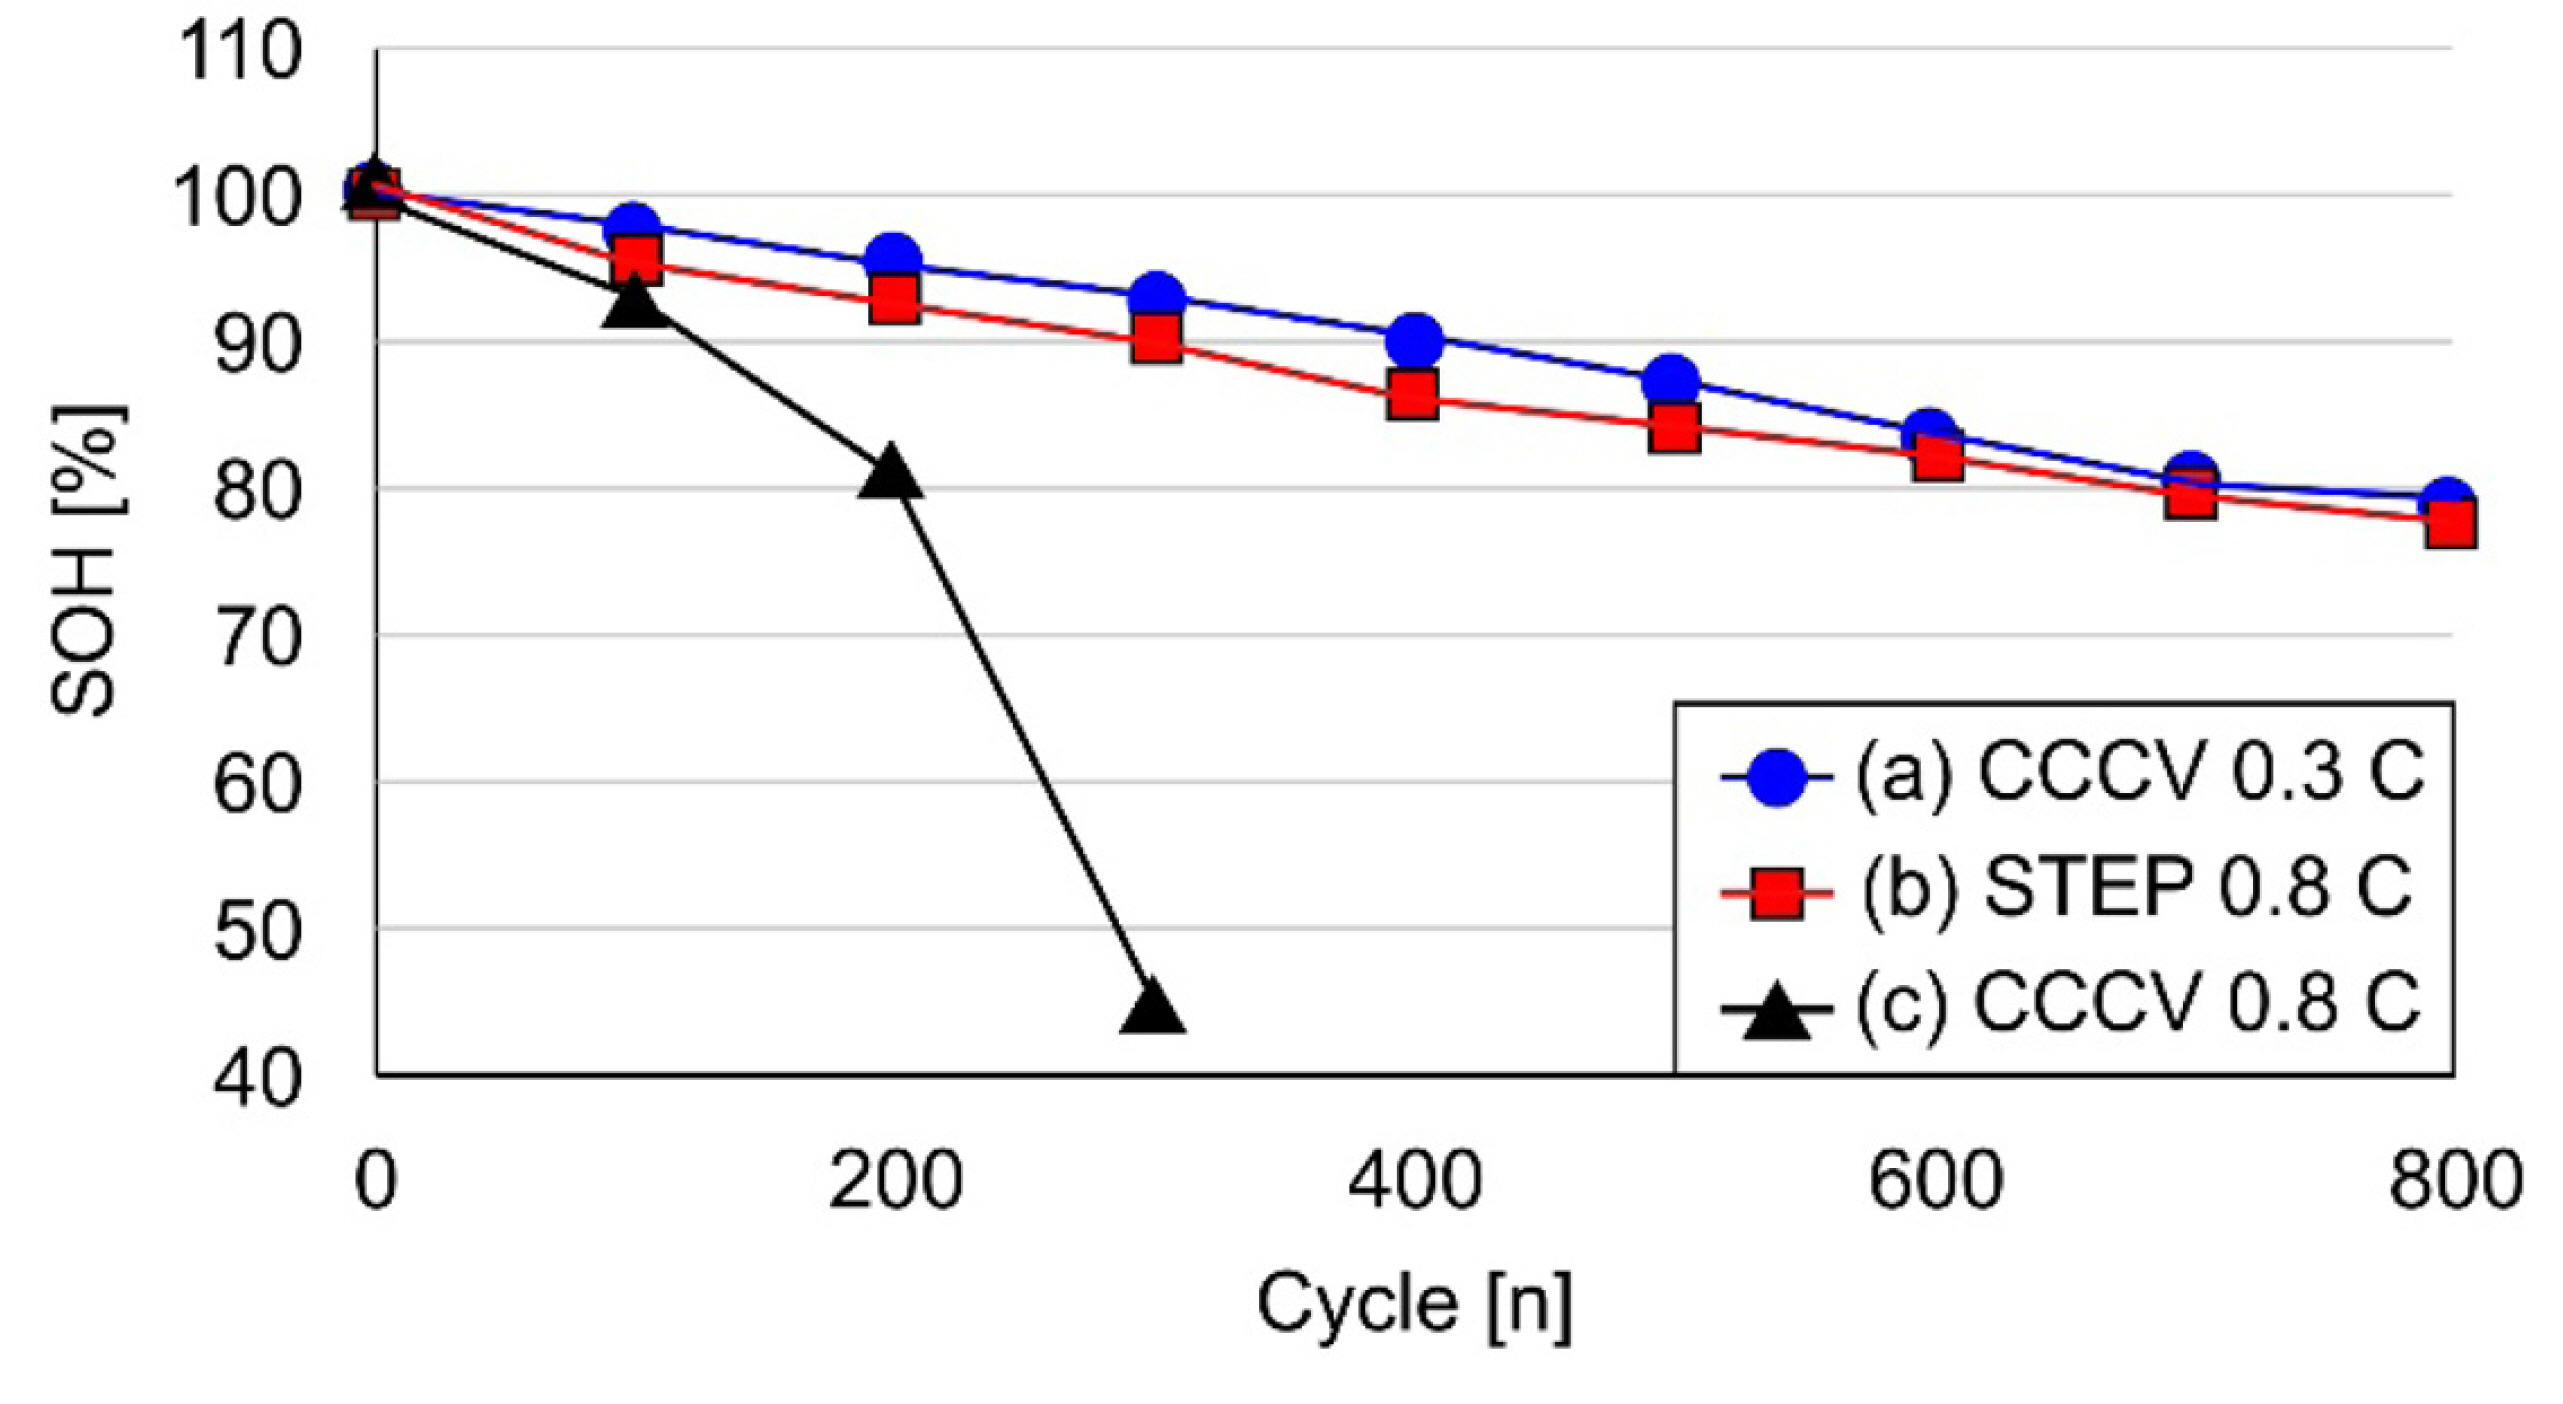
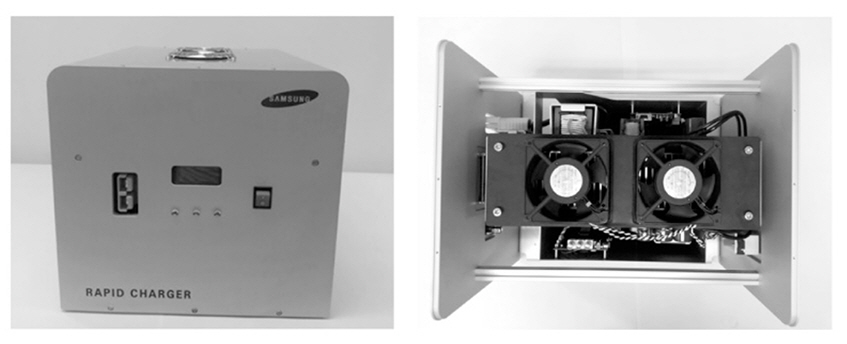
Fig. 20 depicts the results of a life evaluation based on a 0.3 C standard charge, 0.8 C CCCV charge, and the proposed rapid-step charging algorithm. The life evaluation results showed that the life of the 0.8 C CCCV charge was less than SOH 80% when the test was halted after 200 cycles. The 0.3 C CCCV and the new charging method showed similar life cycle results after 500 cycles. Fig. 21 shows the prototype of the 6.6 kW rapid charger and cooling system.
5. Conclusions
There is increasing interest in fast-charging battery systems. In this paper, we have proposed a converter that offers the advantages of conventional resonant converters but without the disadvantages attributed to PWM operations. The proposed converter uses ZVS operation in all switching devices. A 6.6-kW prototype charger, implemented to verify the performance of this design, had a maximum efficiency of 94.5%, which is higher than the maximum efficiency of a conventional PSFB converter. An efficiency of 93.6% was achieved at 56 V and 6.6 kW, and the maximum efficiency of 94.5% occurred at 56 V and 3.3 kW. Therefore, the proposed design proved suitable for the DC/DC stage in high-efficiency single-phase chargers. An analysis of the battery-degradation mechanisms showed that the set of conditions under which Li plating occurred were the primary cause of deterioration. This conclusion was derived from the electrochemical model. A life evaluation was performed by deriving a new charging profile, which did not cause Li plating, based on the SOC section of a 5 kWh forklift battery pack. The newly proposed charging method had a confirmed degradation rate similar to the standard 0.3 C charging condition. The new algorithm supports rapid battery charging without changes to the cell design. The new algorithm also exhibits a charging speed to 80% SOC at 25Ōäā, which is more than twice the rate achieved by existing algorithms. Thus, the proposed method demonstrates reduced required charge times and may be suitable for use in rapid-charging systems in low-voltage forklifts.
Nomenclature
Symbol
QuantityŌĆēŌĆēŌĆēŌĆēŌĆēŌĆēŌĆēUnits
jLi
Volumetric intercalation reaction rateŌĆēŌĆēŌĆēŌĆēŌĆēŌĆēŌĆēC/m3/s
i0
Intercalation reaction current densityŌĆēŌĆēŌĆēŌĆēŌĆēŌĆēŌĆēC/m2/s
F
Faraday constantŌĆēŌĆēŌĆēŌĆēŌĆēŌĆēŌĆēC/mol
Se
Specific surface areaŌĆēŌĆēŌĆēŌĆēŌĆēŌĆēŌĆē1/m
╬▒
Convection coefficient on the cell surfaceŌĆēŌĆēŌĆēŌĆēŌĆēŌĆēŌĆēW/m2/K
╬Ę
Overpotential (intercalation)ŌĆēŌĆēŌĆēŌĆēŌĆēŌĆēŌĆēV
R
Gas constantŌĆēŌĆēŌĆēŌĆēŌĆēŌĆēŌĆēJ/mol/K
keff
Effective conductivity of the electrolyteŌĆēŌĆēŌĆēŌĆēŌĆēŌĆēŌĆēS/m
cs
Li-ion concentration in solid particlesŌĆēŌĆēŌĆēŌĆēŌĆēŌĆēŌĆēmol/m3
ce
Li-ion concentration in the electrolyteŌĆēŌĆēŌĆēŌĆēŌĆēŌĆēŌĆēmol/m3
╬Ąe
PorosityŌĆēŌĆēŌĆēŌĆēŌĆēŌĆēŌĆēŌĆö
r
Radius (of solid spherical particles)ŌĆēŌĆēŌĆēŌĆēŌĆēŌĆēŌĆēm
Ds
Diffusion coefficient in the solid phaseŌĆēŌĆēŌĆēŌĆēŌĆēŌĆēŌĆēm2/s
De
Effective diffusion coefficient in the electrolyteŌĆēŌĆēŌĆēŌĆēŌĆēŌĆēŌĆēm2/s
Žāeff
Conductivity of the solid phaseŌĆēŌĆēŌĆēŌĆēŌĆēŌĆēŌĆēS/m
T
TemperatureŌĆēŌĆēŌĆēŌĆēŌĆēŌĆēŌĆēK
Žås
Potential in the solid phaseŌĆēŌĆēŌĆēŌĆēŌĆēŌĆēŌĆēV
Žåe
Potential in the electrolyteŌĆēŌĆēŌĆēŌĆēŌĆēŌĆēŌĆēV


