Electrochemical Impedance Characteristics of a Low-Temperature Single Cell for CO2/H2O Co-Reduction to Produce Syngas (CO+H2)
Article information
Abstract
In this study, the electrochemical impedance characteristics of CO2/H2O co-reduction to produce CO/H2 syngas were investigated in a low-temperature single cell. The effect of the operating conditions on the single-cell performance was evaluated at different feed concentrations and cell voltages, and the corresponding electrochemical impedance spectroscopy (EIS) data were collected and analyzed. The Nyquist plots exhibited two semicircles with separated characteristic frequencies of approximately 1 kHz and tens of Hz. The high-frequency semicircles, which depend only on the catholyte concentration, could be correlated to the charge transfer processes in competitive CO2 reduction and hydrogen evolution reactions at the cathodes. The EIS characteristics of the CO2/H2O co-reduction single cell could be explained by the equivalent circuit suggested in this study. In this circuit, the cathodic mass transfer and anodic charge transfer processes are collectively represented by a parallel combination of resistance and a constant phase element to show low-frequency semicircles. Through nonlinear fitting using the equivalent circuit, the parameters for each electrochemical element, such as polarization resistances for high- and low-frequency processes, could be quantified as functions of feed concentration and cell voltage.
1. Introduction
Considering the ongoing global warming issue, it is fundamental to reduce atmospheric emissions of greenhouse gases. Among them, CO2 accounts for the largest amount of greenhouse gas emissions and has the greatest effect on global warming [1–4]. Carbon dioxide capture and sequestration (CCS) has been proposed as an emergency measure to reduce CO2 emissions into the atmosphere and mitigate climate change [5,6]. However, mere sequestration is not a viable solution because of the high-volume storage requirement and high cost. Consequently, research interest has shifted toward the concept of carbon capture utilization and storage (CCUS). Among the various CCUS technologies, low-temperature CO2 reduction with polymer electrolyte membranes (PEM) has attracted significant attention as an alternative green route to produce carbon monoxide, formate, methane, or other C2 products. An additional relevant product of the electrolysis of CO2 is syngas (that is, CO + H2), which can be obtained by the co-reduction of CO2 with H2O. Syngas is an important reactant in the Fisher–Tropsch process to produce valuable hydrocarbons such as ethanol (H2/CO ≤ 1) or methanol (H2/CO = 2) [7]. Syngas production via CO2 and H2O co-electrolysis provides a more sustainable route and reduces the consumption of biogas/methane that can be redirected to other scopes.
Electrochemical co-reduction of CO2 and H2O in PEM single cells for the production of syngas (CO+H2) occurs through the following reaction chain (1–3). On the cathode side, reaction 1 represents CO2 reduction to form CO (CO2RR), while reaction 2 represents the hydrogen evolution reaction (HER). These two reactions compete with each other, and the selectivity to one with respect to the other is influenced by the catalyst materials used, operating voltages, composition, pH, and concentration of the electrolyte. Water oxidation occurs at the anode side (reaction 3) [8].
Previous studies on electrochemical CO2 reduction were mainly focused on the development of catalyst materials, in which half-cell tests were mostly utilized. For example, Cu/In2O3 core/shell nanoparticles [9], Co and Ni single-atom catalysts [10], transition metal nitrides [11], and polyethylenimine-coordinated Au/C nanoparticles [12] have been investigated for syngas production (CO2/H2O coelectrolysis). Moreover, Au [13–20], Ag [21,22], and Zn [23,24] have been studied for CO2/CO conversion, and Cu [25] has been studied for light hydrocarbons. However, for CO2 reduction technologies, including CO2/H2O co-reduction, further research on single cells and systems is required. Previously, analyses on the electrolyte pH effect in buffer-layer-type cells [8,26,27], mass transport studies on filter-press-type flow cells [28,29], and the operating conditions of membraneless cell systems [30–34] have been reported.
The materials and systems for CO2 electrochemical reduction are mainly evaluated by measuring the electrochemical performance using polarization tests [9,15,18,21,22,25,27] and chronoamperometry [9–16, 18–25,27,35]. On the other hand, the composition of electrolysis products is generally analyzed using gas chromatography (GC) [8–16,18–36] and liquid chromatography (LC) [36]. In addition, the morphological and compositional properties of the catalyst materials are analyzed using ex-situ techniques such as scanning electron microscopy (SEM) [13,18,19,21–24], transmission electron microscopy (TEM) [9,10,12–16,18–22], X-ray diffraction (XRD) [9–13,18,20,22–24], X-ray photoelectron spectroscopy (XPS) [19,20,23], and Raman spectroscopy [35]. Furthermore, advanced electrochemical and in situ techniques that can provide information on the electrochemical reaction mechanism, cell component characteristics, and discrete reaction processes during cell operations are required to develop CO2 reduction technology with higher efficiency and reliability. Electrochemical impedance spectroscopy (EIS) [27,37–43], cyclic voltammetry [9,18,21], and linear sweep voltammetry [9,15,21,25,27] are the most applied techniques for analyzing electrochemical processes. Furthermore, EIS can be used to identify the electrochemical reaction processes and mechanisms occurring in a cell by analyzing the frequency response to a sinusoidal signal. It provides information on the resistances to the microscopic processes, such as charge transfer, mass transport of the involved species, or reactant absorption processes, and the frequencies at which they occur. As a result, we can distinguish between these processes through proper analysis of the collected spectra [44]. The EIS technique has been utilized in some of the previous studies on electrochemical CCUS mostly for half-cell systems to produce CO [34,37–39] and formate [40–43]. In situ infrared spectroscopy and in situ X-ray absorption spectroscopy [45] have been performed to monitor the changes in the chemical bonding of the catalyst to enhance the performance of CO2 reduction devices. Furthermore, in situ differential electrochemical mass spectrometry [46] has been performed to detect trace products in the electrochemical CO2 reduction reaction.
At this point of research, analyzing a single electrode using EIS is not sufficient because the sum of the combined mechanism of the single electrodes is not directly comparable to that of a complete single cell. This is a crucial step in approaching a possible level of commercialization. Therefore, in this work, we present the first EIS analysis based on a complete PEM single-cell system for syngas production through CO2 and water co-reduction, thus extending the scope of our investigation to consider both the anode and cathode. Impedance spectra were collected while analyzing the effect of electrolyte concentration. Based on the experimental data and impedance results, we interpret and discuss the resistance phenomena to set up an equivalent circuit to simulate the impedance behavior. Finally, the fitting of the experimental data is presented.
2. Experimental
2.1 Fabrication of membrane electrode assembly
To construct a membrane electrode assembly (MEA), NRE-212 (Dupont Inc., Wilmington, Delaware, USA, H+ form, thickness = 50.8 μm) was used as the polymer electrolyte membrane. Iridium (IV) oxide (Alfa Aesar Inc., Haverhill, Massachusetts, USA, IrO2, 99.99%) was sprayed on the anode porous transport layer (PTL) (Bekaert Inc., Zweyegem, Belgium, Ti-paper250) to make the anode electrode. Similarly, the cathode electrode was fabricated by applying a Ag black catalyst (Sigma-Aldrich, St. Louis, MO, USA) on the cathode PTL (Toray Industries Inc., Tokyo, Japan, TGP-H-090, with 5 wt.% PTFE). The cell active area was 9 cm2, while the catalyst loading was controlled at 1 mg/cm2 on both anodes and cathodes. The catalyst inks were prepared by mixing isopropyl alcohol with a Nafion dispersion (Sigma-Aldrich, 5wt%) under sonication for 30 min. Then, the MEA was assembled by stacking the anode electrode, the PEM, and the cathode electrode, without hot press. Here, the anode catalyst layer of iridium oxides is contacting the PEM, but, in the case of cathode electrode, the PTL is in touch with the PEM to act as buffer layer [27].
2.2 Characterization of a CO2/H2O co-reduction single cell
A single cell was built by placing the MEA between the cathode and anode bipolar plates and assembling with a torque press of 80 lb·in. The single cell was characterized as shown in Fig. 1. As the anolyte, 0.5 M and 1.0 M KOH solutions were supplied to the single cell at a flow rate of 10 mL/min. These solutions were prepared using KOH flakes (Sigma-Aldrich, 90%) and ultrapure water. As the catholyte, 0.5 M and 1.0 M KHCO3 solutions were prepared by dissolving KHCO3 powder (Sigma-Aldrich, 99.7%) in ultrapure water and saturated by CO2 purging. The CO2-saturated catholyte and CO2 gas were then supplied separately to the cathode of the dual-channel cell at a feeding rate of 10 mL/min [47].

Schematic diagram of a CO2/H2O co-reduction system using a proton exchange membrane electrolysis single cell.
CO2/H2O co-reduction in the PEM-type single cell was performed by applying a voltage using a potentiostat (BioLogic, Seyssinet-Pariset, France, HCP-803). The electrochemical characterizations were performed at different cell voltages of 1.8, 2.2, 2.6, and 3.0 V, while the voltage was increased step-wise from 0.1 V with an interval of 0.1 V. Chronoamperometry was performed at each voltage for 30 min, and the EIS data were collected in the frequency range of 100 kHz to 50 mHz with a voltage amplitude of 10 mV. In this study, EIS spectra were collected in potentiostatic mode at various DC voltages from 1.8 to 3.0 V in order to analyze the effect of feed conditions with identical overpotentials. The composition of the cathode outlet gas was analyzed using GC (Agilent Technologies Inc., 7890B) with a thermal conductivity detector and a combined methanizer-flame ionization detector.
3. Results and Discussion
3.1 Effects of electrolyte concentration and voltage on the cell performance
Fig. 2 shows the single-cell performance at different concentrations of catholyte (KHCO3) and anolyte (KOH). A total of four cases were considered for performance evaluation: C05A05 (0.5 M catholyte and 0.5 M anolyte), C10A05 (1.0 M catholyte and 0.5 M anolyte), C05A10 (0.5 M catholyte and 1.0 M anolyte), and C10A10 (1.0 M catholyte and 1.0 M anolyte). For C05A05, the total current density, including currents from CO2 reduction and the HER, gradually increased up to 29.5 mA/cm2 at an operating voltage of 3.0 V (Fig. 2a). This trend, that is, an increase in total current density with increasing cell voltage, was maintained for each concentration. Furthermore, the increased catholyte or anolyte concentration resulted in a higher total current density; for example, the total current density of C10A10 was 2.1 times higher than that of C05A05 at 2.6 V.

(a) Total current density (jtot) and (b) CO partial current density (jCO) of the PEM CO2/H2O co-reduction single cell for various feed conditions at cell voltages of 1.8, 2.2, 2.6, and 3.0 V.
Fig. 2b shows the CO partial current density (jCO), which was converted from the CO production rate measured by GC, as a function of the anolyte and catholyte concentrations at different operating cell voltages. For every feed condition, jCO increased with the cell voltage up to 2.6 V; however, at 3.0 V, jCO was maintained or slightly decreased. Therefore, it can be inferred that the high total current at 3.0 V is dominated by the HER, and the syngas ratio depends on the operating voltage. For example, in the case of C05A10, the syngas ratio (H2/CO) changed with cell voltage as: 9.7 (1.8 V), 2.1 (2.2 V), 2.5 (2.6 V), and 4.1 (3.0 V). No additional products were detected both in gas and liquid outlets in this study. The effect of a higher feed concentration on CO2 reduction was significantly less intense compared to that of the total current, which also includes the current from the HER. This suggests that the feed concentration and cell voltage affect the CO2 reduction reaction and HER in different ways, resulting in complicated single-cell characteristics.
3.2 EIS measurement and graphical analysis
To analyze the electrochemical characteristics, EIS data were collected for every experimental condition, as described in the previous section. The Nyquist and Bode plots of the experimental impedance data were obtained for further analysis, and the selected plots are shown in Fig. 3. As shown in Figs. 3a and 3b, the experimental Nyquist plots of the CO2/H2O co-reduction single cell are composed of two depressed semicircles. This observation indicates that two or more electrochemical processes occurred in the analyzed electrochemical system. The simplest possible case would be two charge transfer processes in the cathode and anode, which are distinguishable in terms of the characteristic frequency (or RC, resistance and constant phase element, time constant). However, it is also possible that two or more process happen simultaneously or with very similar time constant, thus appearing as a singular one. In other words, the high- and low-frequency semicircles correspond to groups of one or more processes with similar impedance characteristics. Quantitatively, the total resistance can be determined in the Nyquist plots from the low-frequency intercept, whereas the contribution of each semicircle can be estimated only approximately. The total resistance of the case C05A10 (Fig. 3a) was estimated from the low-frequency intercept. Its value gradually decreased with increasing voltage up to 2.6 V: 51.6, 20.7, and 14.3 Ω·cm2 at 1.8, 2.2, and 2.6 V, respectively. At 3.0 V, the polarization increased probably due to the severe interference of generated gases [48].

Nyquist plots of experimental EIS data of the PEM CO2/H2O co-reduction single cell (a) for feed concentration of C05A10 at various cell voltages, and (b) for the cell voltage of 2.2 V with various feed conditions.
Fig. 3b presents another set of Nyquist plots for the EIS spectra at a fixed voltage of 2.2 V for different electrolyte concentration combinations. Similar to the Nyquist plots in Fig. 3a, the Nyquist plot in Fig. 3b exhibit two depressed semicircles. From the Nyquist plot, the resistance components can be estimated from the x-intercepts at high and low frequencies, which correspond to the ohmic and total resistances, respectively. For example, the total resistance of C10A10 can be analyzed graphically to be approximately 12.7 Ω·cm2, which is composed of the ohmic resistance of 2.2 Ω·cm2 and the polarization resistance of 10.5 Ω·cm2. Furthermore, the contribution of high-frequency resistance to the polarization resistance can be estimated to be slightly higher than 50%, based on the semicircle sizes in the Nyquist pot, even though accurate quantification is difficult owing to the overlapping of two semicircles.
When the anolyte concentration was decreased from 1.0 M (C10A10) to 0.5 M (C10A05) with a fixed catholyte concentration of 1.0 M, only the low-frequency semicircle increased in size to provide higher total resistance (12.7 to 16.9 Ω·cm2), whereas no significant change in the high-frequency semicircle was observed. A similar trend can be observed in the case of anolyte concentration change at the catholyte concentration of 0.5 M (C05A10 and C05A05). That is, only the low-frequency semicircle increases in size with decreasing anolyte concentration, while the high-frequency semicircle remains unchanged. When the catholyte concentration decreased (C10A10 to C05A10 and C10A05 to C05A05), both the high- and low-frequency semicircles increased in size. This suggests that the first semicircle is related to the cathodic processes only, considering that it was affected only by the concentration of the cathode, whereas it was independent of the anolyte concentration. Changes in the low-frequency semicircle were observed due to the changes in the catholyte and anolyte concentrations. Therefore, it can be inferred that the low-frequency semicircle represents both the cathode- and anode-related processes.
Figs. 4a and 4b show Bode-type plots, where the frequency-related information can be graphically analyzed. When the imaginary parts of the impedance are plotted as a function of frequency on a semilog scale, the electrochemical processes can be identified as peak-shaped signals with corresponding frequency ranges. For example, at 1.8 V, C05A10 (Fig. 4a) has a main peak around 10 Hz and a smaller peak at a higher frequency of approximately 1 kHz, corresponding to the low- and high-frequency semicircles in the Nyquist plot (Fig. 3a), respectively. At an operating voltage of 2.2 V, the peaks in the Bode plots were identified at approximately 1 kHz (0.46– 1.18 kHz) and tens of Hz (13.7–55.9 Hz), which are dependent on the feed concentration (Fig. 4b).
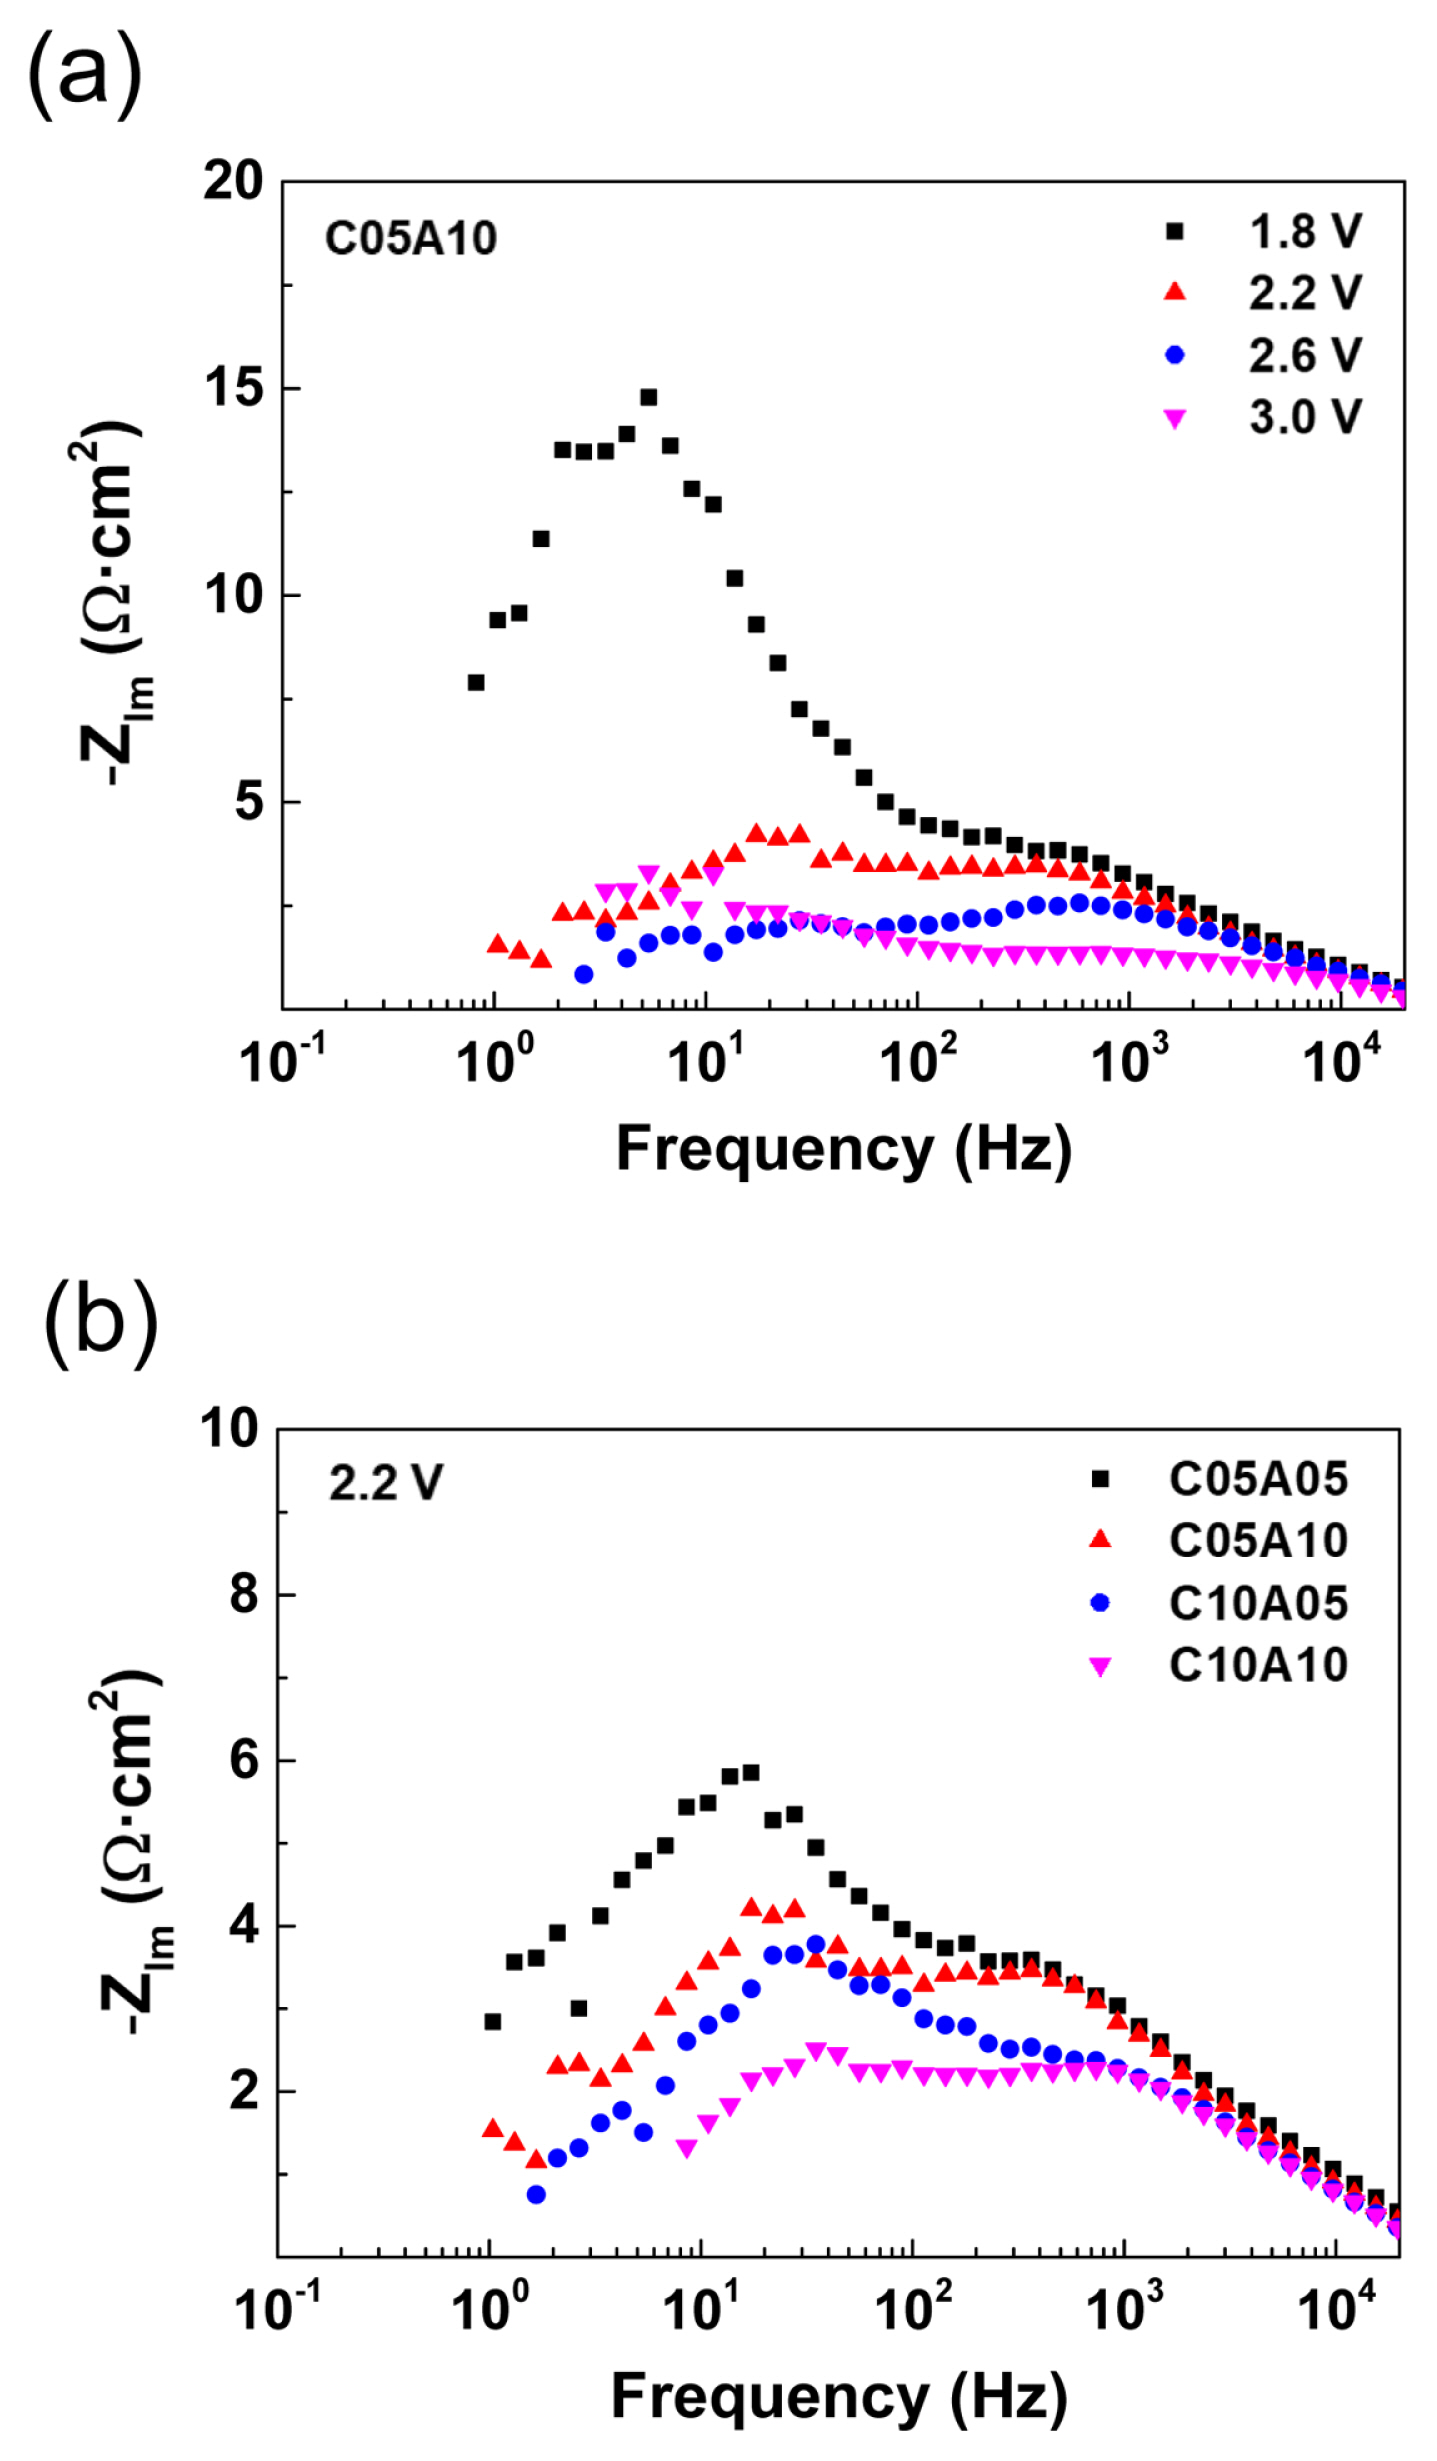
Bode plots of experimental EIS data of the PEM CO2/H2O co-reduction single cell (a) for feed concentration of C05A10 at various cell voltages, and (b) for the cell voltage of 2.2 V with various feed conditions.
3.3 Equivalent circuit and process assignments
The electrical characteristics of electrochemical systems can be described using equivalent circuits composed of electric elements that represent each electrochemical process. Generally, electrochemical single cells can be represented by serially connected elements, as shown in Fig. 5a. In this scheme, the electrochemical reactions in the cathodes and anodes are designated as ZC and ZA, respectively. Polymer membrane electrolytes can be treated as a simple resistance of RPEM, and electric wires are represented by a serial combination of an inductor (Lwire) and resistance (Rwire). Here, an additional resistance was serially connected for the buffer layer that can be used in CO2/H2O co-reduction cells [8,26,27]. Then, the equivalent circuit of the CO2/H2 co-reduction single cell can be represented as shown in Fig. 5b considering the following: (1) each electrode reaction is composed of a charge transfer step and a mass transfer step, (2) there are parallel cathodic reactions of CO2 reduction and HER, and (3) simple resistances of Rwire, Rbuffer and RPEM are merged with Rohm. Here, each charge transfer and mass transfer process is represented by a parallel combination of resistance and a constant phase element (CPE) [43]. However, it should be noted that the resistance and CPE elements for the CO2 reduction and HER cannot be analyzed separately and can only be measured as merged characteristics, as reported by Bienen et al. [43] for a half-cell test of CO2 reduction with the co-production of hydrogen and formate.

Collection of equivalents circuits discussed to represent PEM CO2/H2O co-reduction single cells: (a) General schematic representation of the reaction system, (b) more detailed representation for the cathodic and anodic reaction impedances, while the simple resistances are merged with Rohm, (c) one with merged cathodic charge transfer impedance, and (d) the the equivalent circuit utilized for the non-linear fitting in this study. RHF and QHF elements represent the contribution of high frequency region, and RLF and QLF elements the contribution of low frequency region.
According to the resultant equivalent circuit (Fig. 5c), up to four semicircles can be observed in the Nyquist plots if every process is significant within separated frequency ranges. However, two semicircles were observed in the experimental Nyquist plots in the present work (Fig. 3). The high-frequency semicircles were dependent only on the catholyte condition, and the low-frequency semicircles were influenced by both catholyte and anolyte conditions. Therefore, it can be reasonably assumed that the cathodic impedance is composed of a charge transfer process and mass transfer process, as reported for a half-cell [43], which are related to the high- and low-frequency semicircles, respectively. In this study, the characteristic frequency of the high-frequency semicircle was approximately 1 kHz, which is in reasonable agreement with that reported by Bienen et al. [43]. Then, the experimentally observed low-frequency semicircle, which is separated from the high-frequency semicircle by approximately two orders, would be the overlapped signal of the cathodic mass transport and the oxygen evolution reaction (OER) in anodes. The apparent characteristic frequencies for the low-frequency semicircles ranged between 3.36 and 70.7 Hz in the present work, which are similar to the reported CO2 reduction mass transport [43] and OER [49–51]. Accordingly, the equivalent circuit for the CO2/H2O co-reduction single cell was determined, as shown in Fig. 5d, and utilized for the nonlinear fitting of the experimental EIS data.
3.4 Nonlinear fitting analysis of the EIS data
The experimental EIS data in this study were analyzed via nonlinear fitting using the equivalent circuit shown in Fig. 5d. Figs. 6a and 6b show the experimental EIS data at 2.2 V with fitted lines in the Nyquist and Bode plots, respectively. The experimental data and fitted results were well-matched with small chi-squares of 10−4 orders. For example, at 2.2 V, the chi-square values were 6.48×10⁻⁴ (C05A05), 9.97×10⁻⁴ (C05A10), 5.58×10⁻⁴ (C10A05), and 6.22×10⁻⁴ (C10A10). Therefore, it could be confirmed that the equivalent circuit could well describe the electrochemical characteristics of the CO2/H2O co-reduction single cell. Through this, the parameters for the six elements could be determined for various operating voltages and feed conditions. Here, Lwire and Rohm were determined to be very similar for 16 EIS measurements at different operating voltages and feeding concentrations. The average values of Lwire and Rohm were 1.69 μH·cm2 and 2.35 Ω·cm2, while the respective standard deviations were less than 0.02 μH·cm2 and 0.11 Ω·cm2, respectively. Here, all values were normalized by the active area of the single cells. Mainly due to the additional resistance of buffer layers in this study, the ohmic resistance was larger than the reported own resistances at 1 kHz of 0.0725 Ω·cm2 for 100% relative humidity [52] and 0.0531 Ω·cm2 in water [53].
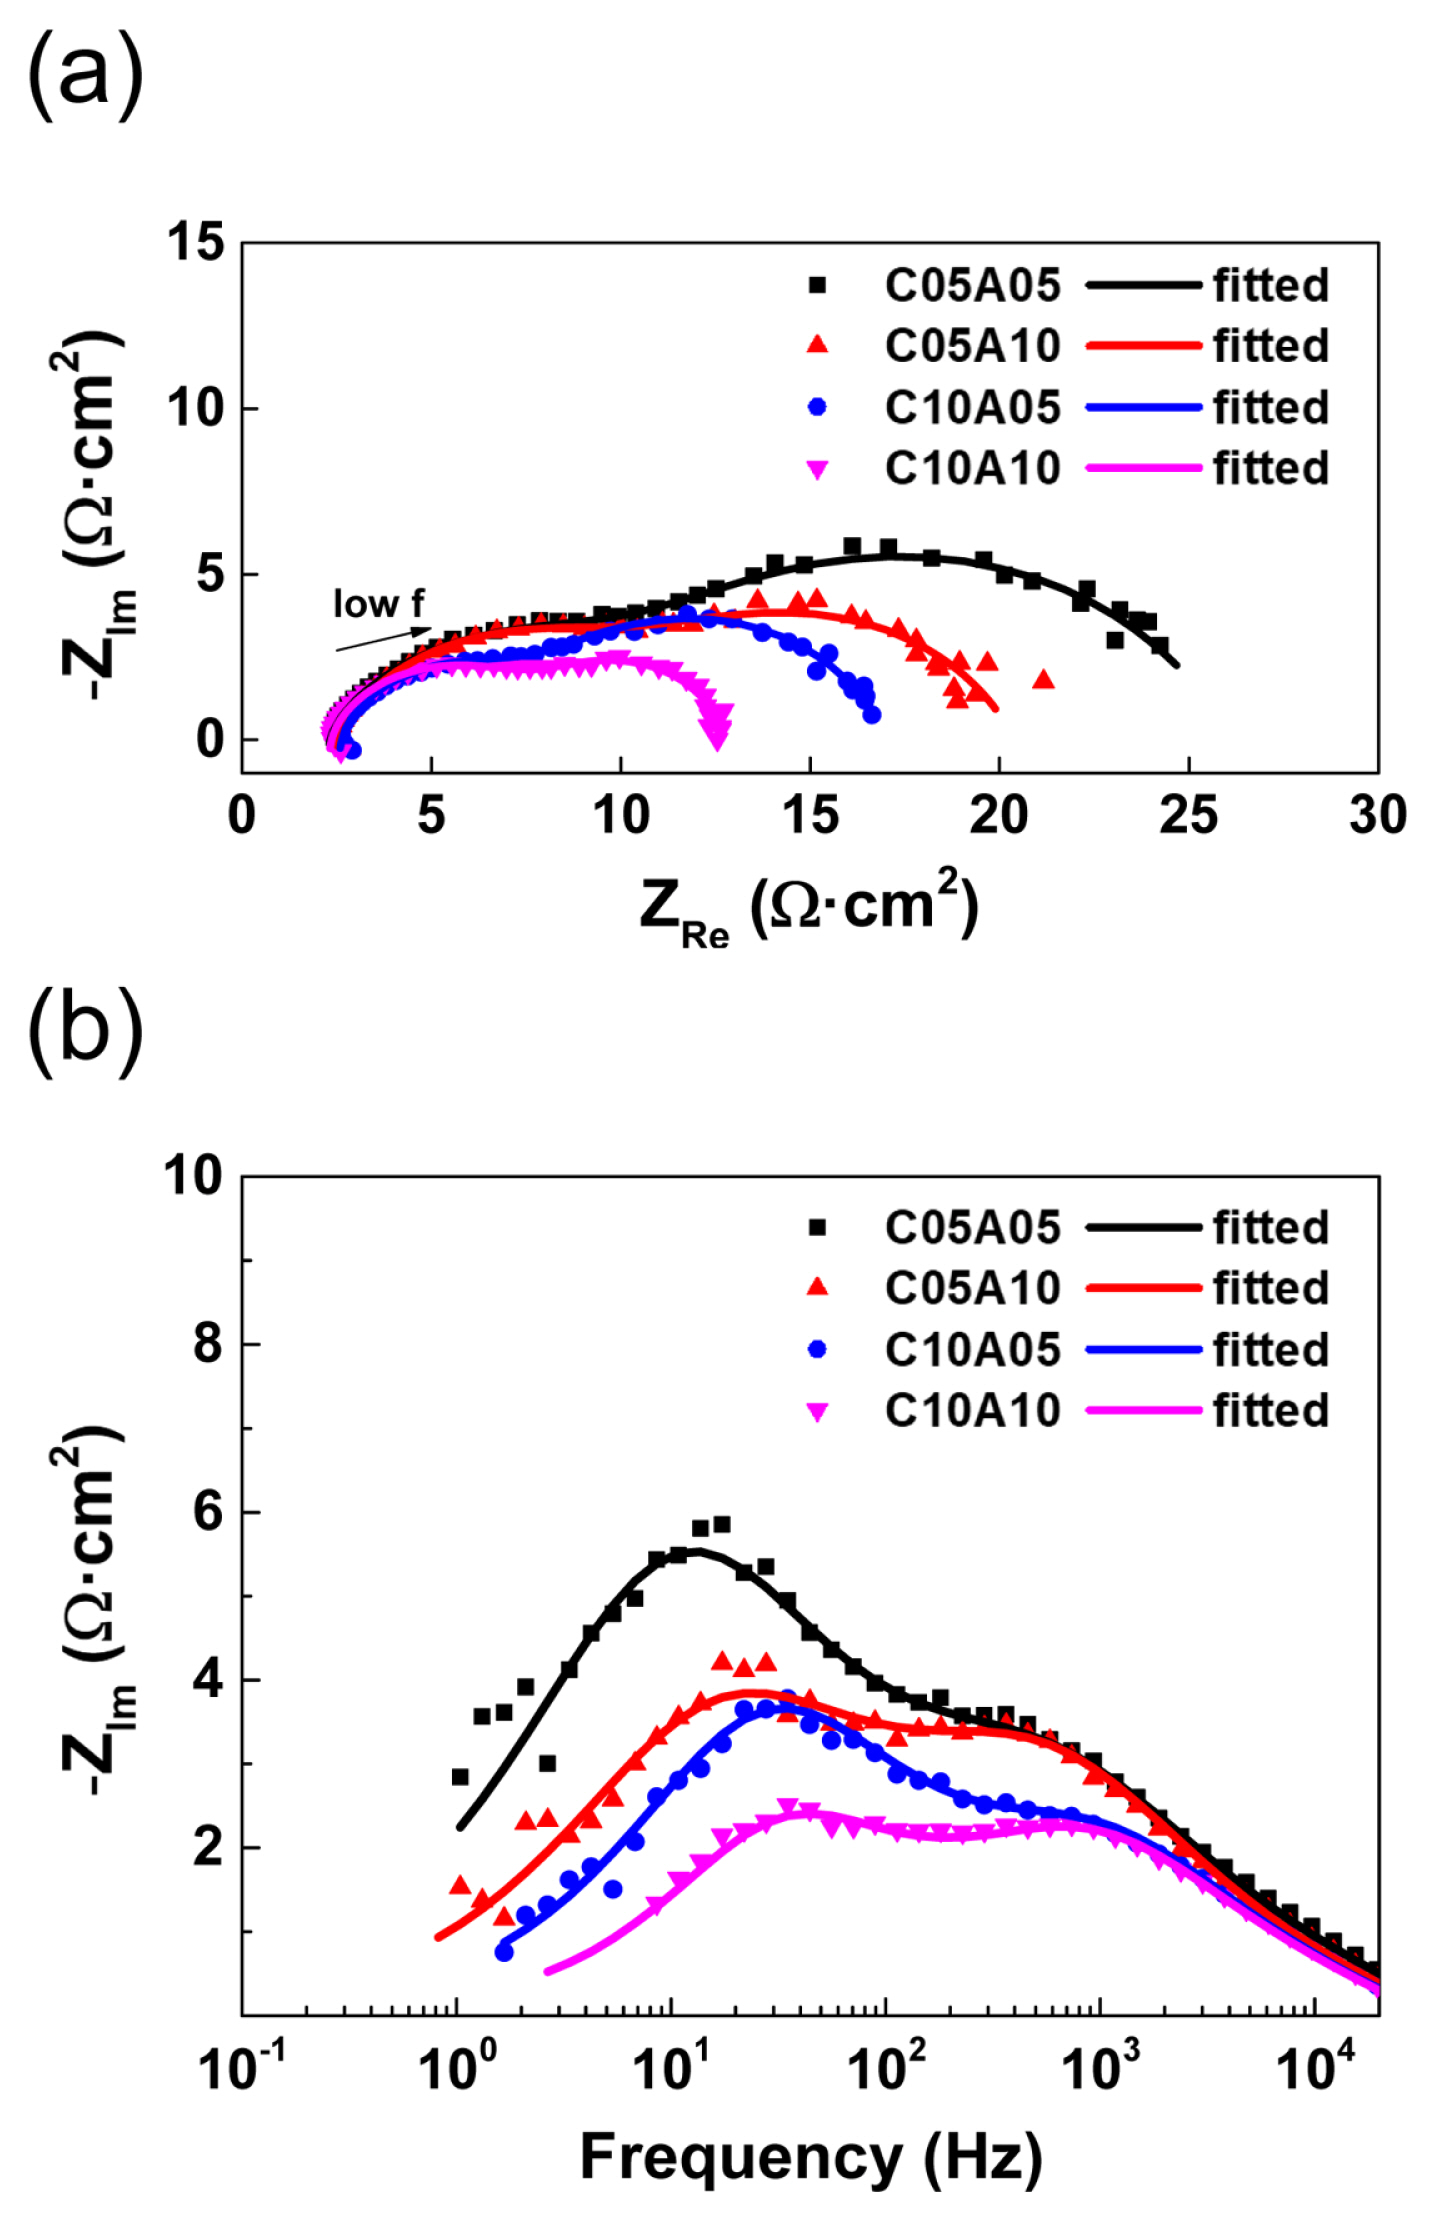
(a) Nyquist plots and (b) Bode plots of experimental EIS data and non-linear fitted lines for various feed conditions at a cell voltage of 2.2 V.
In the graphical analysis, the contributions of resistances related to the impedances in the high-frequency and low-frequency regions were only approximately estimated because the corresponding semicircles were not clearly separated. However, by nonlinear fitting based on the equivalent circuit, the quantitative analysis of each component could be performed for the single-cell system, where their characteristic frequency was separated by approximately two orders. For example, the effect of the feed concentration on the high-frequency and low-frequency resistances could be determined, as shown in Fig. 7. In the case of C05A05, the polarization resistance of 24.05 Ω·cm2 includes an RHF contribution of 38.3% (9.20 Ω·cm2) and an RLF contribution of 61.7% (14.85 Ω·cm2). When the anolyte concentration was increased with a fixed catholyte concentration of 0.5 M, the change in RHF was negligible (9.20 to 9.52 Ω·cm2), whereas the RLF significantly decreased (14.85 to 8.77 Ω·cm2). For a higher catholyte concentration of 1.0 M, the increase in the anolyte concentration similarly decreased the RLF (9.24 to 4.57 Ω·cm2), with the RHF remaining unchanged (5.26 to 5.96 Ω·cm2). Thus, the characteristics of cathodic and anodic processes could be analyzed by EIS for a full cell of CO2/H2O co-reduction. In addition, the total resistances, which are determined as the sum of Rohm, RHF, and RLF, could be correlated with the differential slopes in the corresponding iV plots.
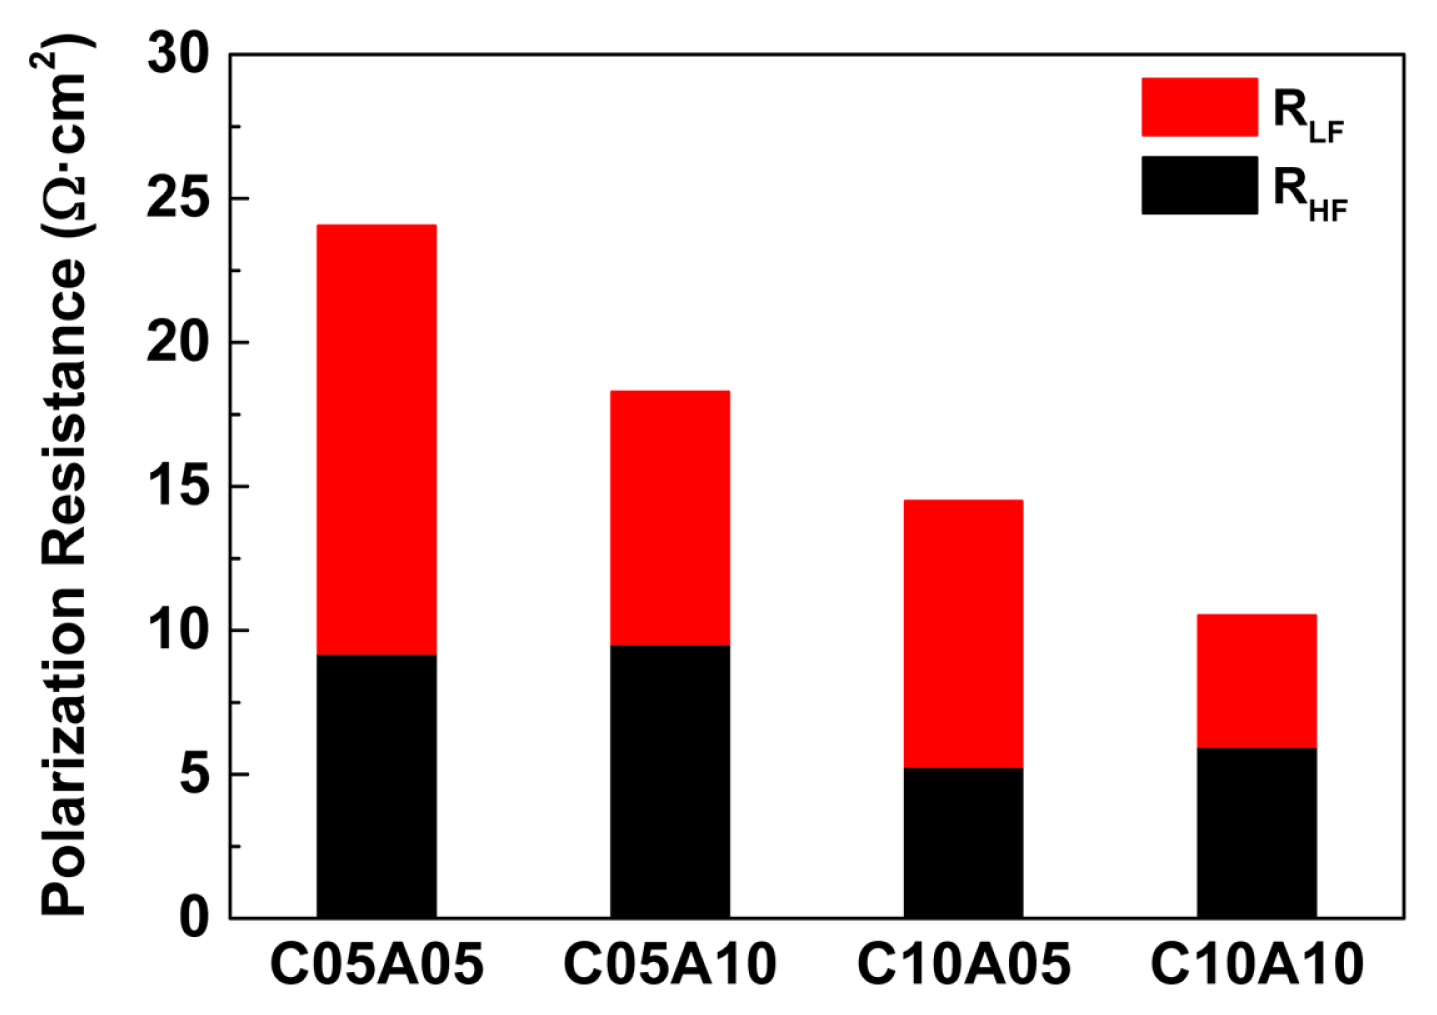
Polarization resistances at 2.2 V for various feed conditions, which are sum of RHF and RLF determined from non-linear fitting of the experimental EIS data.
4. Conclusions
In response to increasing global warming, electrochemical CO2 reduction in PEM cells has gained particular interest. The behavior of electrochemical coreduction processes in a PEM single cell for syngas production is still not fully understood, although most studies have been performed at the half-cell level scale. To interpret the co-reduction processes, herein performed an EIS analysis on the CO2 reduction process for syngas production in a PEM single-cell system. Based on theoretical considerations, experimental data, and literature analysis, we interpreted the EIS spectra and constructed a novel equivalent circuit model. The charge transfer and mass transfer processes of the anode and cathode reactions were simplified to high- and low-frequency equivalent circuit components such as resistances and constant phase elements. Considering the empirical data collected, it was observed that the high-frequency region is dominated by cathode charge transfer in competitive CO2 reduction and hydrogen evolution reactions, while the low-frequency region is influenced by cathode mass transfer process and anode charge transfer reactions. After nonlinear parameter fitting, we demonstrated that the model was capable of satisfactorily describing the experimental observations despite its simplification in estimating the effects of catholyte and anolyte concentrations on the transfer processes. We believe that the results of this study at the single-cell level can be helpful in further exploring the CO2 reduction reaction under different operating conditions.
Acknowledgements
This research was supported by the National R&D Program through the National Research Foundation of Korea (NRF), funded by the Ministry of Science and ICT (2019M3E6A1063674, 2021M3D1A2051396). Moreover, this research was also supported by the Korea Institute of Science and Technology (No. 2E31871). Dr. Emilio Audasso was supported by the Brain Pool Program of the National Research Foundation of Korea (NRF) and was granted financial resources from the Ministry of Education, Science & Technology, Republic of Korea (2021H1D3A2A02083087). This work was supported by the 2022 sabbatical year research grant of the University of Seoul.
Notes
Declarations
No potential competing interest was reported by the authors.