Fabrication of a Full-Scale Pilot Model of a Cost-Effective Sodium Nickel-Iron Chloride Battery Over 40 Ah
Article information
Abstract
To fabricate a full-scale pilot model of the cost-effective Na–(Ni,Fe)Cl2 cell, a Na–beta–alumina solid electrolyte (BASE) was developed by applying a one-step synthesis cum sintering process as an alternative to the conventional solid-state reaction process. Also, Fe metal powder, which is cheaper than Ni, was mixed with Ni metal powder, and was used for cathode material to reduce the cost of raw material. As a result, we then developed a prototype Na–(Ni,Fe)Cl2 cell. Consequently, the Ni content in the Na–(Ni,Fe)Cl2 cell is decreased to approximately (20 to 50) wt.%. The #1 prototype cell (dimensions: 34 mm × 34 mm × 235 mm) showed a cell capacity of 15.9 Ah, and 160.3 mAh g−1 (per the Ni–Fe composite), while the #2 prototype cell (dimensions: 50 mm × 50 mm × 335 mm) showed a cell capacity of 49.4 Ah, and 153.2 mAh g−1 at the 2nd cycle.
1. Introduction
Because of energy demand and the increase in the price of fossil fuels and corresponding environmental impact, electrochemical energy storage systems or batteries have gained great attention recently for both grid and transportation applications. Among the Battery Energy Storage Systems (BESSs), Na–beta Batteries (NBBs) using a Na–beta-alumina solid electrolyte (BASE) that selectively allows Na+ ion transport between a positive electrode and a negative molten sodium electrode have attracted growing interest as grid- and utility-scale batteries [1–5]. In NBBs such as Na/S or Na-NiCl2 batteries, the Na/S battery exhibits reasonable power and energy densities, temperature stability, abundant raw materials, system cost, etc. Thus, Na/S and Li-ion batteries are currently gaining growing attention in the field of BESS [2,5,6]. However, there have been concerns about the safety, and size issues of Na/S and Li-ion batteries. The Na–NiCl2 battery incurs a more expensive system cost than do the Na/S and Li-ion batteries. However, compared with the Na/S battery, the Na–NiCl2 battery has some advantages, such as high energy density (120W h kg−1), high voltage (2.58 V), no safety issue, and easy cell assembly process [1,6–8]. Therefore, many research groups have studied how to resolve the cost issue, such as high operating temperature (approx. 300°C), and the substitution of Ni transition metal powder [8–13].
As mentioned above, there have been many studies of the high temperature Na–NiCl2 batteries that addressed the challenge of cost issues. First, K-Y. Jung, J-Y. Kim and Guosheng Li et al. have reported the Intermediate Temperature (IT) Na–NiCl2 battery operating at 190°C using bi-layer (e.g., thin dense/thick porous layers) BASE [9–11]. The advantages of lowering operating temperature are the reduced costs of sealing materials and technologies for the Na–NiCl2 battery system that can employ conventional polymers to replace the complicated and high-cost sealing methods. By having a lower operating temperature, the IT Na–NiCl2 batteries exhibit a stable cycling performance for over 1,000 cycles, because of the suppression of particle growth in the Ni cathode active materials. Although IT Na–NiCl2 batteries are in the developmental stage, they offer high promise for large-scale BESS application, because of their easily stackable configuration and simplified cell fabrication process [8–10]. Second, C-W. Ahn and B-M. Ahn et al. have reported the electrochemical properties and cycling performances of Na–(Ni,Fe)Cl2 cells [12,13]. To increase cell capacity, as well as reduce Ni content, Fe particles were used that are larger than Ni particles, reduced Ni particles by 50%, and obtained significant cell capacity in the Na–(Ni,Fe)Cl2 cell, since NiCl2 layers were not formed on the surface of the Ni chains during the electrochemical reaction of Fe. In the charge–discharge cycle, Cl− ions are almost consumed by Fe particles, and then Ni particles react with the remaining Cl− ions, because the electrochemical potential of Fe (2.35 V) is lower than that of the Ni particles (2.58 V).
Fig. 1 shows a schematic of the full-scale pilot model of the cost-effective Na–(Ni,Fe)Cl2 battery and the overall electrochemical reaction. This cell contains a liquid sodium negative electrode, and the positive electrode consists of a porous structure of Ni, Fe, and NaCl that is impregnated with NaAlCl4(l), such as a Na+ ion-conducting 2nd electrolyte, BASE as Na+ ion-conductor, and an electronic insulant separator. Na–beta-alumina has been the most common choice of the NBBs for a solid electrolyte, primarily because of its high ionic conductivity of (0.2 to 0.4) S cm−1 at 300°C, excellent compatibility/chemical stability with the electrode materials, satisfactory mechanical strength, and low material cost [14]. There are two parent phases: β-alumina has the theoretical formula Na2O–11Al2O3 or NaAl11O17, whereas β″–alumina has the theoretical formula Na2O–5Al2O3 or NaAl5O8, which have ionic conductivity of (0.03 and 0.2) S cm−1 at 350°C, respectively [15–17]. According to the Na2O–Al2O3 phase diagram proposed by Fally et al. [18], β– + β ″–alumina phases coexist in that region corresponding to the formula Na2O·nAl2O3, where (5.33 ≤ n ≤ 8.5). The β–and β″–alumina phases have close-packed structures with two and three spinel blocks, respectively, separated by conduction planes containing sodium and oxygen. β ″–alumina has a rhombohedral structure with an R m space group and lattice constants of a and c of (5.614 and 33.85) Å, respectively [14]. A unit cell of β″–alumina consists of a three-fold screw axis using three spinel blocks, and each spinel block is separated by a conduction plane linked to the alkali-ion layer and the Al–O–Al combination layer. In general, its a-axis is similar to that of β–alumina, whereas its c-axis is 1.5 times longer, and the concentration of alkaline ions on its conduction plane is higher. Therefore, the β″–Al2O3 exhibits substantially higher ionic conductivity [19,20].
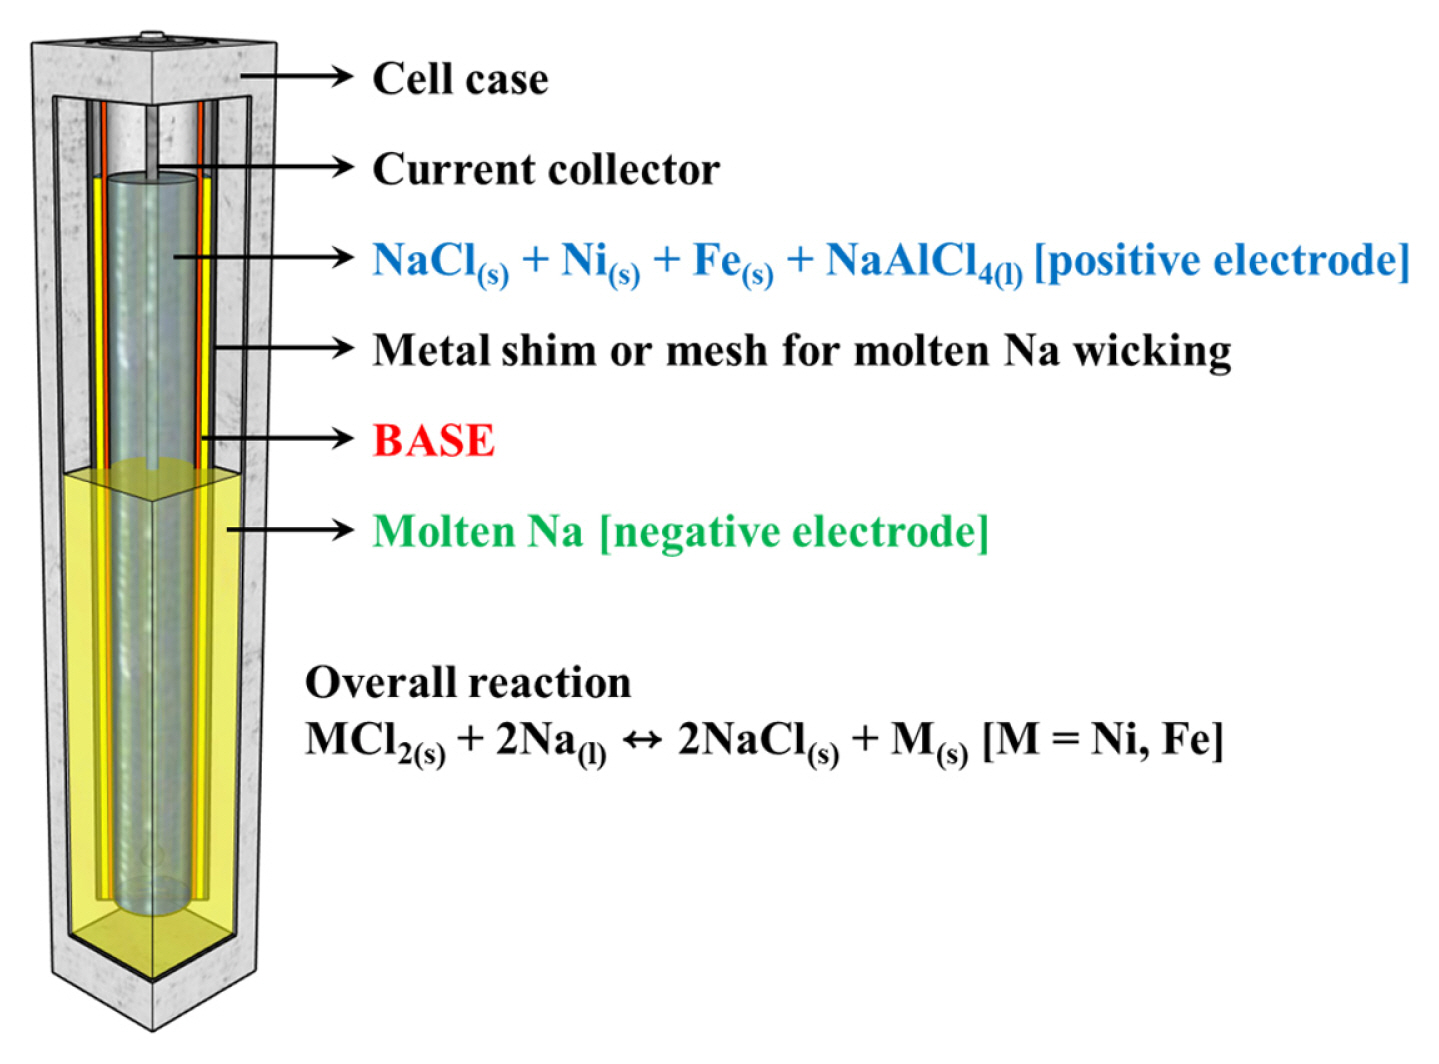
Schematic cross-section of the Na–(Ni,Fe)Cl2 battery.
The fabrication of BASE can be roughly categorized into two types: solid-state reaction processes, i.e., the conventional process, and soft-chemistry routes, such as sol–gel [7,15,16] or co-precipitation [21–24]. The ionic conductivity of soft-chemistry routes was reported 0.38 S cm−1 at 300°C by Sandeep P. Butee et al. [22] and 0.21 S cm−1 at 350°C by Shi-Jie Shan et al. [23]. Although soft-chemistry methods could be used to mix the reactants on a molecular scale to ensure high reactivity and thus obtain nanoscale powder and a high-quality product, it is generally difficult to scale up such methods for industrial mass production. The conventional process is essential for the fabrication of BASE. Unfortunately, in the conventional process, the preliminary calcination step to obtain a Na–beta–alumina powder increases the complexity of the fabrication steps, energy consumption, and total manufacturing cost. Hence, in the manufacturing of NBBs, it would be beneficial to decrease the number of production steps and produce a BASE more efficiently. When the production of BASE by direct firing is attempted without calcination, severe volume expansion occurs in the phase transition from α- to β/β″-alumina, making it difficult to obtain a BASE with uniform quality and high strength. To overcome these shortcomings, we need to study the improvement of properties by adding dopants. In the present work, we prepared a cost-effective BASE by applying a one-step synthesis cum sintering process without a Na–beta–alumina calcination step. Fig. 2 shows schematics of the conventional and a one-step synthesis cum sintering processes for BASE. Furthermore, we attempted to make for the first time a full-scale pilot model of Na–(Ni,Fe)Cl2 cell over 40 Ah, which uses a ferro-nickel chloride as cathode material.
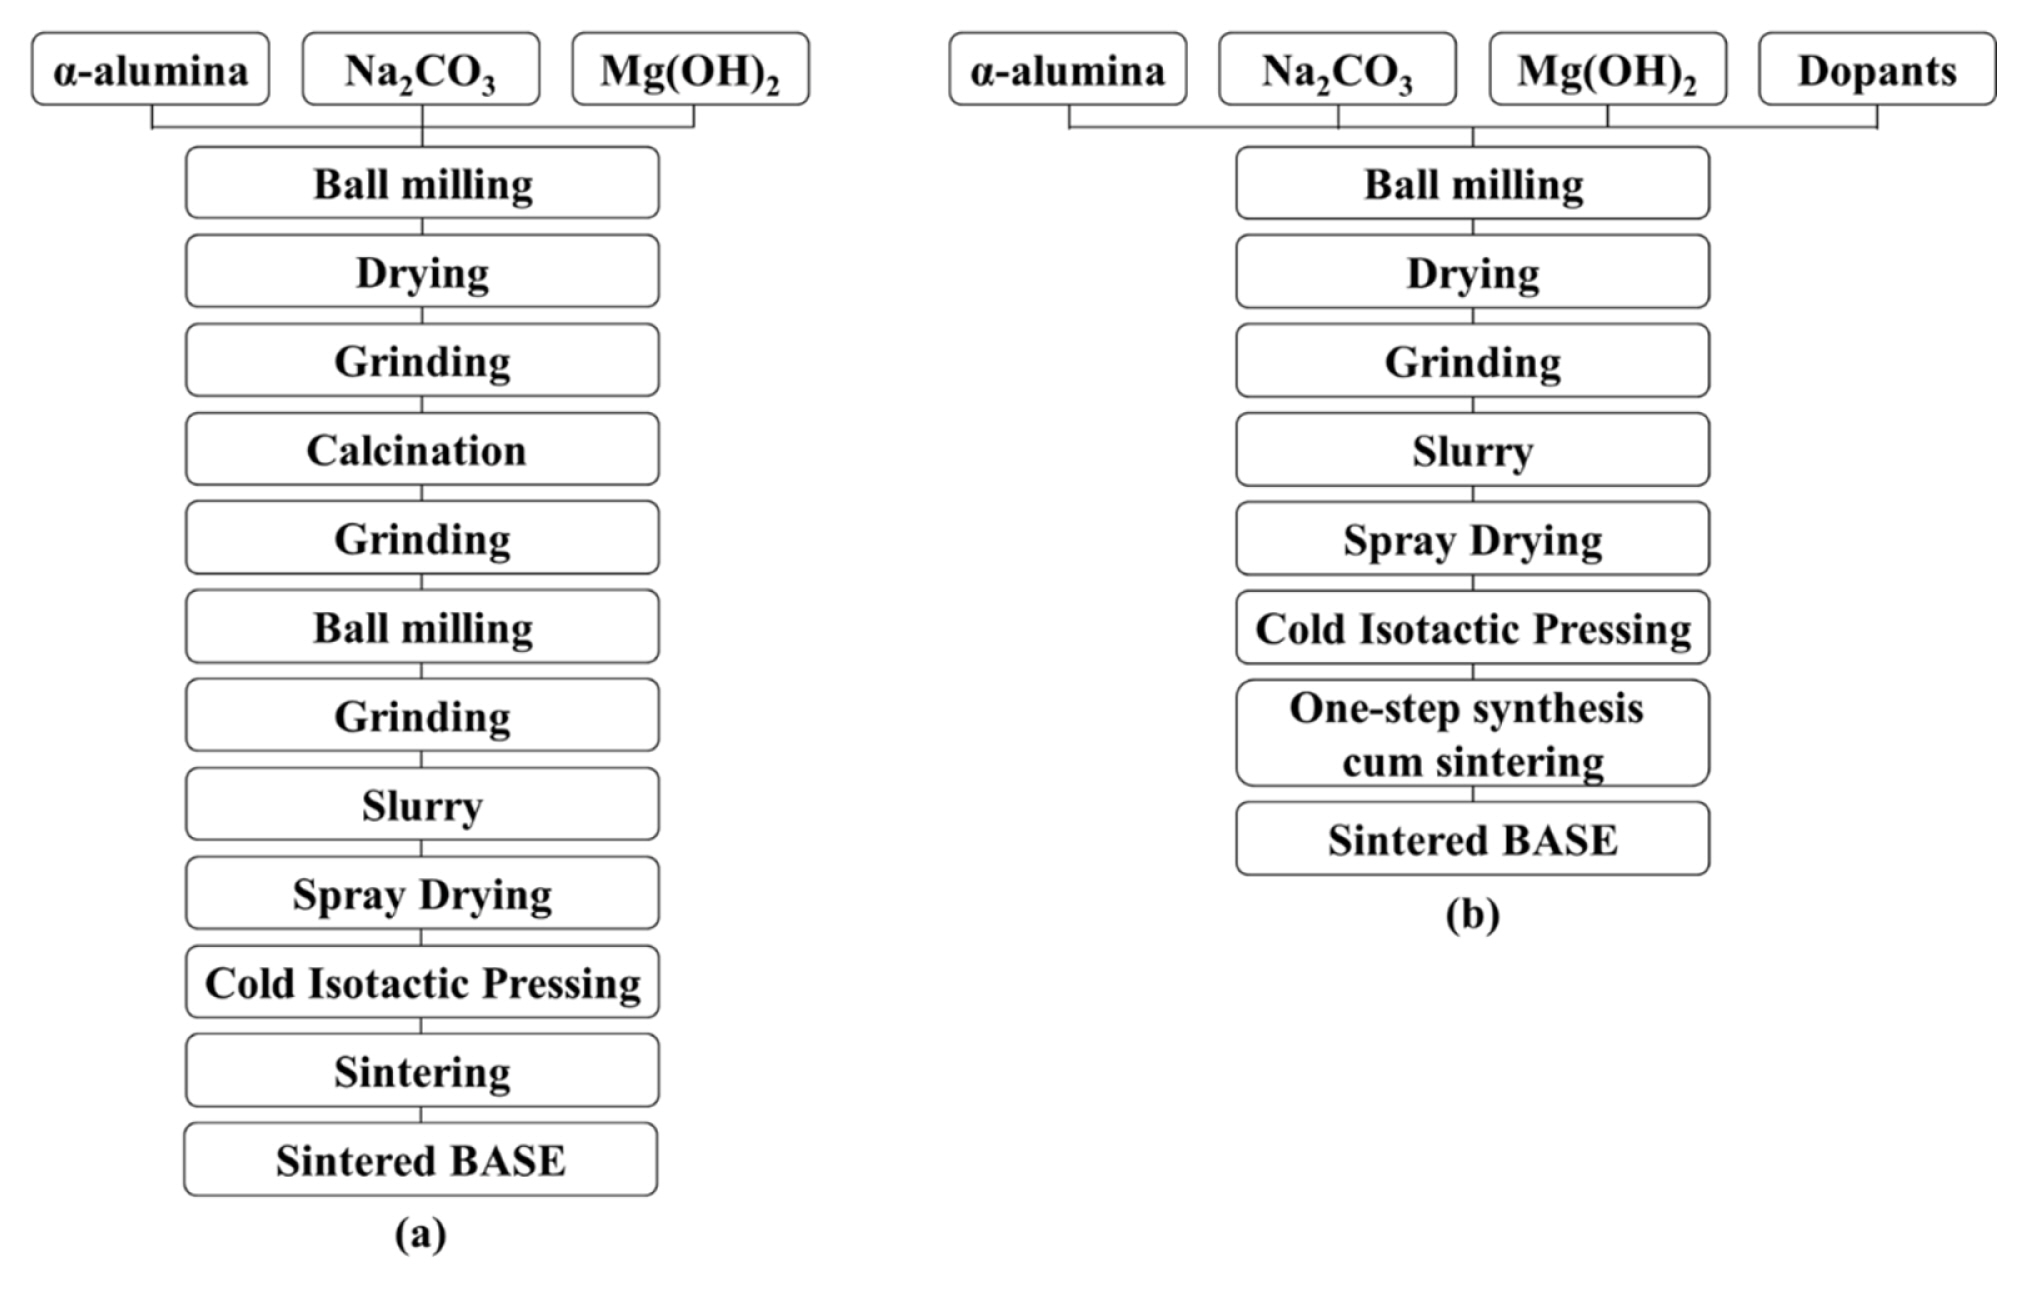
Schematics of the BASE manufacturing method by the (a) conventional process, and (b) one-step synthesis cum sintering process.
2. Experimental
2.1 Cathode materials preparation
The cathode active materials were prepared using Ni (99.7%, 2.5 μm, Standard Grade, Value), Fe (99.5%, 6.5 μm, International Specialty Products), and NaCl (98%, Sigma-Aldrich) powders. The weight ratios of NaCl/(Ni + Fe) were approximately 58.8% (1.0 g/1.7 g). Thus, the theoretical capacity of the cell is approximately 275 mAh g−1 (per weight of Ni, Fe powders). Two mixtures of Ni and Fe powders were used, namely, Ni/Fe = (0.8/0.2 and 0.5/0.5) wt/wt. Then, the cathode active materials were prepared using plate-type granules by a roller compactor. The cathode active materials were provided by the Korea Institute of Materials Science (KIMS, Korea) [12,13]. The NaAlCl4 (the 2nd electrolyte) melt was synthesized at 250°C, using NaCl and AlCl3 (99.985%, Alfa Aesar) powder, then added Sulfur (Sigma-Aldrich) powder of 5 wt.% to the NaAlCl4 powder in a glove box. Sulfur powder has been used to remove the oxide layers from the surface of the Ni and Fe metal particles [25].
2.2 Preparation of BASE applying a one-step synthesis cum sintering process
BASE was fabricated using commercial α-Al2O3 (99.9%, High Purity Chemicals, Japan), Na2CO3 (99.8%, Sigma-Aldrich, USA), Mg(OH)2 (99%, Sigma-Aldrich, USA), Yttria Stabilized Zirconia (YSZ; 99.9%, High Purity Chemicals, Japan), Ta2O5 (99.9%, High Purity Chemicals, Japan), and MnO2 (99.99%, High Purity Chemicals, Japan) powders as the starting materials. The fabricated BASE contained Na2O at the [Na2O]/[Al2O3] molar ratio of 1/6.1, 4.1 wt.% MgO (as a stabilizer), 0.8 wt.% MnO2 (as a dopant), 0.3 wt.% Ta2O5 (as a dopant), and 8.0 wt.% YSZ (as a dopant). The raw materials were ball milled for 5 h. Before spray-drying, the slurries were ball-milled for 12 h. The slurries used in the granulation step contained 3.0 wt.% polyvinyl alcohol binder (SAN NOPCO, BD-25, Japan), and 1.0 wt.% dispersant (SAN NOPCO, 44-CF, Japan) for the net weight of raw materials powder in distilled water. Then, they were spray-dried using a disk-type spray dryer, where the inlet and outlet temperatures were set at (180 and 110)°C, respectively. After the spray-drying process, only granules that passed through a 100 mesh (149 mm) sieve were collected. The collected granules were cold isotactic pressed (CIP) at 120 MPa using a CIP mold, and green tubes were sintered in a furnace for 120 min at 1,620°C.
2.3 Full-scale pilot model of the Na–(Ni,Fe)Cl2 battery assembly and cell cycling
Fig. 3 shows that the cell components of the #1 prototype cell and #2 prototype cell (#1 cell: 34 mm × 34 mm × 235 mm; #2 cell: 50 mm × 50 mm × 335 mm) consist of a cell case (Ni metal), fabricated BASE, metal mesh or foil (Ni metal), wicking shim (Ni metal), current collector (Ni metal), carbon felt, α-alumina ring, etc., and the fabricated cell image of the prototype cells. The #2 prototype cells were fabricated (e.g., #2-1 prototype cell, #2-2 prototype cell). The α–alumina/Ni ring joints were applied with thermal compression bonding (TCB). The fabricated BASE was glass-sealed to the α–alumina/Ni ring joints, and then heat treated the BASE/α–alumina joints at 1,000°C for 30 min using a box furnace. For carbon coating, the carbon paste was spread onto the anode side of BASE, and heat treated the BASE/α–alumina joints at 270°C for 5 min to remove impurities [26]. The carbon felt was placed in the current collector, and then, the Ni metal components (e.g., cell case, top/bottom cell cover, BASE/α–alumina joints) were fabricated by using a laser welding machine. The fabricated fixture were transferred into a glove box for the cell assembly. Cathode granules (e.g., cathode active materials) were added to the cathode side of the fabricated fixture, and NaAlCl4 melt was infiltrated into the cathode granules at an elevated temperature of 250°C. Finally, the fixture was enclosed with Ni metal inner cap by laser welding. The fabricated full-scale pilot model of Na–(Ni,Fe)Cl2 cells was cycled at an elevated temperature of 300°C using a heating chamber (Jeio Tech, Korea). All cell cycling tests were conducted using a 4,300 K Battery Test System (Maccor Inc., USA).

Image of cell components of #1 prototype cell, and #2 prototype cell; 1. bottom case, 2. α–alumina ring, 3. inner Ni ring, 4. outer Ni ring, 5. upper case, 6. Ni current collector, 7. carbon felt, 8. shims, 9. cell case, 10. metal mesh or foil, 11. BASE (Na–beta–alumina solid electrolyte), 12. inner cap, 13. terminals
3. Results and Discussion
In the microstructure design of cathode active material, the connection of Ni particles must be considered to obtain high electronic conductivity, as shown in Fig. 4 [13]. The cathode active materials were designed for the Fe particles to be larger than the Ni particles, since by using large Fe particles, Ni particles could be well-connected. Fig. 5 shows the microstructures of the Ni and Fe particles [13]. The particle size of the agglomerated Fe metal (approx. 6.5 μm) was larger than the Ni metal (approx. 500 nm).


In previous work, we have reported the fabrication of BASE to increase the sintered properties using the addition of various dopants [27–32]. Table 1 summarizes the characteristics of the BASE with various dopants added. The improvements in the sintered densities of the BASE are the result of the increasing concentrations of Al3+ ion vacancies in the spinel block; these vacancies promote densification by providing a diffusion path for Al3+ ions [31]. The sintered densities of Si- and Ti-doped BASE were improved by doping with small amounts of SiO2 and TiO2. The increase in densification with SiO2 and TiO2 content occurred partly from the effect of the liquid phase in allowing the rearrangement of the particles. A liquid phase creates an attractive force between the particles, putting the particle contacts in compression [29,31]. In the YSZ-, CSZ-doped BASE, the sintered densities increased with the addition of each dopant content. Generally, in the range of pure BASE to 21 wt.% zirconia addition, the sintered density of the YSZ-, CSZ-doped BASE increased with the zirconia content, indicating that the addition of zirconia particles allowed the densification of the alumina matrix; the volume expansion from tetragonal to monoclinic associated with the phase transformation improved the sintered density (CSZ, YSZ) [30,32]. In the case of Mn-doped BASE, Mn2+ or Mn3+ ions were substituted for Al3+ ion in the tetrahedral sites of the spinel blocks. The resulting charge defects were compensated for by the additional Na+ ions in the conduction planes, which resulted in a higher Na+ ion concentration and β″–Al2O3 phase fraction [28]. The ionic conductivity of BASE was affected by the sintered density and the β″–Al2O3 phase fraction. As experimental results, the sintered density was the main factor causing an increase in the ionic conductivity of the BASE. In general, polycrystalline BASE has grain bulk resistance (RB) and grain boundary resistance (RGB); so it was possible to separate out the semi-circle part and the line part below 250°C [29]. Above 250°C, the grain boundary resistance to the total resistance was negligible; then at 250°C, the inflection point appeared in the Arrhenius plots, and the activation energy declined as the temperature rose above the inflection point. In the case of Si-, Ti-, Mn-, Fe-doped BASE, the inflection points appeared at (220 to 250)°C [28,29,31]. In the case of Ta-doped BASE, on the other hand, the inflection point appeared at 200°C, which means the grain boundary resistance significant declined with the addition of Ta dopant (shown in Fig. 6). In fact, the addition of Ta to BASE by applying a one-step synthesis cum sintering process has not previously been reported. In the case of Ta-doped BASE, we can deduce that a specific amount of Ta5+ ions can enter the spinel block; then in the firing step, the residual Ta5+ ions tend to concentrate on the grain boundaries. The abnormal grain growth (mainly caused by liquid-phase sintering) during the firing step may significantly affect the mechanical strength of BASE. Given the results mentioned above, we fabricated BASE containing some dopants (e.g., Mn, Ta, YSZ), by applying a one-step synthesis cum sintering process. In the BASE fabricated by applying a one-step synthesis cum sintering process, the mechanical strength and ionic conductivity increased with lower porosity and higher sintered density. The bending strength and specific resistance at 350°C were 314 MPa (authorized test, Korea Institute of Ceramic Engineering and Technology, KICET, Korea) and 5.67 Ω cm (authorized test, Korea Institute of Energy Research, KIER, Korea), respectively.
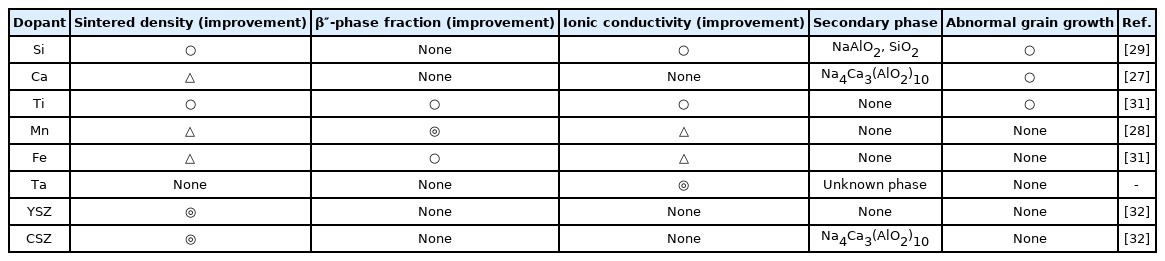
Summary of the characteristics of the sintered properties, secondary phase, and grain growth possibility of the sintered BASE with various dopants.

Arrhenius plots for the Mn-doped and Ta-doped Na–beta–alumina sintered specimen
The #1 and #2 prototype cells were fabricated using dopants doped-BASE, (Ni, Fe) cathode active material, and NaAlCl4 2nd electrolyte. Each cell was cycled with discharging and charging currents of (0.2, 0.4, and 0.8) A. The theoretical capacities of these cells are approximately 275 mAh g−1 (per the weight of Ni, Fe powders). The #1 prototype cell showed a charge capacity of 18.0 Ah (181.5 mAh g−1) and discharge capacity of 15.9 Ah (160.3 mAh g−1). The #2-1 prototype cell showed a charge capacity of 55.2 Ah (171.2 mAh g−1) and discharge capacity of 48.4 Ah (150.1 mAh g−1). The charge and discharge capacity were increased approximately 3 times by cell volume extension; however, the capacity per M (e.g., Ni, Fe) weight was decreased by approximately ~ 7%, because the theoretical capacity of Fe is higher than that of Ni [12,13]. Also, as the cell size increased, the difficulty of the NaAlCl4 melt soaking process in the cell fabrication process significantly increased. In the case of the Na–(Ni,Fe)Cl2 cell assembly process, it is important to control the influence of the contact characteristics between the NaAl-Cl4 2nd electrolyte and the cathode active material. Considering the energy and energy density of the cells, those values of the high Ni content cell were increased, although the capacity per M (e.g., Ni, Fe) was higher with the Ni/Fe=0.5/0.5 composition cell than with the Ni/Fe=0.8/0.2 composition cell. The #2-2 prototype cell showed a charge capacity of 48.7 Ah (151.1 mAh g−1), discharge capacity of 49.4 Ah (153.2 mAh g−1), and Coulombic efficiency of 101.4%. The charge–discharge capacity of the Na–(Ni,Fe)Cl2 cell was approximately (57–65)% (263 mAh g−1; 2nd cycle, theoretical capacity, 314 mAh g−1), compared to that of the 1.5 NF KIMS simple test cells (e.g., weight ratios of NaCl/Ni-Fe such as 1.0/1.5) [13]. Table 2 compares the charge–discharge capacities and energy densities etc., of the #1 and #2 prototype cells. Fig. 7 shows the detailed voltage profiles of the #1 and #2 prototype cells. Comparison of these voltage profiles of the #1 and #2-1 prototype cells showed that the #1 prototype voltage profile revealed low voltage curves, compared to the #2 prototype cell. The #2-2 prototype cell showed a much higher over-potential compared to the #2-1 prototype cell, resulting from the predominant cause of the high ohmic resistance of the cell, or the internal issue of cathode part (such as contact characteristics, or Ni poisoning by residual oxygen). The plateau of over 2.75 V in the charging cycle occurred by the effect of the overcharge reaction of Fe with NaAlCl4 melt in the Fe-added Na–NiCl2 cells. In order to avoid Fe overcharge reaction, the cut-off voltage of the charging cycle was preferred from (2.8 to 2.7) V.
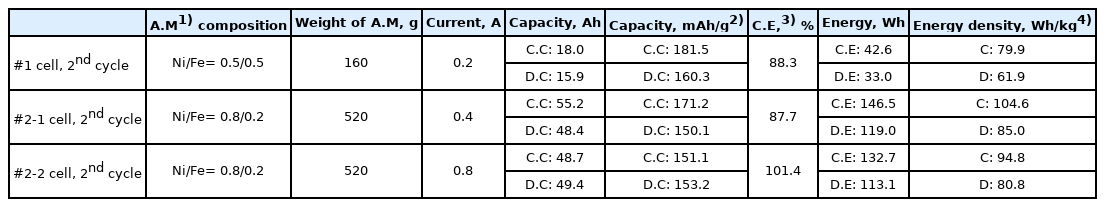
Comparison of the values of the charge/discharge capacity and charge/discharge energy.
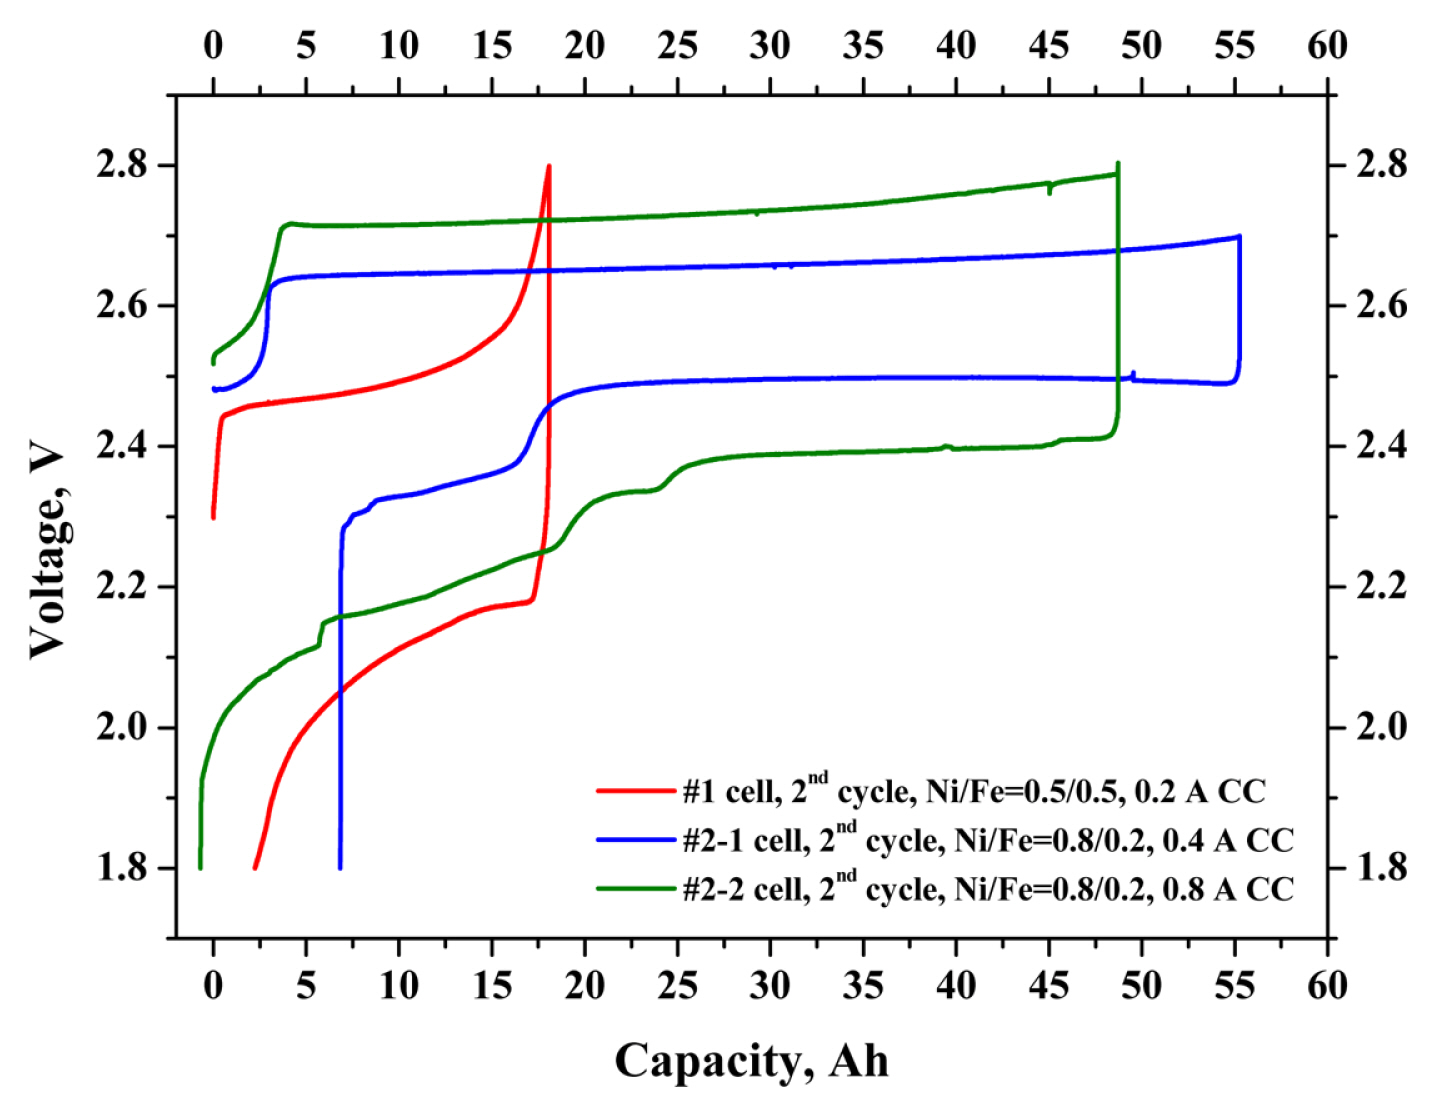
Voltage profiles for the #1 and #2 prototype Na–(Ni,Fe)Cl2 cells with different charging/discharging current of (0.2–0.8) A.
4. Conclusions
In this study, we present the first successful realization by a domestic technology of a full-scale pilot model of a cost-effective Na–(Ni,Fe)Cl2 battery over 40 Ah. One of the most challenging issues in the present study results is the higher over-potential in charge–discharge cycling at a low current rate; this is related to the cell ohmic resistance (e.g., BASE, NaAlCl4 melts, cell components etc.) and, as mentioned above, the internal issue of the cathode part. This paper provides information for each material for the Na–(Ni,Fe)Cl2 battery technology and the challenges ahead for further technology enhancement.
Notes
Conflict of interest
The authors declare that they have no conflict of interest.
Acknowledgements
This work was supported by a Korea Institute of Energy Technology Evaluation and Planning (KETEP) grant funded by the Korea government (No. 20172420108430, Development of high-capacity technology of high-safety sodium-ferronickel chloride battery). This paper was supported by Konkuk University Researcher Fund in 2019.