Modified Glassy Carbon Electrode with Silver Nanoparticles/Polyaniline/Reduced Graphene Oxide Nanocomposite for the Simultaneous Determination of Biocompounds in Biological Fluids
Article information
Abstract
The silver nanoparticles/polyaniline/reduced graphene oxide nanocomposite modified glassy carbon electrode (Ag/PANI/RGO/GCE) was prepared by the electrochemical method. The Ag/PANI/RGO nanocomposite was characterized by transmission electron microscopy (TEM), field emission scanning electron microscopy (FE-SEM), Raman spectroscopy, X-ray diffraction (XRD), and electrochemical impedance spectroscopy (ESI). Two electrochemical techniques namely differential pulse voltammetry (DPV) and cyclic voltammetry (CV) were used to the electrochemical behaviors investigation of ascorbic acid (AA), dopamine (DA), and uric acid (UA). The Ag/PANI/RGO/GCE exhibited remarkable electrocatalytic activity towards the oxidation reaction of AA, DA, and UA in Britton–Robinson (BR) solution (pH=4.0). Under the optimal conditions, the determinations of AA, DA, and UA were accomplished using DPV. AA–DA and DA–UA peak potential separations were 130 and 180 mV, respectively. For simultaneous detection, the linear response ranges were in the two concentration ranges of 0.05–0.8 mM and 2.0–16.0 mM with detection limit 0.412 μM (S/N = 3) for AA, 0.7–90.0 μM and 90.0–1000.0 μM with detection limit 0.023 μM (S/N = 3) for DA, and 0.8–70.0 μM and 70.0–1000.0 μM with detection limit 0.050 μM (S/N = 3) for UA. This modified electrode showed good sensitivity, selectivity, and stability with applied to determine AA, DA, and UA in human urine and drug.
1. Introduction
Ascorbic acid (AA), dopamine (DA), and uric acid (UA) are the important biomolecules, which usually coexist together in the extra cellular fluids of central nervous system and serum in mammals and considered as important molecules for physiological processes in human metabolism. The first species (AA) is a water-soluble vitamin with antioxidant properties and is known as a redox cofactor. It also helps in the treatment of common cold, mental illness, infertility, cancer, and AIDS [1]. The second specie (DA) or 3,4-Dihydroxyphenylethylamine is a member of catecholamine and have a neural messenger role in the brain and hormonal role in the blood. Lack of DA results in some serious diseases such as schizophrenia, Parkinson, and some other neuropsychiatric disorders. The absence of DA leads to some serious illnesses such as schizophrenia, Parkinson’s, and some other psychiatric disorders [2–4]. The third specie (UA) or 2,6,8-trihydroxypurine is degradation products of purine metabolism and is an important marker in clinical diagnosis because of the high concentration of that, causes high blood pressure, Lesch–Nyan obesity, gout, hyperuricemia, diabetes, high cholesterol, kidney, and heart disease [5]. For determination of small biomolecules, electrochemical methods due to their high sensitivity and selectivity, simple operation, having short measurement times, and low expense, have been received considerable attention. To determine small biomolecules, electrochemical methods have been considered due to their high selective and sensitivity, simple operation, short measurement time and low cost [6]. Though, the major problem of electrochemical methods is that the voltammetric response of these electro active species are too close and overlapped at the unmodified electrode, and make it difficult to use them for simultaneous determination [7]. In order to resolve this problem, various materials such as graphene, conductive polymers, and metal nanoparticles have been used to modify electrodes. Reduced graphene oxide (RGO) among the nanomaterials, due to the thinnest two-dimensional carbon structure, has received great attention in the field of electroanalytical chemistry and has been used as electrocatalysts for sensing numerous analytes [8]. The most common types of conductive polymer, Polyaniline (PANI) have unique features like good environmental stability, interesting electroactivity, easy synthesis, low monomer cost, reversible redox behaviour, and thermal stability and unusual doping chemistry. The polymer/RGO nanocomposites caused to a synergistic effect and provide the composite material to possess improving electrochemical performance devices and have been used to overcome the aggregation and to confer stability to the RGO nanosheets formed. PANI has low processing ability, and weak mechanical strength and these are the main defects of PANI usage. For resolving this problem, we can compose PANI with metal oxide nanoparticles and so the mechanical strength, thermal stability and characteristics of this composite could be enhanced [9]. In the development of electrochemical sensors, metal nanoparticles (MNPs) have been widely used. Among metal nanoparticles, silver nanoparticles (AgNPs) due to their biocompatibility with various biomolecules have widely used in the development of electrochemical sensors. Incorporating Ag into these polymers can provide the higher catalytic Activity [10]. Besides Nanocomposites consist of PANI and Ag nanoparticles have a potential applications in electrocatalysis and electronic devices [11,12]. Various modifications have been used for the simultaneous determination of AA, DA, and UA. For example PPy hydrogel/GCE [13], ZnO–CuxO/polypyrrole nanocomposite modified GCE [14], and ERGO/GCE [15].
In this study, we focused on the fabrication a relatively simple Ag/PANI/RGO nanocomposite by potentiostatic method. The graphene oxide was electrochemically deposited and reduced simultaneously to form RGO. After that, in situ electrochemical synthesis of polyaniline nanofibers accomplished to prepare PANI/RGO nanocomposite. Then Ag nanoparticles were electrodeposited on the PANI/RGO to form Ag/PANI/RGO nanocomposite and was used for the simultaneous determination of AA, DA, and UA by cyclic voltammetry (CV) and differential pulse voltammetry (DPV) techniques successfully.
2. Experimental
2.1. Instruments
A Sama electroanalyzer (Iran) with three electrode systems (a Pt wire as the counter electrode, a bare or modified glassy carbon electrode (GCE) as the working electrode, and an Ag/AgCl saturated electrode as the reference electrode) were used for electrochemical tests. To investigating the morphology of the nanocomposites field emission scanning electron microscopy (FE-SEM) (Zeiss Sigma VP, Germany) at an accelerating voltage of 20 kV was used. As-prepared samples were characterized by X-ray diffraction (XRD) (X’Pert MPD, Philips, Netherlands) for phase structure study. Raman Spectrometer with a 532-nm laser beam at 30 mW and a charge-coupled device detector with a 4 cm−1 resolution were used for recording the raman spectrum. Electrochemical impedance spectroscopy (EIS) was performed by Zahnner PP201, Germany, that was a 4-quadrant power potentiostat designed to apply and sink high currents up to 20 A at a voltage range of 10V. The total power dissipation of the PP201 was 200 W by Zahner Zennium. In addition, Metrohm Model 691 pH meter and Wise Clean Ulrasonic were used.
2.2. Reagents and Materials
Aniline, ascorbic acid, dopamine, and uric acid were purchased from Sigma-Aldrich. Sodium hydroxide, silver nitrate, potassium nitrate, magnesium sulfate, graphite powder (99%), and hydrochloric acid prepared from Merck. All the chemical were analytical grade and used with out further purification. Doubly distilled water was used throughout. Britton–Robinson buffer solution (pH=4.0) was employed as a supporting electrolyte. All the experiments were conducted at ambient temperature (252°C).
2.3. Preparation of the modified electrodes
At first, the GCE surface was polished with 0.05–3 μm alumina slurries and then the electrode washed ultrasonically in 1:1 double-distilled water and ethanol for 5 min to remove the physically adsorbed particles. Next, the electrode was cleaned electrochemically by cycling the electrode potential between −0.5 and +1.5 V vs. Ag/AgCl in 0.5 M sulfuric acid, until reproducible voltammograms were observed. The GO was deposited and reduced simultaneously on GCE by an electrochemical reduction process in a solution containing 10 mg L−1 GO and 10 ppm MgSO4 by applying a constant potential of −2.0 V for 100 s [16]. Electrochemical deposition of PANI on RGO/GCE was performed at ambient temperature and 1.0 V potential vs. Ag/AgCl for 150 s in an aqueous solution (50 mM aniline and 1 M HCl). After the previous step, the modified electrode was rinsed thoroughly with double distilled water and transferred into a voltammetric cell containing 0.1 M NaOH solution for electrochemical over-oxidation of the conductive PANI film by cycling the potential between −0.1 and 1.5 V at a scan rate 100 mV/s [16]. The obtained electrode was ready for use after a final wash with double distilled water and named as PANI/RGO/GCE. The double-pulse potentiostatic technique was used for electrodeposition of Ag NPs onto the surface of PANI/RGO/GCE from an aqueous solution containing 10.0 mM Ag(NO3)2 and 0.1 M KNO3 electrolyte. The pulse parameters were as follows:Nucleation pulse: E1= −1.335 V vs. Ag/AgCl; t1=1s. Growth pulse: E2=−0.7 V vs. Ag/AgCl; t2=100 s [17]. The Ag nanoparticles modified PANI/RGO/GCE was washed with double-distilled water and denoted as Ag/PANI/RGO/GCE. All the procedures are shown in Scheme 1 briefly.
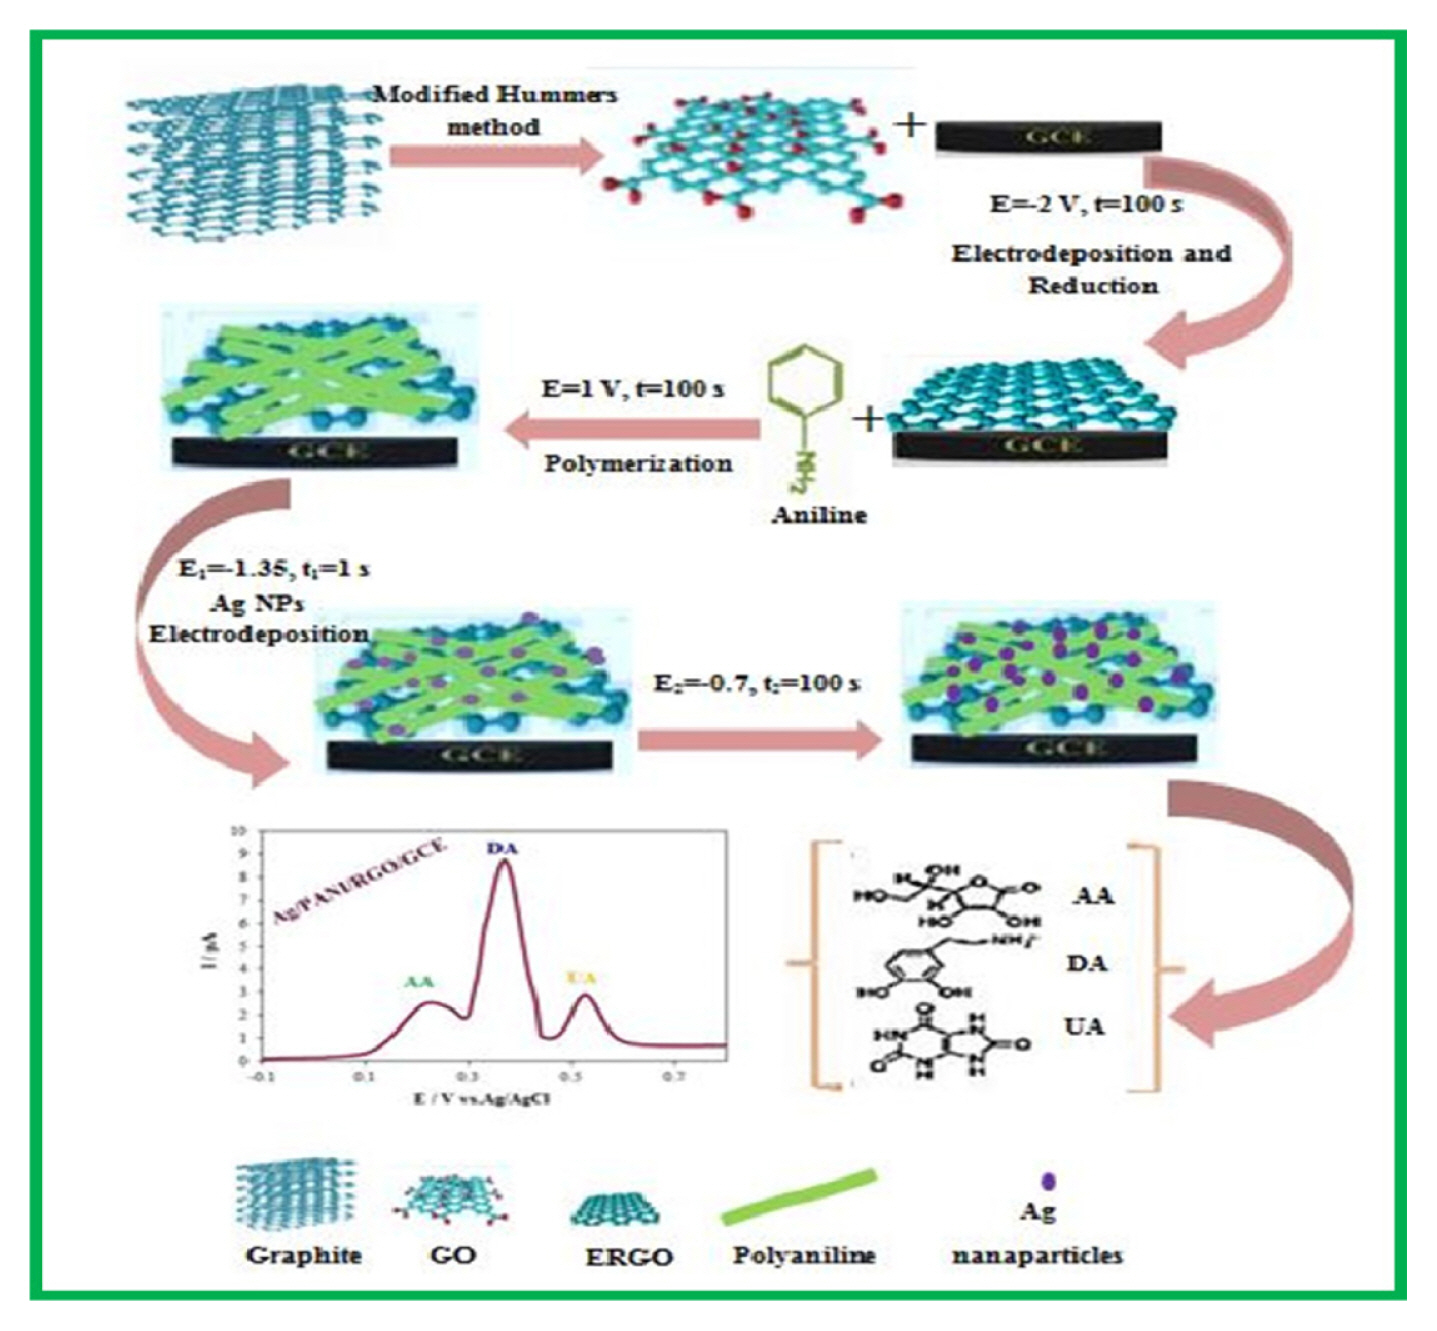
Steps for preparation of Ag/PANI/RGO/GCE.
3. Results and Discussion
3.1. Characterization of the Ag/PANI/RGO nanocomposite
The surface morphologies of the modified electrodes were obtained by FE-SEM and TEM. The FE-SEM image (Fig. 1a) confirms the formation of RGO thin film on GCE and exhibits layered morphology like the wrinkled waves with the average thickness of several nanometers due to the formation of RGO. Fig. 1b shows PANI nanofibers/RGO nanocomposite, which is clean and relatively smooth with the diameter of about 100 nm. As shown in Fig. 1c, Ag nanoparticles with a diameter of ~100 nm were well-dispersed on the RGO. Fig. 1d shows the morphology of the Ag/PANI/RGO nanocomposite, in which Ag nanoparticles are homogeneously attached on the surface and aligned along the PANI nanofibers uniformly. The small size and homogeneous distribution of Ag nanoparticles bring about many advantageous properties such as large surface area, good catalysis, and large numbers of active sites, which are conductive to a modification in the stability and sensitivity of Ag/PANI/RGO/GCE into biomolecules oxidation. The formation of Ag/PANI/RGO was also investigated using TEM. Fig. 1e shows a low-magnification TEM image, which clearly shows the well-dispersed silver nanoparticles on the surface of RGO and PANI nanofibers. The diameter of PANI nanofibers were about 100 nm and the sizes of the silver nanoparticles were about 100 nm. The existence of high dense silver nanoparticles in PANI and RGO matrix agreed with the data obtained from FE-SEM.

SEM pictures of (a) RGO, (b) PANI/RGO, (c) Ag/RGO, (d) Ag/PANI/RGO, and (e) TEM picture of Ag/PANI/RGO.
The crystal structure Ag/PANI/RGO nanocomposite was studied by X-ray diffraction (XRD). As shown in the Fig. 2, the peak appeared at 2Θ value 22.65 is related to RGO [18]. The broad peak at the 2θ value at 25–35 appeared is related to PANI which was due to amorphous nature of that, revealing the presence of PANI in the composites [19]. The sharp peaks at 2θ values 37, 44.5, 52 and 76.5 can be related to the face centered cubic (fcc) phase of silver (111), (200), (220), and (311), respectively [20] and are in good agreement with the reported data (JCPDS File No. 04–0783). The existence of sharp peaks clearly indicates the presence of silver nanoparticles in the nanocomposites with their crystalline nature.
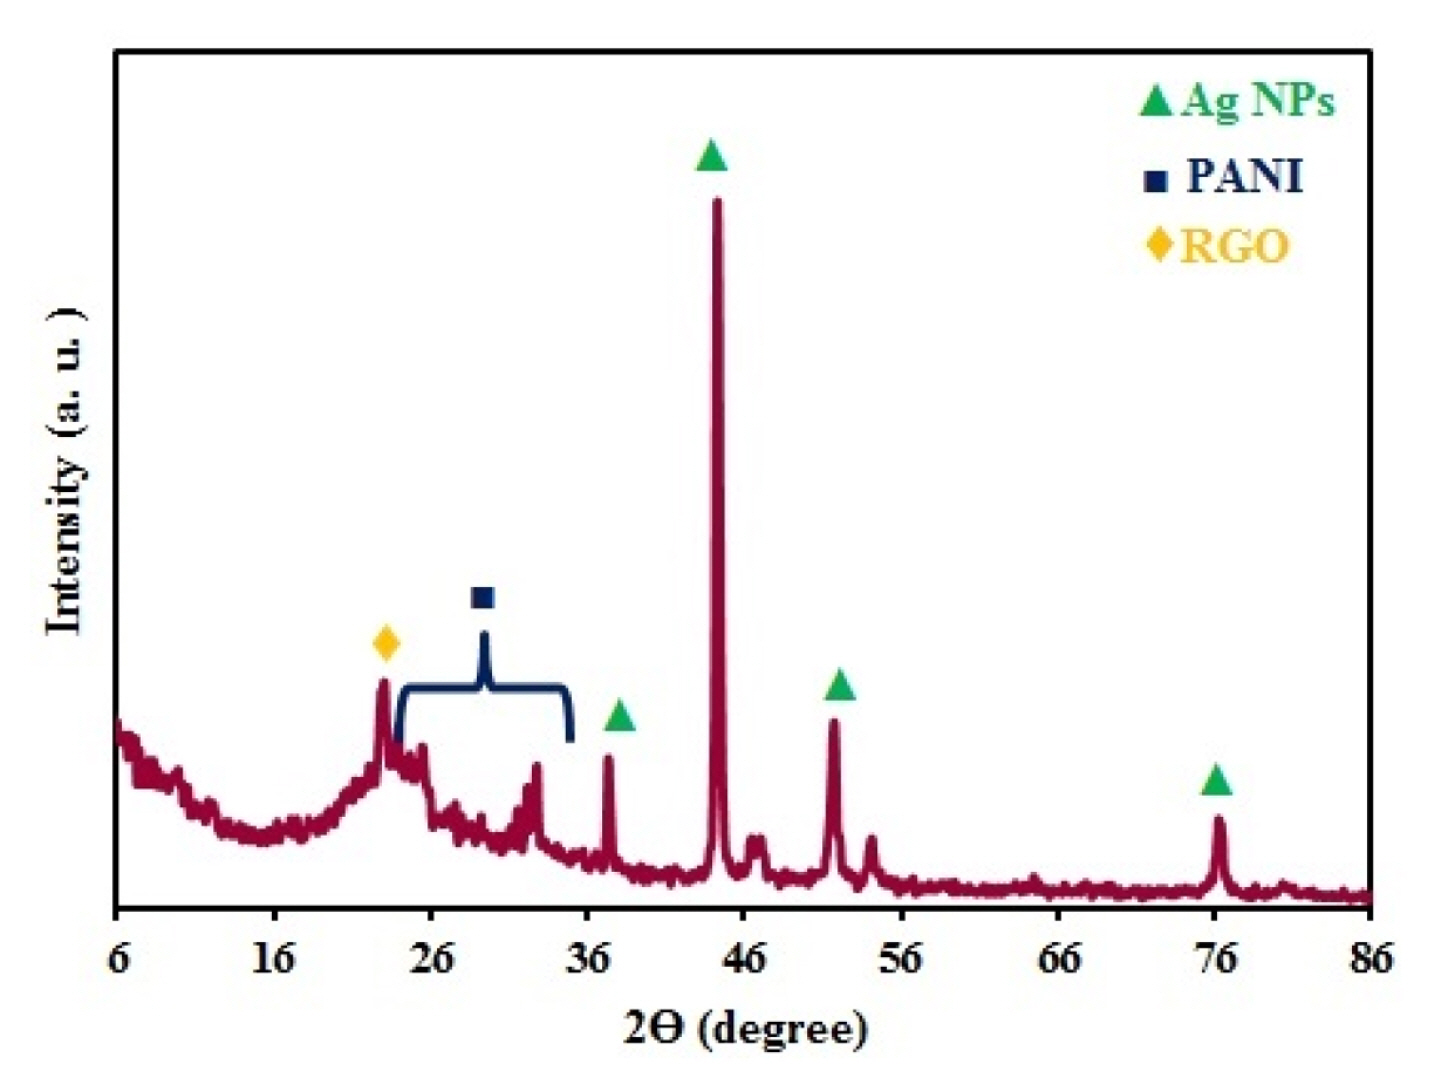
XRD pattern of Ag/PANI/RGO nanocomposite.
The electrochemical impedance spectroscopy (EIS) is an immense technique for characterization of interfaces of modified electrodes. Fig. 3 show the Nyquist plots of impedance spectra for bare GCE, RGO/GCE, PANI/RGO/GCE, and Ag/PANI/RGO/GCE in 0.1 M KCl solution which contained 1 mM Fe(CN)63−/4−(1:1). The Nyquist plots show two areas: a semicircular part related to electron transfer process at high frequencies, and a linear part related to diffusion control at lower frequencies. According to the Fig. 3, it is obvious that bare GCE exhibits large diameter with more charge transfer resistance (Rct), but when the GCE modified, diameter of Nyquist plots changes and results in low value of Rct. The Rct values are 4100, 3200, 1700, and 1100 Ω for bare GCE, RGO/GCE, PANI/RGO/GCE, and Ag/PANI/RGO/GCE, respectively. As mentioned, after the modification of the GCE with RGO, the Rct value reduced and the reason can be related because the RGO layer protects various small band gaps, which are agreeable for the electron conduction [21]. The decrease of semicircle diameter and Rct value for PANI/RGO/GCE is also because of a synergistic effect of RGO and PANI and this synergistic effect lead to the interfacial electron transfer ability and the redox reaction of the probe improvement on the electrode surface. The lowest Rct was observed at the Ag/PANI/RGO/GCE surface and this decrease greatly improves the conductivity of the electrode surface. All of these results confirm that the Ag/PANI/RGO/GCE is an ideal modified electrode as a sensor.
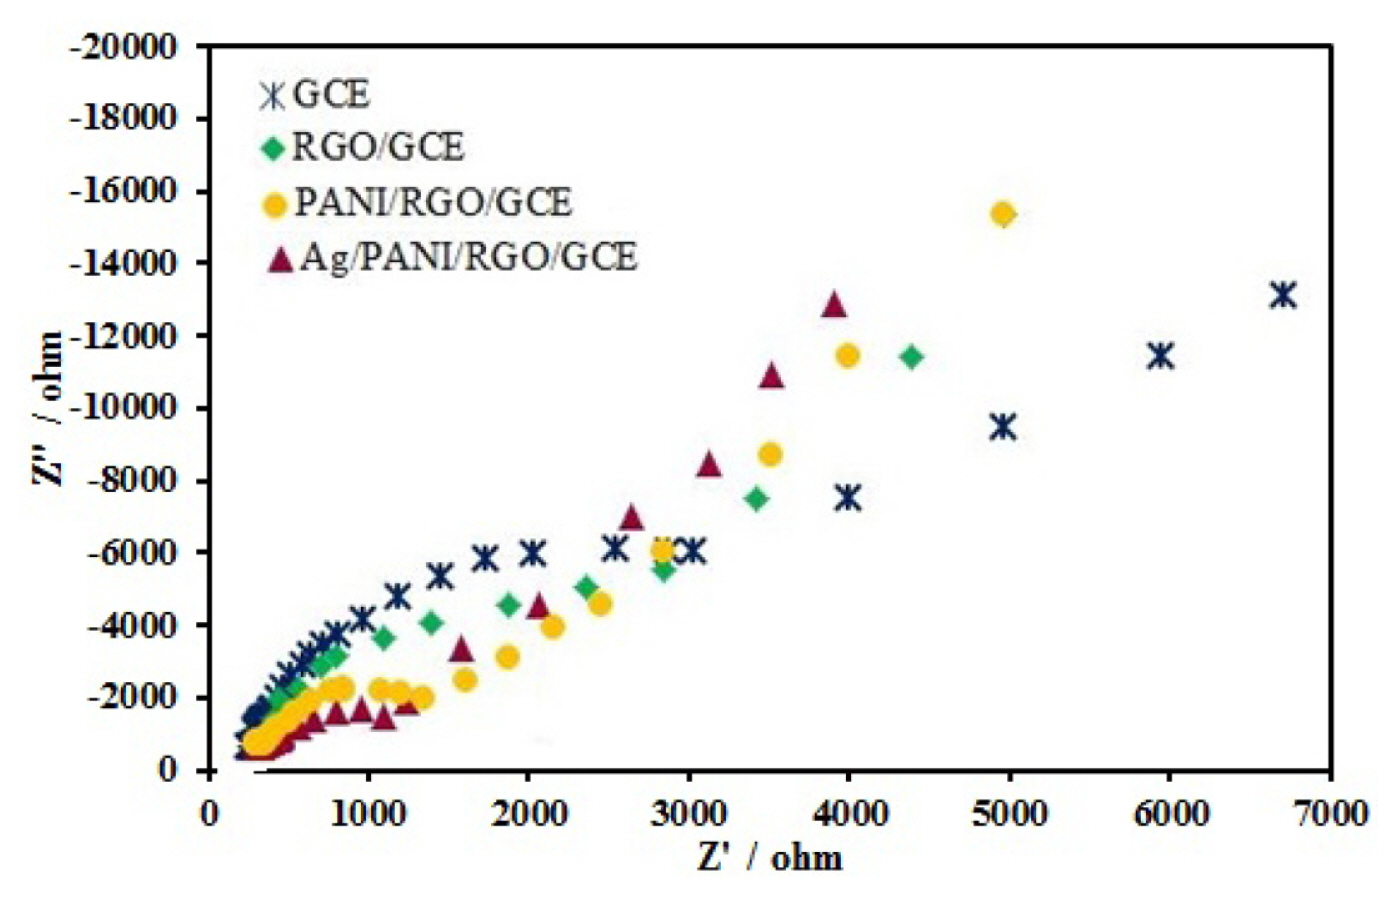
Nyquist plots for EIS measurements in the presence of equimolar 1 mmol L−1 Fe(CN)63−/4− with 0.1 mol L−1 KNO3 as electrolyte at (*) bare GCE, (◆) RGO/GCE, (●) PANI/RGO/GCE, and (▲) Ag/ PANI/RGO/GCE.
3.2. Electrochemical behavior of AA, DA, and UA at the surface of various electrodes
Fig. 4 show the cyclic voltammograms (CVs) of 10 mM AA, 1.0 mM DA, and 10 mM UA in 0.1 M Britton–Robinson (BR) buffer solution at the bare GCE, RGO/GCE, PANI/RGO/GCE, and Ag/PANI/RGO/GCE. At the bare GCE surface, AA and UA showed broad oxidation peaks with the peak potentials at approximately 0.6 and 0.7 V, respectively and DA exhibits poor oxidation peak, anodic peak at the potential of 0.65 V and cathodic peak at the potential of 0.15 V. As expected, the oxidation peak separation of AA, DA, and UA at bare GCE is impossible. In the case of RGO/GCE, AA and UA had peak potentials at 0.57 V and 0.58 V, respectively and DA anodic and cathodic peak potentials appeared at 0.47 V and 0.23 V respectively. The anodic peak currents are enhanced by about 1.5 folds in comparison with the anodic peak currents on the bare GCE. The uses of RGO in the nanocomposite increase the surface area available for reaction as well as the fast electron transfer kinetics. For PANI/RGO/GCE, the corresponding oxidation peak potentials of AA and UA shifted to 0.31 and 0.54 V, respectively. The anodic and cathodic peak potentials of DA appeared at 0.38 and 0.28 V, respectively. In the case of Ag/PANI/RGO/GCE, AA and UA had irreversible peak potentials at 0.24 V and 0.52 V, respectively. DA had a reversible peak, anodic and cathodic peak potentials appeared at 0.36 V and 0.32 V, respectively. The decrease in oxidation over potential accompanied by a remarkable increase in oxidation currents of three compounds. The peaks separation of AA-DA, and DA-UA were 0.12 V and 0.16 V, respectively. All of these results confirm that Ag/PANI/RGO not only speeds up the oxidation of AA, DA, and UA but also significantly enlarges the peak separation between AA-DA, and DA-UA. The network like structure of PANI/RGO nanocomposite leads to more conductivity and extra proper surface area for electrodeposition of Ag nanoparticles. The synergistic effects between AgNPs, RGO and PANI would be beneficial for the kinetics of electron transfer, and could lead to good electrochemical performance of modified electrodes, and facilitate the electrochemical oxidation of AA, DA, and UA.
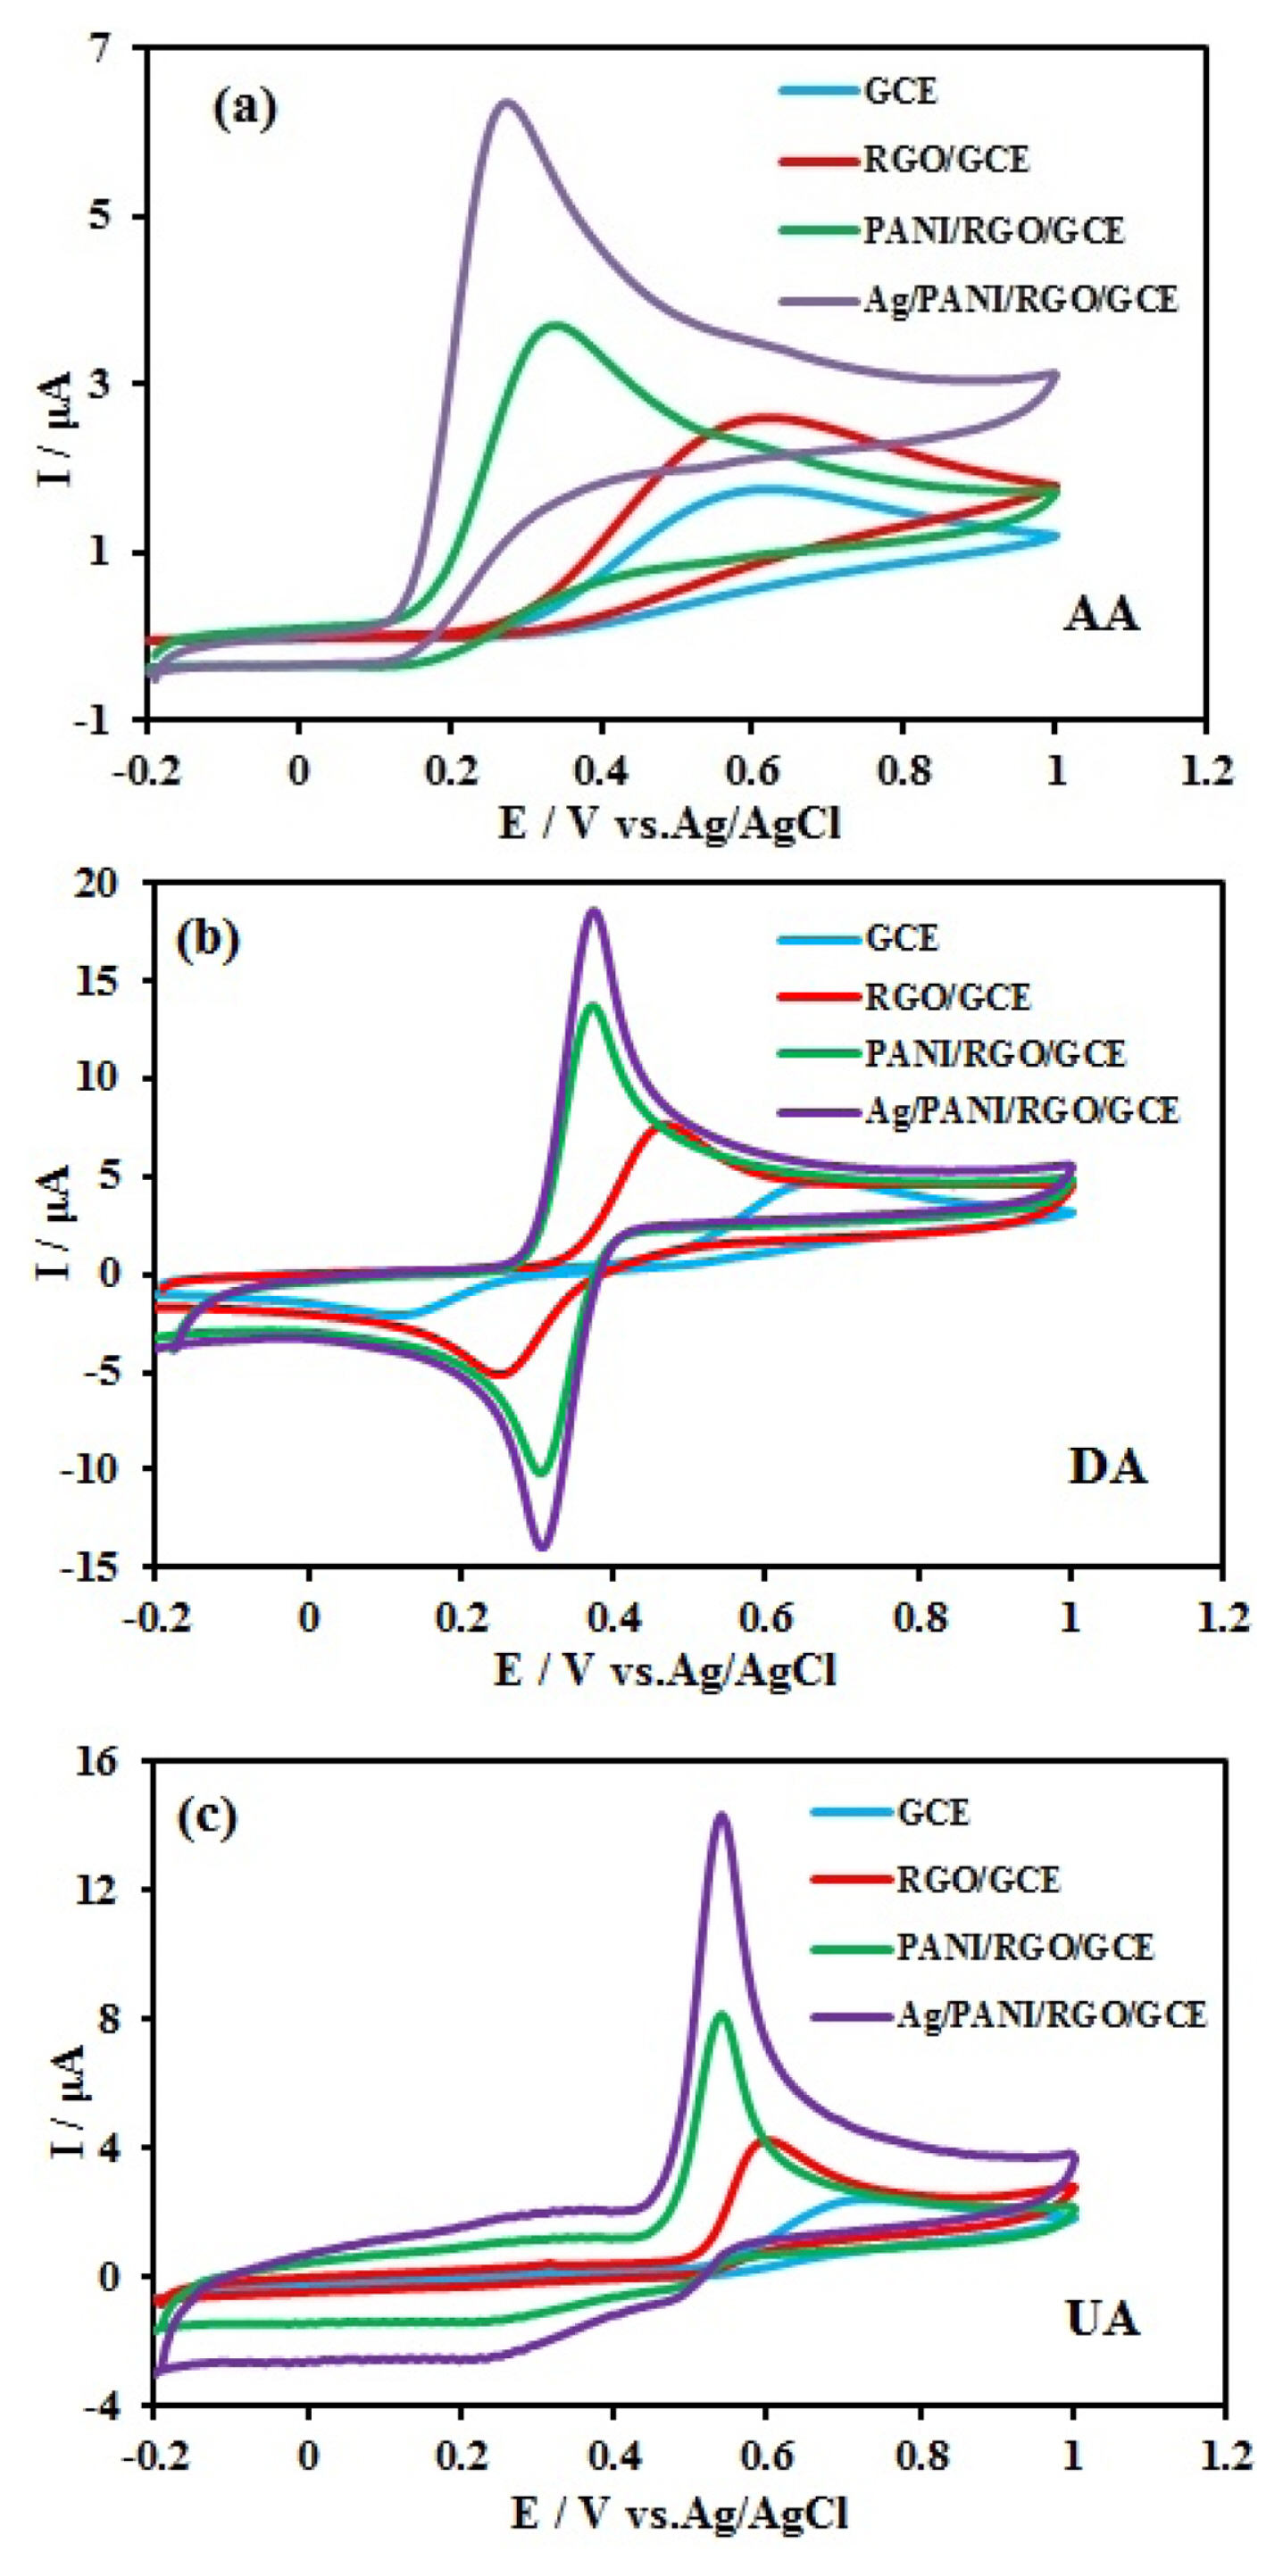
Cyclic voltammograms of the 10 mM AA (a), 1.0 mM DA (b), and 10.0 mM UA (c) at the bare GCE (blue) RGO/GCE (red), PANI/RGO/GCE (green), and Ag/PANI/RGO/GCE (Pourpre) in 0.1 M BR (pH 4.0) at a scan rate of 50 mV s−1.
3.3. The effect of pH on the electrochemical oxidation of AA, DA, and UA
To investigate the effect of solution pH on the electrochemical behavior of 10 mM AA, 1.0 mM DA, and 10 mM UA at the Ag/PANI/RGO/GCE, CV method was used in the pH range (pH= 2.5–5.0) and the results are shown in the Fig. 5. As the results show, The oxidation peak currents for all three compounds increased gradually as raising pH, and peaked at pH 4.0 and then reduced significantly with the increase of pH. With due attention to the obtained results, pH 4.0 was chosen as an optimum solution pH for further experiments. the peak currents for all three compounds were suitable at pH=4.0. Therefore all of the other experiments were done at this pH. Fig. 5 (insets) show the relationship between oxidation peak potential and pH of AA, DA, and UA solutions. The corresponding oxidation peak potentials vary linearly with pH as follows:

Cyclic voltammograms of the (a) 10 mM AA, (b) 1.0 mM DA and (c) 10.0 mM UA at the Ag/PANI/RGO/GCE at different pH (a=2.5 to f=5.0) in 0.1 M BR. Scan rate 50 mV/s; pulse amplitude 25 mV.
The slopes indicated that the number of transferred protons and electrons are equal for DA, and UA oxidation and one proton and two electrons for AA.
3.4. The effect of Scan Rate
The effect of potential scan rate on the oxidation responses of 10 mM AA, 1.0 mM DA, and 10 mM UA at the Ag/PANI/RGO/GCE was investigated using CV method in the range of 10–200 mV/s and the results are shown in the Fig. 6. The relationship between the three species currents and the square root of the scan rates is linear and this issue confirms that the processes are diffusion controlled as follows:
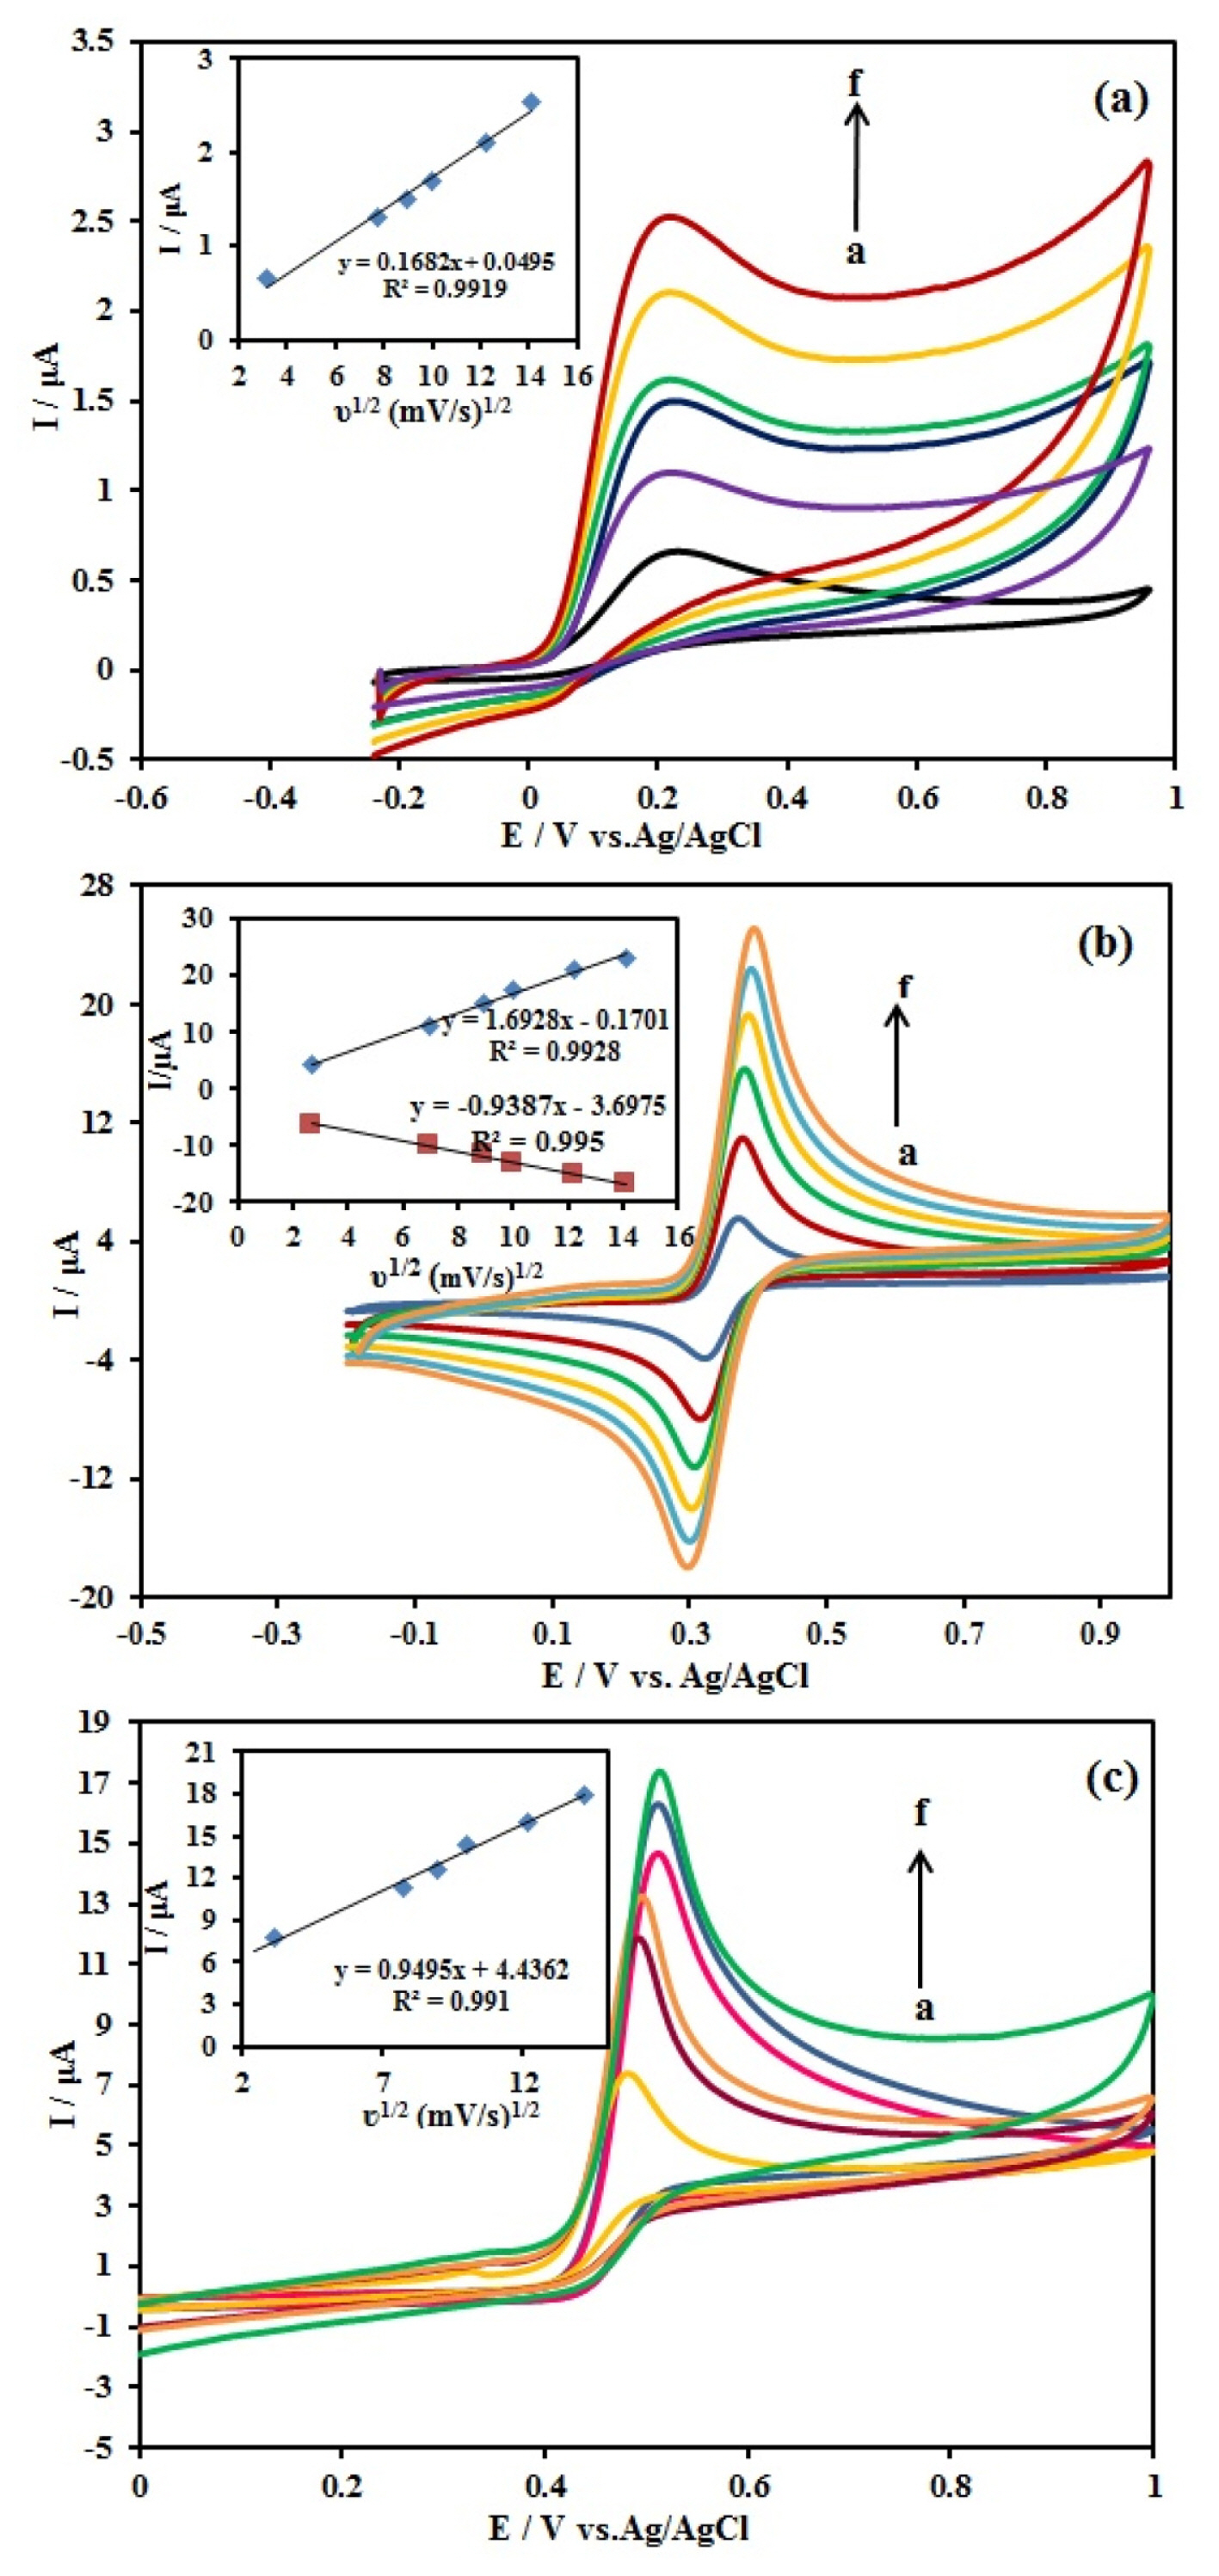
Cyclic voltammograms of the (a) 10 mM AA, (b) 1.0 mM DA and (c) 10.0 mM UA at the Ag/PANI/RGO/GCE in 0.1 M BR (pH 4.0) at different scan rates (a=10 to f=200 mV/s) Inset a plot of Ip vs. ν1/2, Scan rate, 50 mV/s; pulse amplitude 25 mV.
3.5. Individual and simultaneous voltammetric determination of AA, DA, and UA
AA, DA, and UA are electro active biomolecules that simultaneously are coexist in serum and other extra cellular body fluids. In order to investigate the potency of the Ag/PANI/RGO/GCE in the simultaneous determination of AA, DA, and UA, the differential pulse voltammetry (DPV) method was used for detection and quantification of these three species in the mixture of 1000 μM AA, 80 μM DA and 800 μM UA in 0.1 M Britton–Robinson (BR) buffer solution (pH 4). Fig. 7 displays the DPVs of the electrochemical oxidation of AA, DA, and UA at these surfaces: bare GCE, RGO/GCE, PANI/RGO/GCE, and Ag/PANI/RGO/GCE. At the bare GCE and RGO/GCE surfaces, the oxidation peaks of AA, DA, and UA completely overlapped and a broad overlapped peak at 0.57 V and 0.54 V respectively had seen. These results were indicated that these oxidation peaks cannot be distinguished at bare GCE and RGO/GCE surfaces. At the surface of the PANI/RGO/GCE, the overlapped voltammetric peak was resolved into two peaks at approximately 0.38 V and 0.54 V, and the peak potentials of AA, DA, and UA cannot be separated completely. Finally, at Ag/PANI/RGO/GCE surface, three peaks at the potentials of 0.24, 0.36, and 0.52 V appeared that were related to AA, DA, and UA, respectively. In addition, the peak currents of these species were notably improved. The separation of the oxidation peak potentials for AA–DA and DA-UA were about 130 mV and 180 mV, respectively.
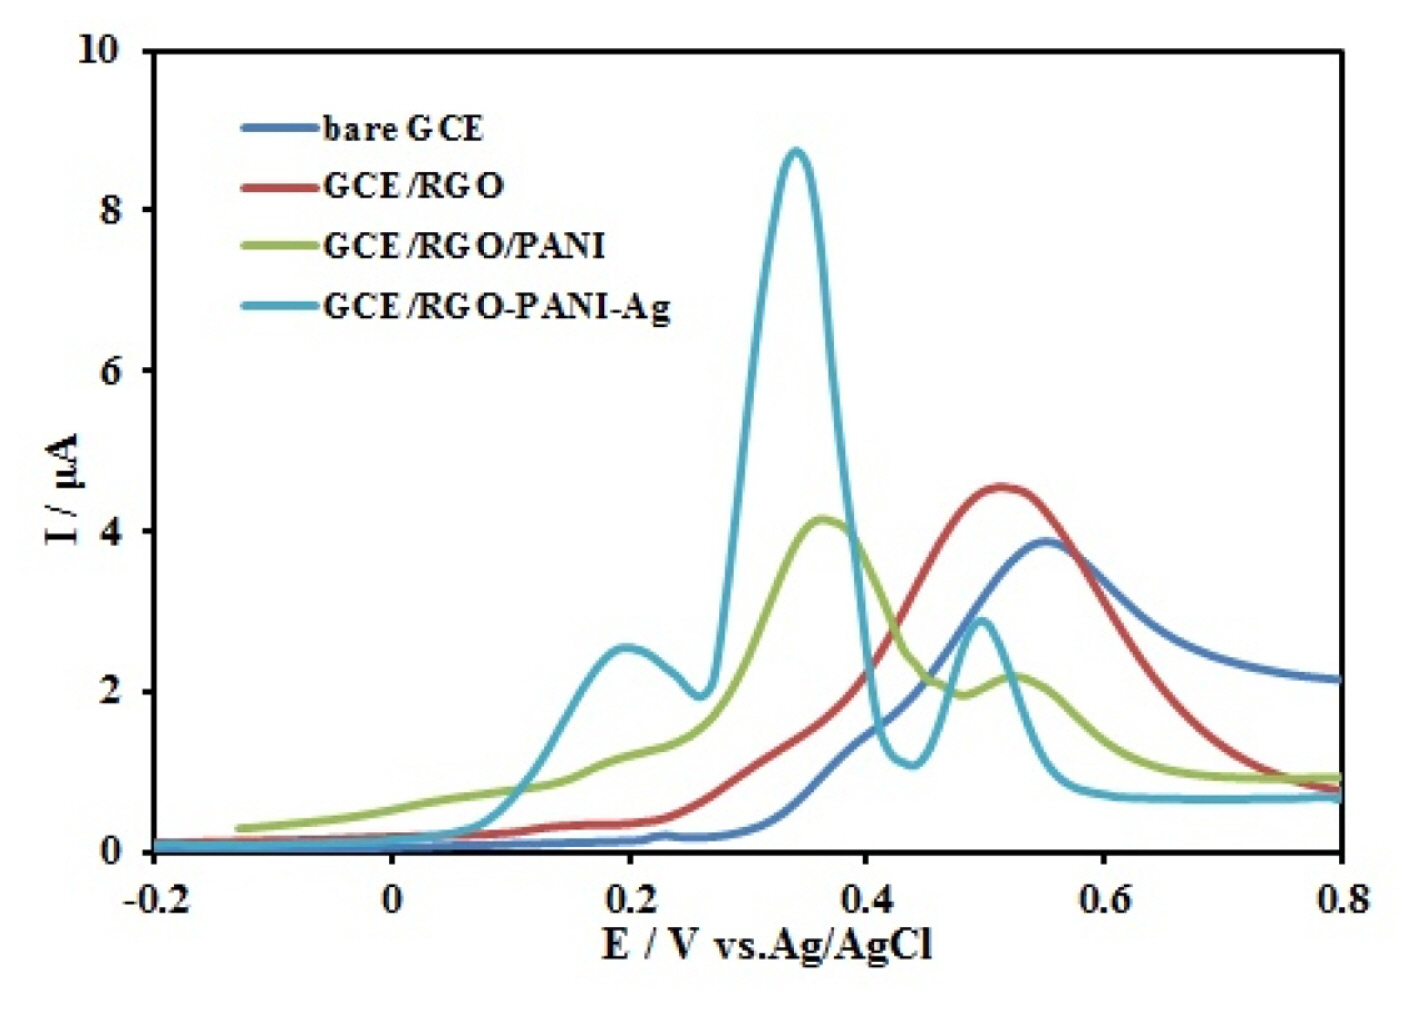
DPVs of a mixture of the 100.0 μM AA, 80.0 μM DA and 800.0 μM UA; at the surface of a bare GCE, RGO/GCE, PANI/RGO/GCE, and Ag/PANI/RGO/GCE. DPV experimental conditions: pulse amplitude of 50 mV, pulse time of 100 ms, sweep rate of 50 mV/s, in 0.1 M BR (pH 4.0).
At the next step, DPV method was used to obtain the linear concentration ranges and detection limits. For this purpose, the DPVs were recorded and concentration of one of the compounds was changed individually. The results are shown in (Fig. 8a–c). The peak currents for AA, DA, and UA increased linearly with an increase in their respective concentration. In the case of AA (Fig. 8a), the peak current increased with rising the AA concentration. The peak current of AA increased linearly in the two ranges of 0.01–0.4 mM with the linear function of Ip,AA (μA) = 7.9769 CAA (mM) + 0.5373 (R2 = 0.9913), and 0.4–14 mM with the linear function of Ip,AA (μA) = 0.1859 CAA (mM) + 3.8389 (R2 = 0.9919), with a detection limit (S/N=3) 0.125 μM. For DA (Fig. 8b), the peak current increased with rising the DA concentration. The peak current of DA increased linearly in the two ranges of 0.07–50.0 μM with the linear function of Ip,DA (μA) = 0.1057 CDA (μM) + 1.64 (R2 = 0.99), and 50.0–100.0 μM with the linear function of Ip,DA (μA) = 0.0098 CDA (μM) + 6.65 (R2 = 0.9925), with a detection limit (S/N=3) 9.5 nM. Also for UA (Fig. 8c), when the concentration increased, the peak current increased. The peak current of UA increased linearly in the two ranges of 0.5–10.0 μM with the linear function of Ip,UA (μA) = 0.0974 CUA (μM) + 0.4281 (R2 = 0.9904), and 30.0–1000.0 μM with the linear function of Ip,UA (μA) = 0.0032 CUA (μM) + 1.863 (R2 = 0.9901), with a detection limit (S/N=3) 0.01 μM.
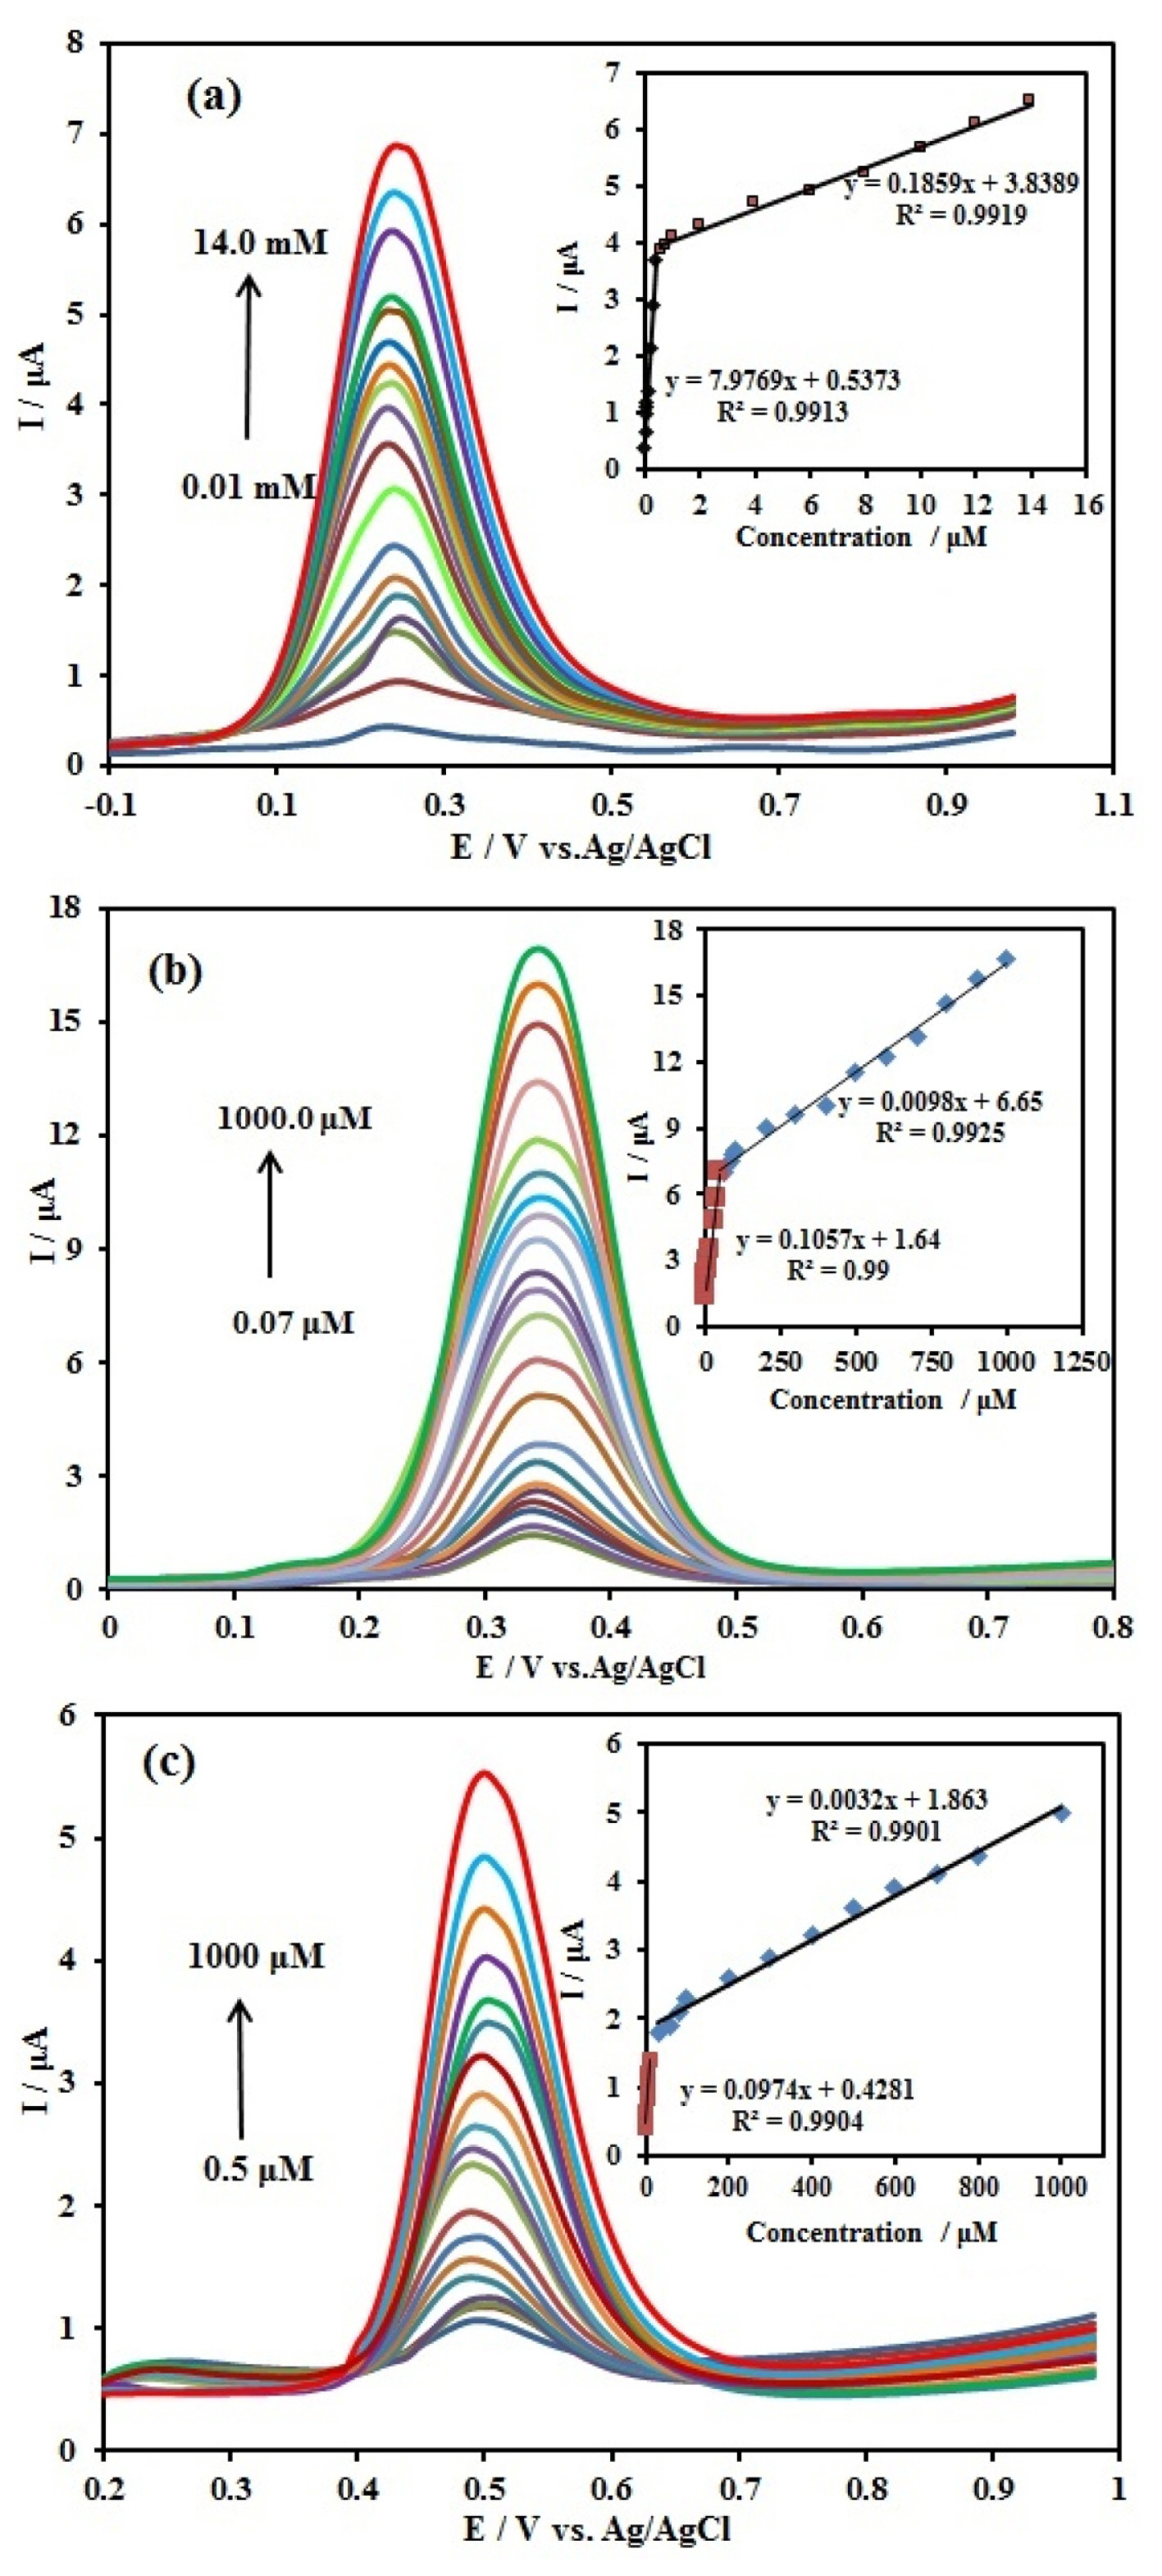
DPVs at the Ag/PANI/GO/GCE in 0.1 M BR (pH 4.0) containing different concentrations of (a) AA from 0.01 to 14.0 mM, (b) DA from 0.07 to 1000 μM and (c) UA from 0.5 to 1000 μM. Scan rate: 50 mV s−1 pulse amplitude 50 mV. Insets: the calibration plots of the peak current vs. sample concentrations.
DPV experiments were also carried out for simultaneous determination of AA, DA, and UA with increasing the one specie concentration, whereas the other two species concentrations were kept constant (Fig. 9a–c). The obtained results showed that when the AA concentration increased, but DA and UA had constant concentrations which were 2 μM and 4 μM respectively, AA peak currents increased linearly in the two concentration from 0.05–0.8 mM with the linear function Ip,AA (μA) = 2.3465 CAA (mM) + 1.9045 (R2 = 0.9846), and 2–16 mM with the linear function Ip,AA (μA) =0.1184 CAA (mM) + 3.633 (R2 = 0.9902) (Fig. 9a). The detection limit of AA were calculated to be 0.412 μM (S/N=3). In the case of DA (Fig. 9b), when DA concentration increased, but the AA and UA concentration were kept constant at 12 mM and 0.9 mM respectively the results are as follow: DA peak currents increased linearly in the two concentration from 0.7–90.0 μM with the linear function Ip,DA (μA) = 0.0425 CDA (μM) + 5.4617 (R2 = 0.9913), and 90.0–1000.0 μM with the linear function Ip,DA (μA) =0.0046 CDA (μM) + 9.14422 (R2 = 0.9915). The detection limit of DA were calculated to be 0.023 μM (S/N=3). For UA, when the UA concentration vary, but AA and DA had constant concentrations which were 20 μM and 0.07 μM respectively, UA peak currents increased linearly in the two concentration from 0.8–70.0 μM with the linear function Ip,UA (μA) = 0.0193 CUA (μM) + 0.5138 (R2 = 0.99), and 70.0–1000.0 μM with the linear function Ip,UA (μA) =0.0023 CUA (μM) + 1.6079 (R2 = 0.992). The detection limit of UA were calculated to be 0.05 μM (S/N=3) (Fig. 9c).

DPVs at the Ag/PANI/RGO/GCE in 0.1 M BR (pH 4.0). (a) 2.0 μM DA, 4.0 μM UA and different concentrations of AA from 0.05 to 16 mM, (b) 12 mM AA, 0.9 mM UA and different concentrations of DA from 0.7 to 1000 μM; and (c) 20 μM AA, 0.07 μM DA and different concentrations of UA from 0.8 to 1000 μM. Scan rate: 50 mV s−1 pulse amplitude 50 mV. Insets: the calibration plots of the peak current vs. sample concentrations.
Finally, Table 1 compares the analytical performance for the determination of AA, DA, and UA at variously modified electrodes reported in previous works and the results indicate that the Ag/PANI/RGO/GCE could be used for simultaneous determination of AA, DA, and UA with high sensitivity and selectivity.

Comparison for simultaneous determinations of DA and UA at different modified electrodes.
3.6. Interferences studies
The common interferences of other species coexisted with AA, DA, and UA in body fluids were investigated. When the concentrations of AA, DA, and UA were 50 μM, no significant interference was observed from the following compounds: 0.3 mM cysteine, lysine and glucose; 100-fold of them. These results implied the good selectivity of the Ag/PANI/RGO/GCE for simultaneous determination of AA, DA and UA (Table 2).

Interferences of some foreign substances for 50 μM of AA, DA, and UA
3.7. Reproducibility, and stability of the Ag/PANI/RGO/GCE
In order to evaluate the reproducibility of the Ag/PANI/RGO/GCE for the simultaneous determination of AA, DA, and UA, five sensors were prepared independently under the same conditions. These electrodes were used for 10 successive DPV measurements in a mixture of 1 mM AA,0.08 mM DA, and 0.9 mM UA in Britton-Robinson buffer solution (pH 4.0). The results are shown in Fig. 10a and the relative standard deviations (RSD) of the DPV response currents for these species were less than 3.5%. The good reproducibility demonstrated the reliability of the detection results.
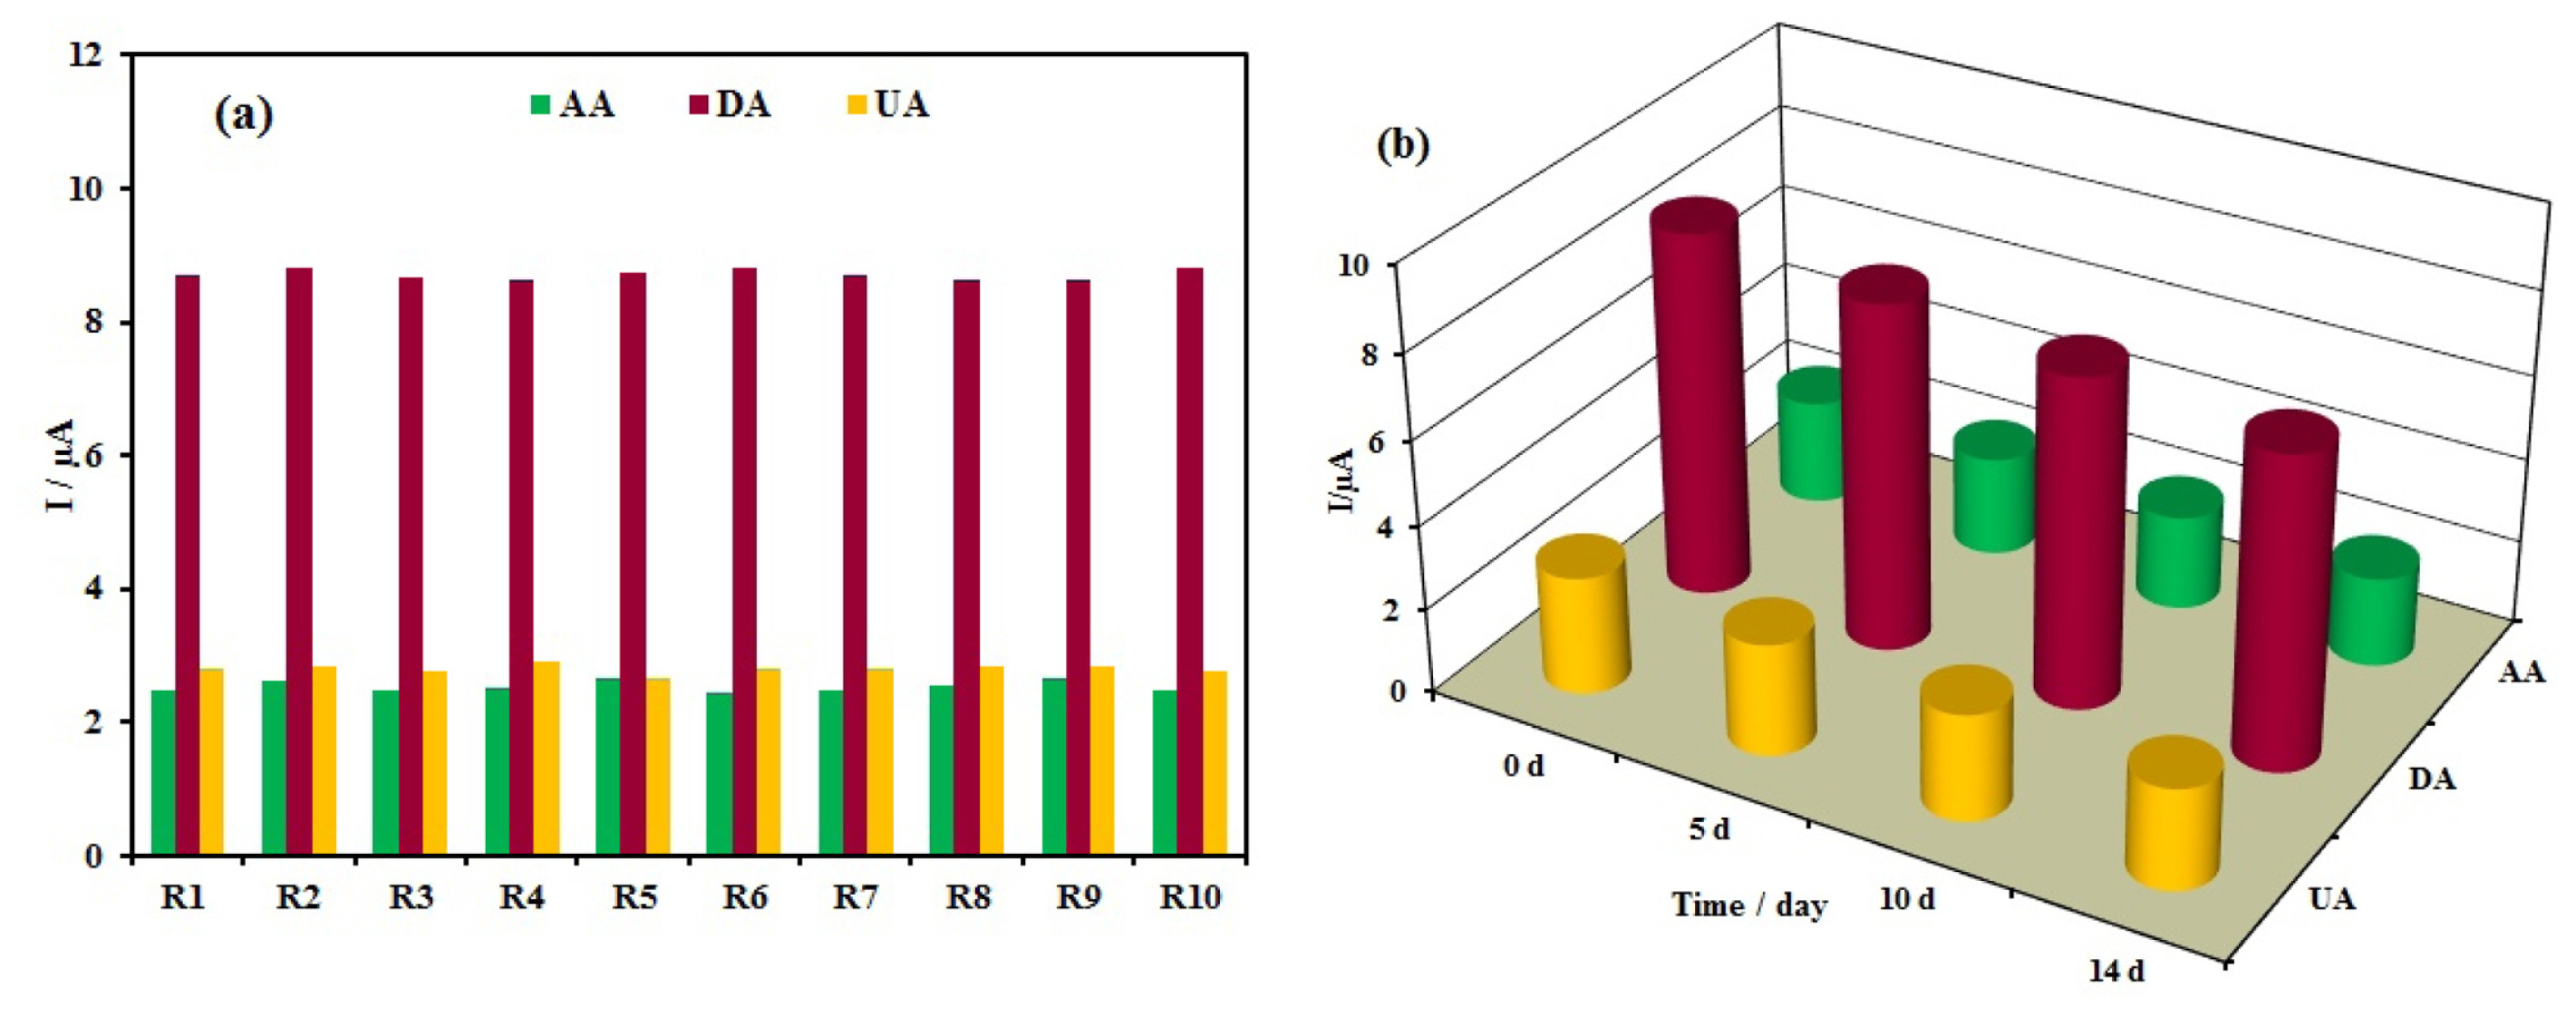
(a) The reproducibility investigation of 10 successive experiments (R1–R10) and (b) storage stability of the modified electrode.
The stability of the resulted sensor was tested by repeating the experiments for AA, DA, and UA in a mixture of 1 mM AA,0.08 mM DA, and 0.9 mM UA in Britton-Robinson buffer solution (pH 4.0) and the results are shown in Fig. 10b. After the 2 weeks (when not in use, the electrode was stored at room temperature under normal condition), the three species responses decreased gradually to 85% of the initial values which demonstrates good long-term stability.
3.8. Determination of AA, DA, and UA in real samples
The possibility of using Ag/PANI/RGO nanocomposite modified electrode was applied to the determination of DA in dopamine hydrochloride injections (content of DA 20 mg mL−1) DA injection was diluted with double distilled water, and then a portion of diluted solution was mixed with 0.04 M BR Solution and the diluted sample being transferred into the electrochemical cell for the determination using DPV method. The results are summarized in Table 3. The recoveries ranged from 97.8 to 102.5%. The RSD (n=6) was less than 3.0%. The results of the determination show that the prepared sensor is reliable and feasible for the detection of DA in injections.

Determination of DA in dopamine hydrochloride injection (n = 6).
In the further research, the Ag/PANI/RGO nanocomposite modified electrode was used for determination of AA, DA, and UA in human urine samples. The recovery tests were carried out by adding known amounts of pure AA, DA, and UA to the real samples solutions and the solution was transferred into the voltammetric cell to be analyzed using the standard addition method without any further pretreatment. The resulted recoveries were between 98.1 and 103.0%, Also the RSDs (n=6) were less than 3.0% (Table 4). These results show that the Ag/PANI/RGO nanocomposite modified electrode had a good catalytic activity for real sample analysis and the obtained recoveries were satisfactory.
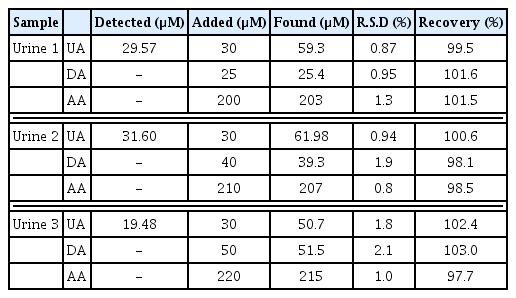
Determination of AA, DA, and UA in humane urine samples (n = 6).
4. Conclusions
In this report, a new application of a simple sensor based on Ag/PANI/RGO nanocomposite modified glassy carbon electrode was introduced. The nanocomposite was characterized by using TEM, SEM, Raman sspectroscopy, XRD, and EIS. Ag/PANI/RGO/GCE not only improved electro catalytic activity for the oxidation of AA, DA and UA, but also resolved the overlapping anodic DA, AA and UA peaks into three well-defined peaks. The proposed sensor demonstrated selectivity, and sensitivity towards AA, DA, and UA.
Acknowledgement
The authors gratefully acknowledge partial financial support from the Research Council of Alzahra University.