Electrooxidation of Zolpidem and its Voltammetric Quantification in Standard and Pharmaceutical Formulation using Pencil Graphite Electrode
Article information
Abstract
In this study a new, simple, precise, accurate and economic electrochemical method was developed and validated for the voltammetric determination of zolpidem (ZP) using disposable pencil graphite (PG) electrode. The anodic oxidation of ZP on the surface of the PG electrode was examined in a britton robinson (BR) buffer. Square wave and cyclic voltammetry were used as electrochemical techniques in the potential range of 0-1.2 V in the pH 8 BR buffer. In cyclic voltammetry studies, the diffusion coefficient of ZP oxidation was found to be 3.6×10⁻⁶ cm2 s-1. On the other hand, the ZP has shown a well-defined irreversible anodic peak at 0.98 V in the square wave voltammetry mode. The PG electrode, primarily being graphite which has a large active surface area gives rise to increasing peak current with respect to ZP electrooxidation. PG electrode showed an electrocatalytic effect in anodic oxidation of ZP. A linear relationship between catalytic current response and ZP concentration was obtained over a concentration range of 10-30 μM with R.S.D. values ranging from 0.29-3.89. Limits of detection and quantitation were found to be 1 and 3 μM, respectively. Finally, the PG electrode was successfully used to determine ZP in standard and tablet dosage forms with a mean recovery of 100.69 %.
1. Introduction
Zolpidem (ZP, N,N,6-trimethyl-2-(4-methylphenyl)imidazo[1,2-a]pyridine-3-acetamide), (Fig. 1) [1] is an imidazopyridine derivative, non-benzodiazepine and sedative-hypnotic medicine. It produces an agonistic effect on GABAA receptors. ZP is a widely prescribed medication in adults for the short-term treatment of a sleep problem called insomnia and frequent awakenings. It is an effective hypnotic with only weak anticonvulsant and myorelaxant properties [2-4].
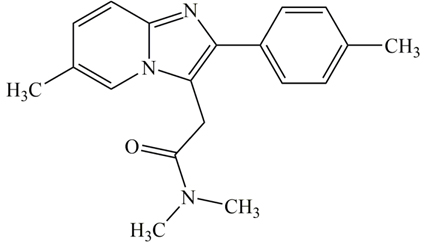
The chemical structure of ZP.
Several analytical methods have been reported in the literatures for the determination of the ZP in pharmaceutical dosage forms. These methods are mainly based on gas chromatography (GC) [5], spectrophotometry [6-8], potentiometry [9], radioimmunoassay [10], high-performance liquid chromatography (HPLC) [11-14]. Although all these methods display good precision and accuracy, most of them are tedious, time-consuming and have required several preparatory steps prior to testing and skilled practitioner. For instance, radioimmunoassay method is not used nowadays for routine analysis of drugs in dosage forms as it is very expensive. On the other hand, derivative procedure for GC is difficult to achieve. Electrochemical methods are advantageous in that they are low in cost, rapid, highly sensitive and provide good reproducibility [15-22]. Therefore, the development of an analytical method that is applicable for routine quality control of the active pharmaceutical ingredients is beneficial.
At the best of our knowledge, only one report has described an electrochemical method for determining ZP concentrations using a glassy carbon electrode [23]. Although disposable pencil graphite (PG) electrode is relatively new type of carbon electrode, it has been successfully applied to the cathodic and anodic voltammetry by virtue of its high electrochemical reactivity, commercial availability, good mechanical rigidity, low cost, low technology and ease of modification [24-26]. The “low tech” PG electrode when compared with other forms of carbon electrodes, is extremely inexpensive and provides an attractive alternative to “high tech” carbon electrodes [27]. Due to those useful and important characteristics, scientists have focused on the use of PG electrode for phenolic compounds analysis [28,29]. The aims of this study were, first, to demonstrate the usefulness of a PG electrode on the electrochemical behavior of ZP, and second, to develop a new analytical method for the analysis of ZP in pharmaceutical dosage forms. The method was further validated according to the ICH (International Conference on Harmonization) guidelines [30] for the parameters including precision, accuracy, limits of detection and quantitation, linearity and range. Finally, the analytical application of the PG electrode was demonstrated by analysis of ZP in tablets.
2. Experiment
2.1. Materials
Sodium hydroxide, acetic acid, boric acid and ortho phosphoric acid used in this work were Merck (Darmstadt, Germany) products of analytical grade and were used without further purification. ZP tartrate was kindly supplied by Farmak (Olomouc, Czech Republic). Authentic samples (tablet) were obtained from Hexal AG (Holzkirchen, Germany). Each one was labeled to contain 10 mg ZP tartrate. Doubly distilled water was used throughout.
2.2. Apparatus
Electrochemical studies were carried out using a three electrode system consisting of PG (Owner, HB, 0.7 mm diameter, Korea) working, Ag/AgCl/3 M KCl (Metrohm, Switzerland) reference, and Pt rod counter electrodes using a PC controlled μ-AUTO-LAB TYP III potansiostat/galvanostat with NOVA 1.11 electrochemistry software (ECO-Chemie, Utrecht, The Netherlands). The measurements with the PG electrode was carried out in homemade 20-mL glass one-compartment voltammetric cell at a laboratory temperature (25 ± 2 ℃). PG electrode held by crocodile clip and an electrical contact achieved by a copper wire. Unless otherwise indicated, 10 mm of the PG was immersed in the center of the cell for the electrochemical measurements. A graphite (G) electrode was used for comparison and before each measurement, polished on a damp smooth polishing cloth (BAS PK-4 Polishing Kit, West Lafayette, USA) then rinsed all over with doubly distilled water. The G electrode was then dried at room temperature.
2.3. Procedure
ZP stock solution (100 μM) was prepared by direct dissolution in doubly distilled water. Standard solutions of ZP were daily prepared by transfer appropriate amount of ZP stock solution into 20 mL A-grade volumetric flasks using A-grade bulb pipettes, and the solutions were made up to volume by britton-robinson (BR) buffer (pH 8.0, supporting electrolyte) for obtaining solutions with final concentrations of 10-30 μM. All solutions were purged for 5 minutes with nitrogen gas prior to use.
BR buffer was prepared according to the literature [31]. Briefly, a BR buffer containing 0.04 M of each of acetic, ortho phosphoric and boric acids and it was adjusted to the required pH with 0.2 M sodium hydroxide solution.
For pharmaceutical analysis, twenty ZP 10 mg tablets were weighed and triturated to the fine powder. A quantity of powder with equivalent weight of one tablet was transferred in a 20 mL volumetric flask and half filled with doubly distilled water. After the solution was sonicated for 20 min, again diluted by doubly distilled water and adjusted to the volume. Then, the solution was filtered and finally it diluted with pH 8.0 BR buffer to reach the target concentration and transferred to the electrochemical cell for measurement.
3. Results and Discussion
3.1. Electrochemical behavior of ZP
Square wave voltammograms of electrochemical behavior of 25 μM ZP on the G and PG electrodes are shown in Fig. 2. As can be seen, the PG electrode showed the less background current (Fig. 2a) rather than the G electrode (Fig. 2b). A sharp irreversible anodic peak (Fig. 2c) with a catalytic current response of 68.64 μA.cm-2 at 0.98 V due to ZP oxidation was observed on PG electrode. However, for the G electrode, a weak and broad peak (Fig. 2d) with a catalytic current response of 9.73 μA.cm-2 was obtained. A useful electrode geometry for analytical purposes is a cylinder rather than a disk, partly because the use of a longer cylinder electrode enhances sensitivity as surface poisoning do not occur [32]. In comparison with the lone research that worked on the electrochemical behavior of ZP, the PG electrode in the presence of ZP has almost similar potential peak with glassy carbon electrode [23]. Further, its sensitivity is approximately 50 times higher than that of the glassy carbon electrode [23].

Square wave voltammograms of PG and G electrode in pH 8.0 BR buffer solution in absence (a, b) and presence (c, d) of 25 μM ZP, respectively.
3.2. Influence of pH on voltammetric response of ZP on the PG electrode
pH is one of the most important experimental parameters as it affects greatly the stability and potential of the peak. Fig. 3 illustrates the relationship between pH and peak currents of square wave voltammograms of 100 μM ZP on the PG electrode at pH ranging from 3.0 to 11.0 using the BR buffer solution. The electrochemical behavior of ZP showed a strong dependence on pH. Changes in the pH of a BR buffer solution during ZP measurement caused changes in the current response (Fig. 4a). The peak intensity decreased considerably at pH values lower than 7.0 and the peak was not well extracted from the background discharge in acidic media (at pH ≤ 5). Moreover, this peak was flattened at pH above 8.0. Therefore the BR buffer with pH 8.0 was used as the supporting electrolyte in all voltammetric measurements.
Square wave voltammograms of the PG electrode in the presence of 100 μM ZP in different pH values over the range of 3-11of BR buffer solution.
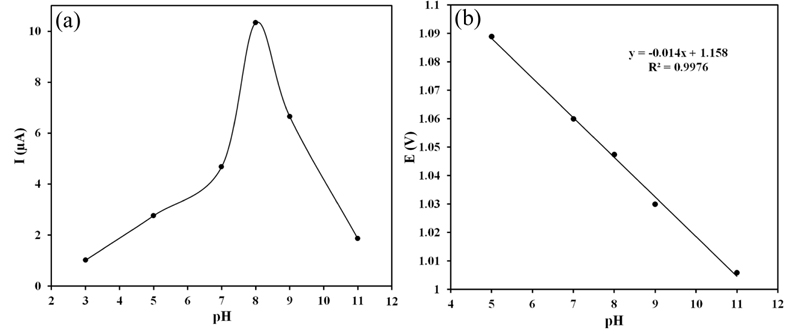
Additionally, with the pH increasing, the oxidation peak shifted toward negative, and the linear equation was Ep (V) = 1.158 − 0.058 pH (R2 = 0.9976) (Fig. 4b). According to the slope 0.058 V/pH for ZP, and expression ΔEp/ΔpH = 0.059/n, it can be deduced that same number of electrons and protons were involved in the electrochemical oxidation of ZP. The following irreversible mechanism involving two protons and two electrons is suggested for the electrooxidation of ZP (Fig. 5). According to the mechanism, in the absence of hydrogen at the á position to nitrogen, the course of anodic oxidation takes this type of bond cleavage and acetamido derivative product, obtained [34,35]. It is likely that the amide substituted derivatives form hydrogen bonding with nucleophilic attack by water and as a consequence, while oxidized at the PG electrode, bring water molecules to the vicinity of the PG electrode surface [36].
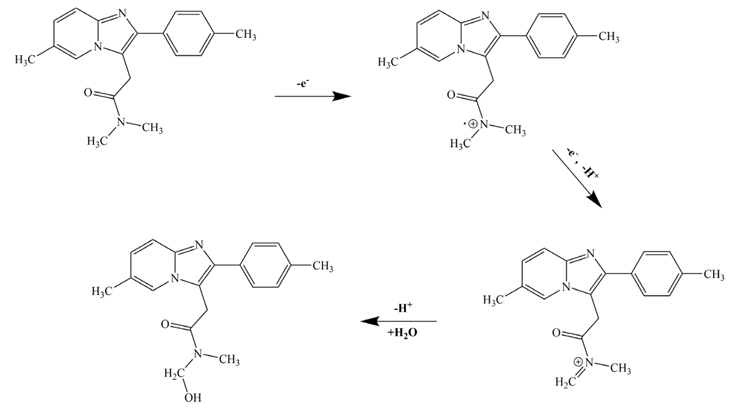
A proposed reaction mechanism for the electrooxidation of the ZP.
3.3. Effect of potential sweep rate
The effect of potential sweep rate on the peak current and the peak potential of ZP was evaluated. The cyclic voltammograms for a 20 μM ZP in pH 8.0 BR buffer solution generated using the PG electrode at different potential sweep rates (2-1000 mV s−1) are depicted in Fig. 6. The positive shifts in the peak potential together with the absence of cathodic wave confirmed the irreversibility of the oxidation process [37]. The plot of peak current vs. square root of the potential sweep rate is presented in Fig. 7a. A linear variation of peak current with the square root of the potential sweep rate, as can be seen from the regression line through the data points, is an indication that the system follows the Randles-Sevcik equation [37]. The inability of the regression line to pass through the origin in Fig. 7a, indicates that the electrochemical reaction is irreversible. The non-zero intercept clearly indicate that the oxidation peak is due to diffusion-controlled phenomena rather than to adsorption and can be attributed to the contribution of non-faradaic currents to the peak current. At increasingly higher potential sweep rates diffusion becomes less effective as a means of mass transport to the electrode surface [38]. From the slope of the linear dependency of the anodic peak current on the square root of the potential sweep rate and using the Randles-Sevcik equation for totally irreversible electron-transfer processes [37]:
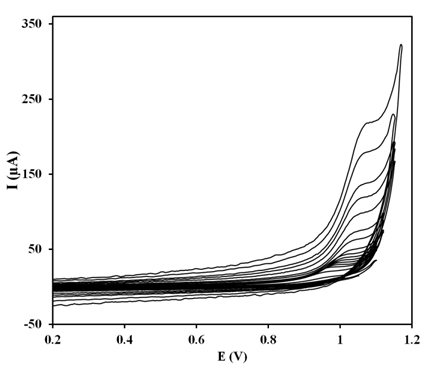
Cyclic voltammograms of 20 μM ZP in the pH 8.0 BR buffer solution using the PG electrode recorded at various potential sweep rates of 2-1000 mV s-1.
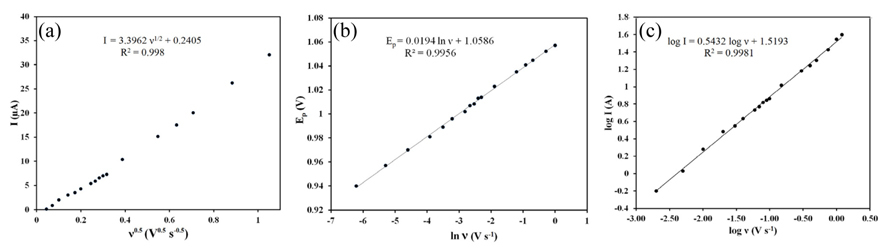
Dependency of (a) the peak current on the square root of the corresponding potential sweep rate, (b) peak potentials on the natural logarithm of the potential sweep rates, (c) logarithm of peak current against logarithm of potential sweep rate.

where Ip, n, A, C, α and D are the peak current, number of exchanged electrons, real surface area of the PG electrode, the ZP concentration, electron transfer constant and diffusion coefficient of the electroreactant species, respectively; The diffusion coefficient of ZP has been obtained as 3.6 × 10⁻⁶ cm2 s-1. As shown in Fig. 7b, the peak potentials against the natural logarithm of the potential sweep rates show a linear relationship. This means that the oxidation processes are diffusion-controlled in the whole range of the studied scan rates [37]. A plot of logarithm of peak current versus logarithm of potential sweep rate (Fig. 7c) gave a straight line with a slope of 0.54 (correlation coefficient 0.998), close to the theoretical value of 0.5, which is expected for an ideal reaction of solution species [39,40]. So, in this case, the process had a diffusive component.
3.4. Effect of ZP concentration and Calibration data
The square wave voltammograms of the solutions with different concentrations of the ZP in pH 8.0 BR buffer solution are shown in Fig. 8. Three calibration curves were constructed using the optimized square wave parameters, including amplitude of 0.02 V, frequency of 25 Hz and the adsorption time of 10 s in three consecutive days. The oxidation peak currents were proportional to the ZP concentration in the range of 10-30 μM (Fig. 8, inset). The slope, intercept and correlation coefficient of the best curve (Fig. 8, inset) were 0.3079 and 0.6947 and R2 = 0.993, respectively. The limit of detection (LOD) and limit of quantitation (LOQ) were calculated from the calibration curves as k× SD/a where k = 3 for LOD and 10 for LOQ, SD is the standard deviation of the y-intercept and a is the slope of the calibration curve [41,42]. The LOD and LOQ values were obtained to be 1 and 3 μM for the ZP, respectively.
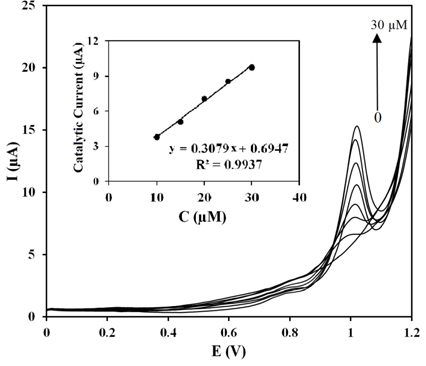
Square wave voltammograms for the PG electrode in the pH 8.0 BR buffer solution with different concentrations (from bottom to top, 0, 3, 5, 10, 15, 20, 25, 30 μM) of ZP. Inset: the corresponding linear relationship between the oxidation current and ZP concentration(10-30 μM).
The precision of an analytical method is a calculation of agreement along with individual test results when the procedure is applied repeatedly to multiple sampling of analyte and expressed as a standard deviation or a percent relative standard deviation (%RSD) [30,42]. The accuracy of an analytical method is the closeness of test results obtained by the method to the true value [30]. The precision and accuracy of the assay were determined from the low (10 μM), medium (20 μM) and high (30 μM) ZP concentrations. The intra-day precision was assessed by repeated analysis of each ZP standard solution on one day (in three replicates). The inter-day precision was determined by analyzing the same standard solutions in triplicates during three consecutive days (in nine replicates). The concentration of each ZP standard solution was determined using a calibration curve prepared each day. The intra-day precision expressed as %RSD obtained in the range of 0.29-3.89. The inter-day precision expressed as %RSD for each ZP concentration was in the range of 1.51-3.96. The results represented excellent precisions for the determination of ZP by using the PG electrode.
Accuracy of the assay was determined by interpolation of replicate (n = 9) peak areas of three accuracy standards (10, 20 and 30 μM) from a calibration curve prepared as previously described. In each case, the percent relevant error and accuracy was calculated. The resul t ant concentrations were 9.57 ± 0.15 μM (mean ± SD), 20.70 ± 0.16 μM and 29.15 ± 0.15 μM with percent relative errors of −4.28, 3.53 and 2.83 %, respectively.
The ruggedness of the method was assessed by the intra- and inter-day assay results for ZP which was performed by two analysts. The RSD values of the intra- and inter-day assays of ZP, performed in the same laboratory by the two analysts, did not exceed 4.5 %, suggesting the ruggedness of this method.
3.5. Analytical applications
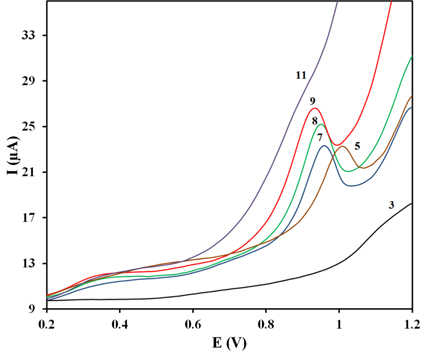
To assess the applicability of the proposed method, the PG electrode was used to determine the content of ZP in ‘zolpidem’ tablets (Hexal®) as a real pharmaceutical sample by using the square wave voltammetry technique (Fig. 9). The results showed outstanding recovery, 100.69 % with an RSD of 4.37 % (n = 3). Considering the resultant square wave voltammograms, there was no interference with the excipients for the ZP tablet.
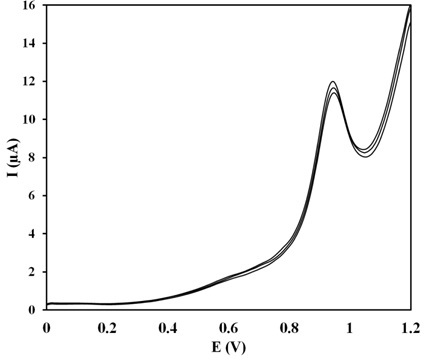
Resultant Square wave voltammograms (n = 3) following the analysis of a ZP in Hexal® tablets solution (16 μM) using the PG electrode in the pH 8.0 BR buffer solution.
4. Conclusion
The electrochemical determination of ZP in pH 8.0 BR buffer solution on PG electrode using square wave voltammetry was studied for the first time. ZP has shown a well defined irreversible anodic peak at 0.98 V on the PG electrode. The large current response of ZP on the PG electrode when compared to that observed for the G electrode could be attributed to the high active surface area of PG electrode. The kinetic parameter of the reaction, diffusion coefficient, was derived through cyclic voltammetry and is 3.6×10⁻⁶ cm2 s-1. In summary, the developed method is a new, simple, precise, accurate and economic electrochemical method which was successfully applied for the determination of micromolar amounts of ZP in standard and pharmaceutical dosage forms.
Acknowledgements
The financial support provided by the Tehran University of Medical Sciences (TUMS) is gratefully acknowledged.
References
M. J. O'Neil, The Merck index: an encyclopedia of chemicals, drugs, and biologicals. 2013: RSC Publishing.
O'Neil M. J.. The Merck index: an encyclopedia of chemicals, drugs, and biologicals RSC Publishing; 2013.A. Brayfield, Martindale: the complete drug reference. 38 ed. 2014, USA: Pharmaceutical Press.
Brayfield A.. Martindale: the complete drug reference 38 ed.th ed. Pharmaceutical Press. USA: 2014.A. C. Moffat, M. D. Osselton and B. Widdop, Clarke's analysis of drugs and poisons. Vol. 3. 2011: Pharmaceutical press London.
Moffat A. C., Osselton M. D., Widdop B.. Clarke's analysis of drugs and poisons Pharmaceutical press. London: 2011.H. D. Langtry and P. Benfield, Zolpidem. Drugs, 1990. 40(2): p. 291-313.
Langtry H. D., Benfield P.. Zolpidem. Drugs 1990;40(2):291–313. 10.2165/00003495-199040020-00008.T. Keller, A. Schneider and E. Tutsch-Bauer, Forensic Sci. Int., 106(2), 103 (1999).
Keller T., Schneider A., Tutsch-Bauer E.. Forensic Sci. Int. (1999);106(2):103. 10.1016/S0379-0738(99)00185-1.M. P. Mahajan and S. D. Sawant, Int. J. ChemTech Res, 4(1), 403 (2012).
Mahajan M. P., Sawant S. D.. Int. J. ChemTech Res (2012);4(1):403.R. Chomwal, A. Kumar and A. Goyal, J. Pharm. Bioallied Sci., 2(4), 365 (2010).
Chomwal R., Kumar A., Goyal A.. J. Pharm. Bioallied Sci. (2010);2(4):365. 10.4103/0975-7406.72142.K. S. Patil, Y. V. Pore and S. B. Bhise, J. Pharm. Sci & Res., 2(1), 1 (2010).
Patil K. S., Pore Y. V., Bhise S. B.. J. Pharm. Sci & Res. (2010);2(1):1.K. M. Kelani, J. AOAC Int., 87(6), 1309 (2004).
Kelani K. M.. J. AOAC Int. (2004);87(6):1309.I. De Clerck and P. Daenens, Analyst, 122(10), 1119 (1997).
De Clerck I., Daenens P.. Analyst (1997);122(10):1119. 10.1039/a702869e.L. Laviana, C. Mangas, F. Fernández-Maríb, M. Bayodb and D. Blanco, J. Pharm. Biomed. Anal., 36(4), 925 (2004).
Laviana L., Mangas C., Fernández-Maríb F., Bayodb M., Blanco D.. J. Pharm. Biomed. Anal. (2004);36(4):925. 10.1016/j.jpba.2004.08.025.M. P. Maharajan and S. Sawant, J. Pharm. Res., 4(10), 3789 (2011).
Maharajan M. P., Sawant S.. J. Pharm. Res. (2011);4(10):3789.S. Yaripour, S. N. Rashid, H. Alibakhshi and A. Mohammadi, Journal of Analytical Chemistry, 70(6), 738 (2015).
Yaripour S., Rashid S. N., Alibakhshi H., Mohammadi A.. Journal of Analytical Chemistry (2015);70(6):738. 10.1134/S1061934815060143.E. Konoz, A. H. Mohsen Sarrafi, R. Abdolahnejad and M. Bahrami-Zonoz, J. Chem., 2013 (2012).
Konoz E., Mohsen Sarrafi A. H., Abdolahnejad R., Bahrami-Zonoz M.. J. Chem. (2012);2013F. Ghorbani-Bidkorbeh, S. Shahrokhian, A. Mohammadi and R. Dinarvand, J. Electroanal. Chem., 638(2), 212 (2010).
Ghorbani-Bidkorbeh F., Shahrokhian S., Mohammadi A., Dinarvand R.. J. Electroanal. Chem. (2010);638(2):212. 10.1016/j.jelechem.2009.11.012.A. Mohammadi, A. B. Moghaddam, E. Alikhani, K. Eilkhanizadeh and S. Mozaffari, IET Micro & Nano Letters, 8(12), 853 (2013).
Mohammadi A., Moghaddam A. B., Alikhani E., Eilkhanizadeh K., Mozaffari S.. IET Micro & Nano Letters (2013);8(12):853. 10.1049/mnl.2013.0671.A. Babaei, B. Khalilzadeh and M. Afrasiabi, J. Appl. Electrochem., 40(8), 1537 (2010).
Babaei A., Khalilzadeh B., Afrasiabi M.. J. Appl. Electrochem. (2010);40(8):1537. 10.1007/s10800-010-0131-9.A. Mohammadi, A. B. Moghaddam, K. Eilkhanizadeh, E. Alikhani, S. Mozaffari and T. Yavari, IET Micro & Nano Letters, 8(8), 413 (2013).
Mohammadi A., Moghaddam A. B., Eilkhanizadeh K., Alikhani E., Mozaffari S., Yavari T.. IET Micro & Nano Letters (2013);8(8):413. 10.1049/mnl.2013.0080.A. Naeemy, A. Mohammadi, H. Bakhtiari and N. Ashouri and R. B. Walker, IET Micro & Nano Letters, 9(10), 691 (2014).
Naeemy A., Mohammadi A., Bakhtiari H., Ashouri N., Walker R. B.. IET Micro & Nano Letters (2014);9(10):691. 10.1049/mnl.2014.0197.A. Mohammadi, A. B. Moghaddam, R. Dinarvand and S. Rezaei-Zarchi, Int. J. Electrochem. Sci., 4, 895 (2009).
Mohammadi A., Moghaddam A. B., Dinarvand R., Rezaei-Zarchi S.. Int. J. Electrochem. Sci. (2009);4:895.S.-H. Jung, Y.-K. Lee, and Y.-K. Son, J. Electrochem. Sci. Tech., 2(2), 124 (2011).
Jung S.-H., Lee Y.-K., Son Y.-K.. J. Electrochem. Sci. Tech. (2011);2(2):124. 10.5229/JECST.2011.2.2.124.M. D. Rahman, L. Mahbubur, J. Xiao-Bo, Y.-D. Lee, H.-J. Lee, S. J. Lee and J.-J. Lee, J. Electrochem. Sci. Tech., 3(2), 90 (2012).
Rahman M. D., Mahbubur L., Xiao-Bo J., Lee Y.-D., Lee H.-J., Lee S. J., Lee J.-J.. J. Electrochem. Sci. Tech. (2012);3(2):90. 10.5229/JECST.2012.3.2.90.A.-E. Radi, G. Bekhiet and T. Wahdan, Chem. Pharm. Bull., 52(9), 1063 (2004).
Radi A.-E., Bekhiet G., Wahdan T.. Chem. Pharm. Bull. (2004);52(9):1063. 10.1248/cpb.52.1063.W. Gao, J. Song and N. Wu, J. Electroanal. Chem., 576(1), 1 (2005).
Gao W., Song J., Wu N.. J. Electroanal. Chem. (2005);576(1):1. 10.1016/j.jelechem.2004.09.026.D. Demetriades, A. Economou and A. Voulgaropoulos, Anal. Chim. Acta, 519(2), 167 (2004).
Demetriades D., Economou A., Voulgaropoulos A.. Anal. Chim. Acta (2004);519(2):167. 10.1016/j.aca.2004.05.008.H. Karadeniz, B. Gulmez, F. Sahinci, A. Erdem, G. I. Kaya, N. Unver, B. Kivcak and M. Ozsoz, J. Pharm. Biomed. Anal., 33(2), 295 (2003).
Karadeniz H., Gulmez B., Sahinci F., Erdem A., Kaya G. I., Unver N., Kivcak B., Ozsoz M.. J. Pharm. Biomed. Anal. (2003);33(2):295. 10.1016/S0731-7085(03)00283-8.A. M. Bond, P. J. Mahon, J. Schiewe and V. Vicente-Beckett, Anal. Chim. Acta, 345(1), 67 (1997).
Bond A. M., Mahon P. J., Schiewe J., Vicente-Beckett V.. Anal. Chim. Acta (1997);345(1):67. 10.1016/S0003-2670(97)00102-5.M. Muti, K. Gençdağ, F. M. Nacak and A. Aslan, Colloids Surf. B Biointerfaces, 106, 181 (2013).
Muti M., Gençdağ K., Nacak F. M., Aslan A.. Colloids Surf. B Biointerfaces (2013);106:181. 10.1016/j.colsurfb.2013.01.018.S. Buratti, M. Scampicchio, G. Giovanelli and S. Mannino, Talanta, 75(1), 312 (2008).
Buratti S., Scampicchio M., Giovanelli G., Mannino S.. Talanta (2008);75(1):312. 10.1016/j.talanta.2007.11.014.Guideline, I. H. T., Validation of analytical procedures: text and methodology. Q2 (R1), 1 (2005).
Guideline, I. H. T., Validation of analytical procedures: text and methodology, Q2 (R1) (2005).H. T. S. Britton, and R. A. Robinson, CXCVIII.-Universal buffer solutions and the dissociation constant of veronal. Journal of the Chemical Society (Resumed), 1456 (1931).
Britton H. T. S., Robinson R. A.. CXCVIII.-Universal buffer solutions and the dissociation constant of veronal. Journal of the Chemical Society (Resumed) (1931);:1456.F. Khorsand, S. Riahi, S. E. Fard, S. Kashanian, A. Naeemy1, Bagher Larijani and K. Omidfar, IET Nanobiotechnology, 7(1), 1 (2013).
Khorsand F., Riahi S., Fard S. E., Kashanian S., Naeemy A., Larijani Bagher, Omidfar K.. IET Nanobiotechnology (2013);7(1):1. 10.1049/iet-nbt.2012.0001.T. Golub and J. Y. Becker, Org. Biomol. Chem., 10(19), 3906 (2012).
Golub T., Becker J. Y.. Org. Biomol. Chem. (2012);10(19):3906. 10.1039/c2ob06878h.T. Golub and J. Y. Becker, J. Electrochem. Soc., 160(7), G3123 (2013).
Golub T., Becker J. Y.. J. Electrochem. Soc. (2013);160(7):G3123.N. L. Weinberg and E. A. Brown, J. Org. Chem., 31(12), 4058 (1966).
Weinberg N. L., Brown E. A.. J. Org. Chem. (1966);31(12):4058. 10.1021/jo01350a041.J. D. Coyle, Pure Appl. Chem., 60(7), 941 (1988).
Coyle J. D.. Pure Appl. Chem. (1988);60(7):941.J. B. Allen and R. F. Larry, Electrochemical methods: fundamentals and applications. New York, United States: John Wiley & Sons, Inc. (2001).
Allen J. B., Larry R. F.. Electrochemical methods: fundamentals and applications John Wiley & Sons, Inc.. New York, United States: (2001).P. M. Monk, Fundamentals of electro-analytical chemistry, Vol. 29. John Wiley & Sons (2008).
Monk P. M.. Fundamentals of electro-analytical chemistry John Wiley & Sons; (2008).E. Laviron, J. Electroanal. Chem. Interfacial Electrochem., 101(1), 19 (1979).
Laviron E.. J. Electroanal. Chem. Interfacial Electrochem. (1979);101(1):19. 10.1016/S0022-0728(79)80075-3.A. B. Moghaddam, A. Mohammadi and S. Mohammadi, Pharm. Anal. Acta, 3(6), 1 (2012).
Moghaddam A. B., Mohammadi A., Mohammadi S.. Pharm. Anal. Acta (2012);3(6):1.J. C. Miller and J. N. Miller, Statistics for analytical chemistry., New York, United States: John Wiley and Sons. (1988).
Miller J. C., Miller J. N.. Statistics for analytical chemistry John Wiley and Sons. New York, United States: (1988).United States Pharmacopoeia 38. Rockville, USA: The United States Pharmacopoeia Convention (2015).
United States Pharmacopoeia 38 The United States Pharmacopoeia Convention. Rockville, USA: (2015).