A Review of Strategies to Improve the Stability of Carbon-supported PtNi Octahedral for Cathode Electrocatalysts in Polymer Electrolyte Membrane Fuel Cells
Article information
Abstract
Polymer electrolyte membrane fuel cells (PEMFCs) are green energy conversion devices, for which commercial markets have been established, owing to their application in fuel cell vehicles (FCVs). Development of cathode electrocatalysts, replacing commercial Pt/C, plays a crucial role in factors such as cost reduction, high performance, and durability in FCVs. PtNi octahedral catalysts are promising for oxygen reduction reactions owing to their significantly higher mass activity (10–15 times) than that of Pt/C; however, their application in membrane electrode assemblies (MEAs) is challenged by their low stability. To overcome this durability issue, various approaches, such as third-metal doping, composition control, halide treatment, formation of a Pt layer, annealing treatment, and size control, have been explored and have shown promising improvements in stability in rotating disk electrode (RDE) testing. In this review, we aimed to compare the features of each strategy in terms of enhancing stability by introducing a stability improvement factor for a direct and reasonable comparison. The limitations of each strategy for enhancing stability of PtNi octahedral are also described. This review can serve as a valuable guide for the development of strategies to enhance the durability of octahedral PtNi.
1. Introduction
The emission of greenhouse gases from fossil fuels poses serious problems to the global environment, including global warming and climate change [1–3]. Clean and sustainable energy system technologies have been developed as strategies to reduce reliance on fossil fuels, such as lithium-ion batteries (LIBs) and polymer electrolyte membrane fuel cells (PEMFCs) [4–6]. In the electric automotive markets, fuel cell vehicles (FCVs) equipped with PEMFCs are considered promising because of several advantages, including a driving distance of over 500 km, a short refueling time of 3–5 minutes, and a cold start ability down to −30°C, distinguishing them from the currently dominant LIB-powered vehicles [3,7].
Currently, high-surface-area carbon-supported Pt with approximately 40 wt% Pt-loading and a size of 2–4 nm (referred to as Pt/C) is the most commonly used electrochemical catalyst because of its high oxygen reduction reaction (ORR) electrocatalytic activity and effectiveness in membrane electrode assemblies (MEAs) [8,9]. In MEAs, substantial Pt usage is necessary to meet the requirements, such as high-power density, of FCVs [7,8]. The high cost of Pt, constituting approximately 40–50% of fuel cell stack prices, significantly increases PEMFC costs, fundamentally hindering its widespread commercialization [10]. Hence, reducing Pt usage in PEMFCs by approximately 50% is necessary [11].
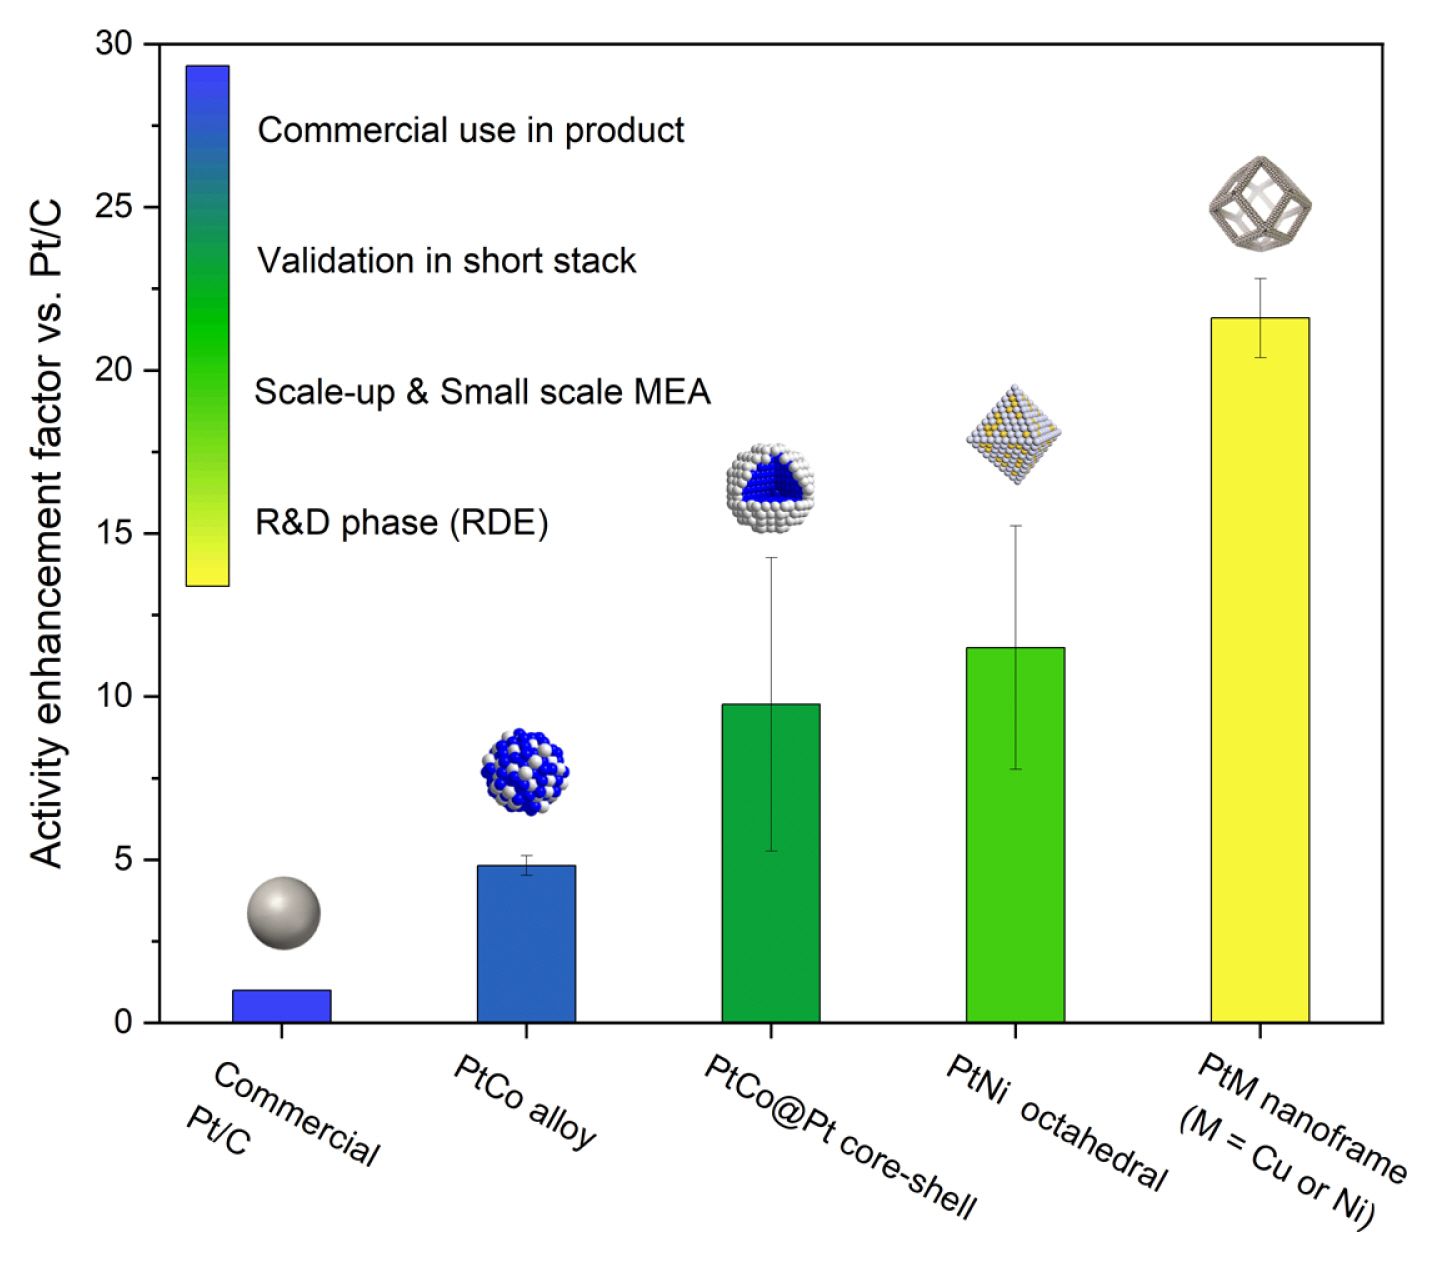
To reduce Pt usage, several promising Pt-based ORR electrocatalysts, such as PtCo alloys, PtCo@Pt core-shell structures, PtNi octahedral, and PtM nanoframes (M = Cu or Ni), have been developed. However, the limitations of each catalyst, such as low Pt loading, low durability, and inappropriate structure for electrode utilization, must be overcome for their application in PEMFCs. The catalysts developed thus far can be categorized as Pt-based catalysts, in which the shapes and compositions are controlled, and non-Pt-based catalysts [12,13]. Considering the performance, durability, and development stage, (1) PtCo alloy, (2) PtCo@Pt core-shell, (3) PtNi octahedral, and (4) PtM nanoframe (M = Cu or Ni) catalysts have emerged as more promising candidates for next-generation PEMFC catalysts than Pt/C (Fig. 1). Notably, these catalysts were supported on carbon. Non-precious metal catalysts (NPMCs) are not covered because they currently do not meet the performance requirements for the primary FCV [9]. For deeper insights into NPMCs, readers can refer to other review papers [12–14].
As a new baseline catalyst, at the practical level [9], PtCo exhibits higher performance (3–5 times) and similar or better durability than those of Pt/C [15–20]; however, it still requires further Pt usage reduction and improved durability [21–24]. For example, in the commercial FCV Toyota Mirai in 2015, which used a PtCo alloy as the cathode electrocatalyst, a Pt utilization of 30 g is still far from the ultimate goal of 6 g [21–23]. In addition, its durability of 3000 h does not meet the lifetime target of light-duty FCVs (8,000 h) [24].
In this regard, PtCo@Pt core-shell is a promising next-generation ORR catalyst with higher mass activity (MA; 1.5–3 times)[15,16,25–27] and stability (2 times) than that of PtCo [15,16,25] in a rotating disk electrode (RDE), but it has not yet fulfilled the required conditions for MEA (i.e., 40 wt% Pt-loading [28–33], PtCo atomic ratio of 3:1 [34–38], and small particle size of 2–4 nm [8,39–41]). Previously reported PtCo@Pt/C catalysts with 20–30 wt% Pt loading are limited by their low performance (approximately 60% of Pt/C) in MEA [28–30], owing to the resulting high mass transport resistance in the catalyst layers (CLs) [28–33]. Unfortunately, minimal efforts have been made to fabricate 40 wt% Ptloading PtCo@Pt/C and overcome the limitations of large particle size (7.1 ± 0.8 nm) [42] and low Co content in PtCo (i.e., Pt96Co4) [43]. Hence, it is necessary to develop a new fabrication method to obtain high-performance PtCo@Pt/C electrocatalysts for MEA.
Notably, PtNi octahedral catalysts are promising for the ORR owing to their significantly higher MA (10–15 times) than that of Pt/C, which is attributed to their (111) facets [44–47]; however, their application in MEAs remains challenging owing to their low stability [44,45,47–53]. A notable example is the 9 nm Pt2.5Ni octahedral catalyst which has a high MA of 3.3 A mgPt−1 attributed to the ideal (111) crystal structure [47], surpassing the Department of Energy (DOE) U.S. target by more than 7 times. However, it is still in the early stages of commercialization, mainly because of its poorer stability than that of Pt/C catalysts The octahedral shapes in similar catalysts tend to transform into thermodynamically stable spherical shapes after voltage cycling, resulting in activity degradation [54]. General Motors (GM) have indicated that they are quite unstable and have low durability during MEA testing [10]. Various approaches, such as third-metal doping [51,55–58], composition control [44,59], halide treatment [60], formation of a Pt layer [52,61–64], annealing treatment [48,65–68], and size control [69], have been explored to overcome the durability issue of PtNi octahedral. The results showed promising improvements in stability during RDE testing. Nevertheless, further active validation through MEA testing will help in the development of PtNi octahedral into next-generation commercial ORR catalysts in FCVs.
Most recently, PtM nanoframe (M = Cu or Ni) catalysts exhibit approximately 20 times higher MAs than that of Pt/C, but their small pore openings (<20 nm), which challenge ionomore penetration, limit their use in MEAs [70]. During the evaluation of Pt3Ni nanoframes in MEA at the Argonne National Laboratory, the performance degraded beyond the 0.7 V-high current density region owing to the high mass transport resistance [71]. Hence, a highly advanced catalyst-layer design is required.
From this perspective, understanding the strategies required for enhancing the durability of PtNi octahedra is highly important. Herein, we aim to review and directly compare the features of each strategy in terms of their stability enhancement capabilities, focusing on the electrocatalysts designed for primary FCVs in the PEFMC market.
We explore strategies aimed at enhancing the stability of novel PtNi octahedral electrocatalysts, enabling the rigorous evaluation of the most promising catalyst at the MEA level. By incorporating a stability enhancement factor, we compared the relative stability and discussed the limitations of each strategy. We hope that this review will provide a valuable resource for the development of strategies to enhance the durability of PtNi octahedral.
2. Strategies to improve the stability of PtNi octahedral
Although PtNi octahedral electrocatalysts have a high potential to be developed into next-generation ORR electrocatalysts with significant MA [47], their poor stability mainly due to Ni dissolution should be addressed for their effective utilization [54]. Ni leaching is critical because most shape controlled PtNi octahedral tend to become spherical in shape with losing the (111) facets. Ni leaching not only deteriorates the shape and decreases the performance of the ORR but also contaminates the membrane or ionomer owing to the release of Ni2+ ions [54].
Hence, research has focused on enhancing the durability of PtNi octahedral electrocatalysts using methods that suppress Ni leaching, including third-metal doping [51,55–58], composition control [44,59], halide treatment [60], formation of a Pt layer [52,61–64], annealing treatment [48,65–68], and size control [69] (Fig. 2). A direct comparison between the results was not feasible due to the absence of a suitable indicator. Therefore, we devised a stability improvement factor to facilitate the comparison between the results. The MA, MA loss, and stability improvement factor were calculated as follows:

Strategies for enhanced stability of PtNi octahedral as ORR catalysts.
The stability test conditions are varied; cycles numbers of 4, 5, 8, 10, 12, and 30k. Potential ranges of 0.5–1.0, 0.6–1.0, and 0.6–1.1 VRHE. Scan rates of 0.05 or 0.1 V s−1. The experiment conditions of higher cycle numbers, wide potential ranges, and low scan rates would lead to more pronounced ECSA degradation. This is also expected to influence both octahedral shape and mass activity. Therefore, although the stability comparison between treated and untreated PtNi electrocatalysts was conducted at the same cycle, the effect of the number of cycles, potential range, and scan rates could not disregard. In this regards, stability improvement factors from the all cycle numbers, which determined their stability, are provided. The detailed experimental conditions for each study are summarized in Table 1. Furthermore, we encourage the community to adopt standardized experimental conditions, such as the Accelerated Durability Test (ADT) protocol suggested by the Department of Energy (DOE). This will facilitate easier comparison of results across studies.
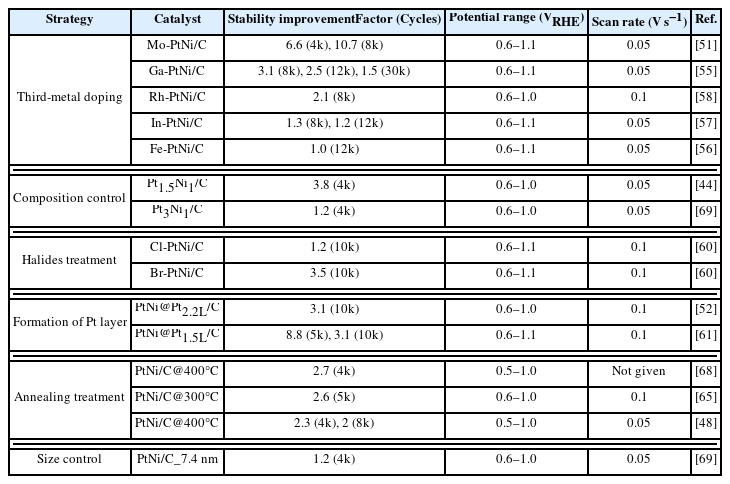
Summary of representative strategies for promoting stability in shape-controlled octahedral PtNi/C
As shown in Fig. 3, among the stabilities of various PtNi octahedral catalysts, that of Mo-doped PtNi octahedral (Mo-PtNi) was the highest showing improvement by a factor of 6.6 (4k) and 10.7 (8k). The stability of PtNi octahedral doped with elements other than Mo (i.e., Fe, In, Rh, and Ga) was enhanced by factors in the range of 1–3 (4k), highlighting the significance of the choice of the dopant [51,55–58]. However, Mo-PtNi has not been fully implemented in MEA; therefore, further research is required [51]. Size control showed a stability improvement factor of approximately 1.2 (4k), and research in this area has not been extensively pursued owing to the challenges of particle size control [69]. As for halide treatment, the stability of Br-or Cl-treated PtNi octahedral was improved by a factor of 1.2–3.5 (10k), compared to that of the untreated PtNi octahedral. However, there is a need to address the decrease in initial activity [60]. The annealing treatment at 300–400°C led to a change in shape, resulting in slower Ni leaching and improved stability by a factor of 2.3–2.7 (4k or 5k), while an increase in particle size during annealing negatively impacted the initial performance [48,67]. Therefore, establishing a balance between activity and stability is crucial. Composition control alters both activity and stability. Although the Pt3Ni1 composition is known to be the most active, the composition that achieves optimal stability remains a subject of ongoing debate, necessitating further research [44,69]. Formation of Pt layers was achieved through various methods and has demonstrated significant improvement by a factor of 8.8 (4k) and ~3.1 (8k), but optimizing the thickness of Pt layers is necessary [52,61].

Summary of some representative strategies for promoting the stability of shape-controlled octahedral PtNi/C compared using stability improvement factor. (References: size control [69], annealing treatment [48,65,68], formation of Pt layer [52,61], halides treatment [60], composition control [44,69], and third-metal doping [51,55–58])
Detailed information on each strategy is provided in the following sections in which we cover the stability improvement approaches, current development stages, and limitations of each strategy.
2.1. Third-metal doping
Introducing a third metal (i.e., Mo, Ga, Rh, In, Fe, etc.) onto the surface of PtNi octahedral effectively enhances catalyst stability, with Mo being the most effective in terms of improving ORR durability and activity [51,55–58]. The durability enhancement factors of reported third doped PtNi octahedral catalysts were in the following order: 6.6 (4k) and 10.7 (8k) (Mo-PtNi/C) [51] > 3.1 (8k), 2.5 (12k), 1.5 (30k) (Ga-PtNi/C) [55] > 2.1 (8k) (Rh-PtNi/C) [58] > 1.3 (8k) and 1.2 (12k) (In-PtNi/C) [57] > 1 (12k) (Fe-PtNi/C) [56] after potential cycling tests (Fig. 3). Other experimental [72–74] and theoretical calculations [51,72,73,75,76] have reported similar results, indicating that Mo doping is the most promising strategy for enhancing the durability of PtNi octahedral. However, further research at the MEA level is required.
Huang et al. [51] studied the activity of metal-doped octahedral PtNi/C using 8 transition metals (Mo, Cr, Re, W, Co, Fe, Mn, and V) and showed that Mo-PtNi/C has the highest ORR MA. The following order was noticed (MA enhancement): Mo (3.9) > Cr (2.5) > Re (2.3) > W (2.0) > Co (1.9) > Fe (1.4) > Mn (1.2) > V (0.9), as shown in Fig. 4. Further, Mo-PtNi/C showed 10.7 times higher stability than undoped-PtNi/C after 8k potential cycles of 0.6–1.1 VRHE. Through theoretical calculations, they demonstrated that Mo atoms prefer sites near the particle edges connecting two different (111) facets (Fig. 4d,e). The surface Mo atoms play a stabilizing role in the adjacent Pt sites, forming strong Mo-Pt and Mo-Ni bonds. Enhanced stability of both Pt and Ni atoms against dissolution leads to the increased activity and durability of Mo-PtNi/C.
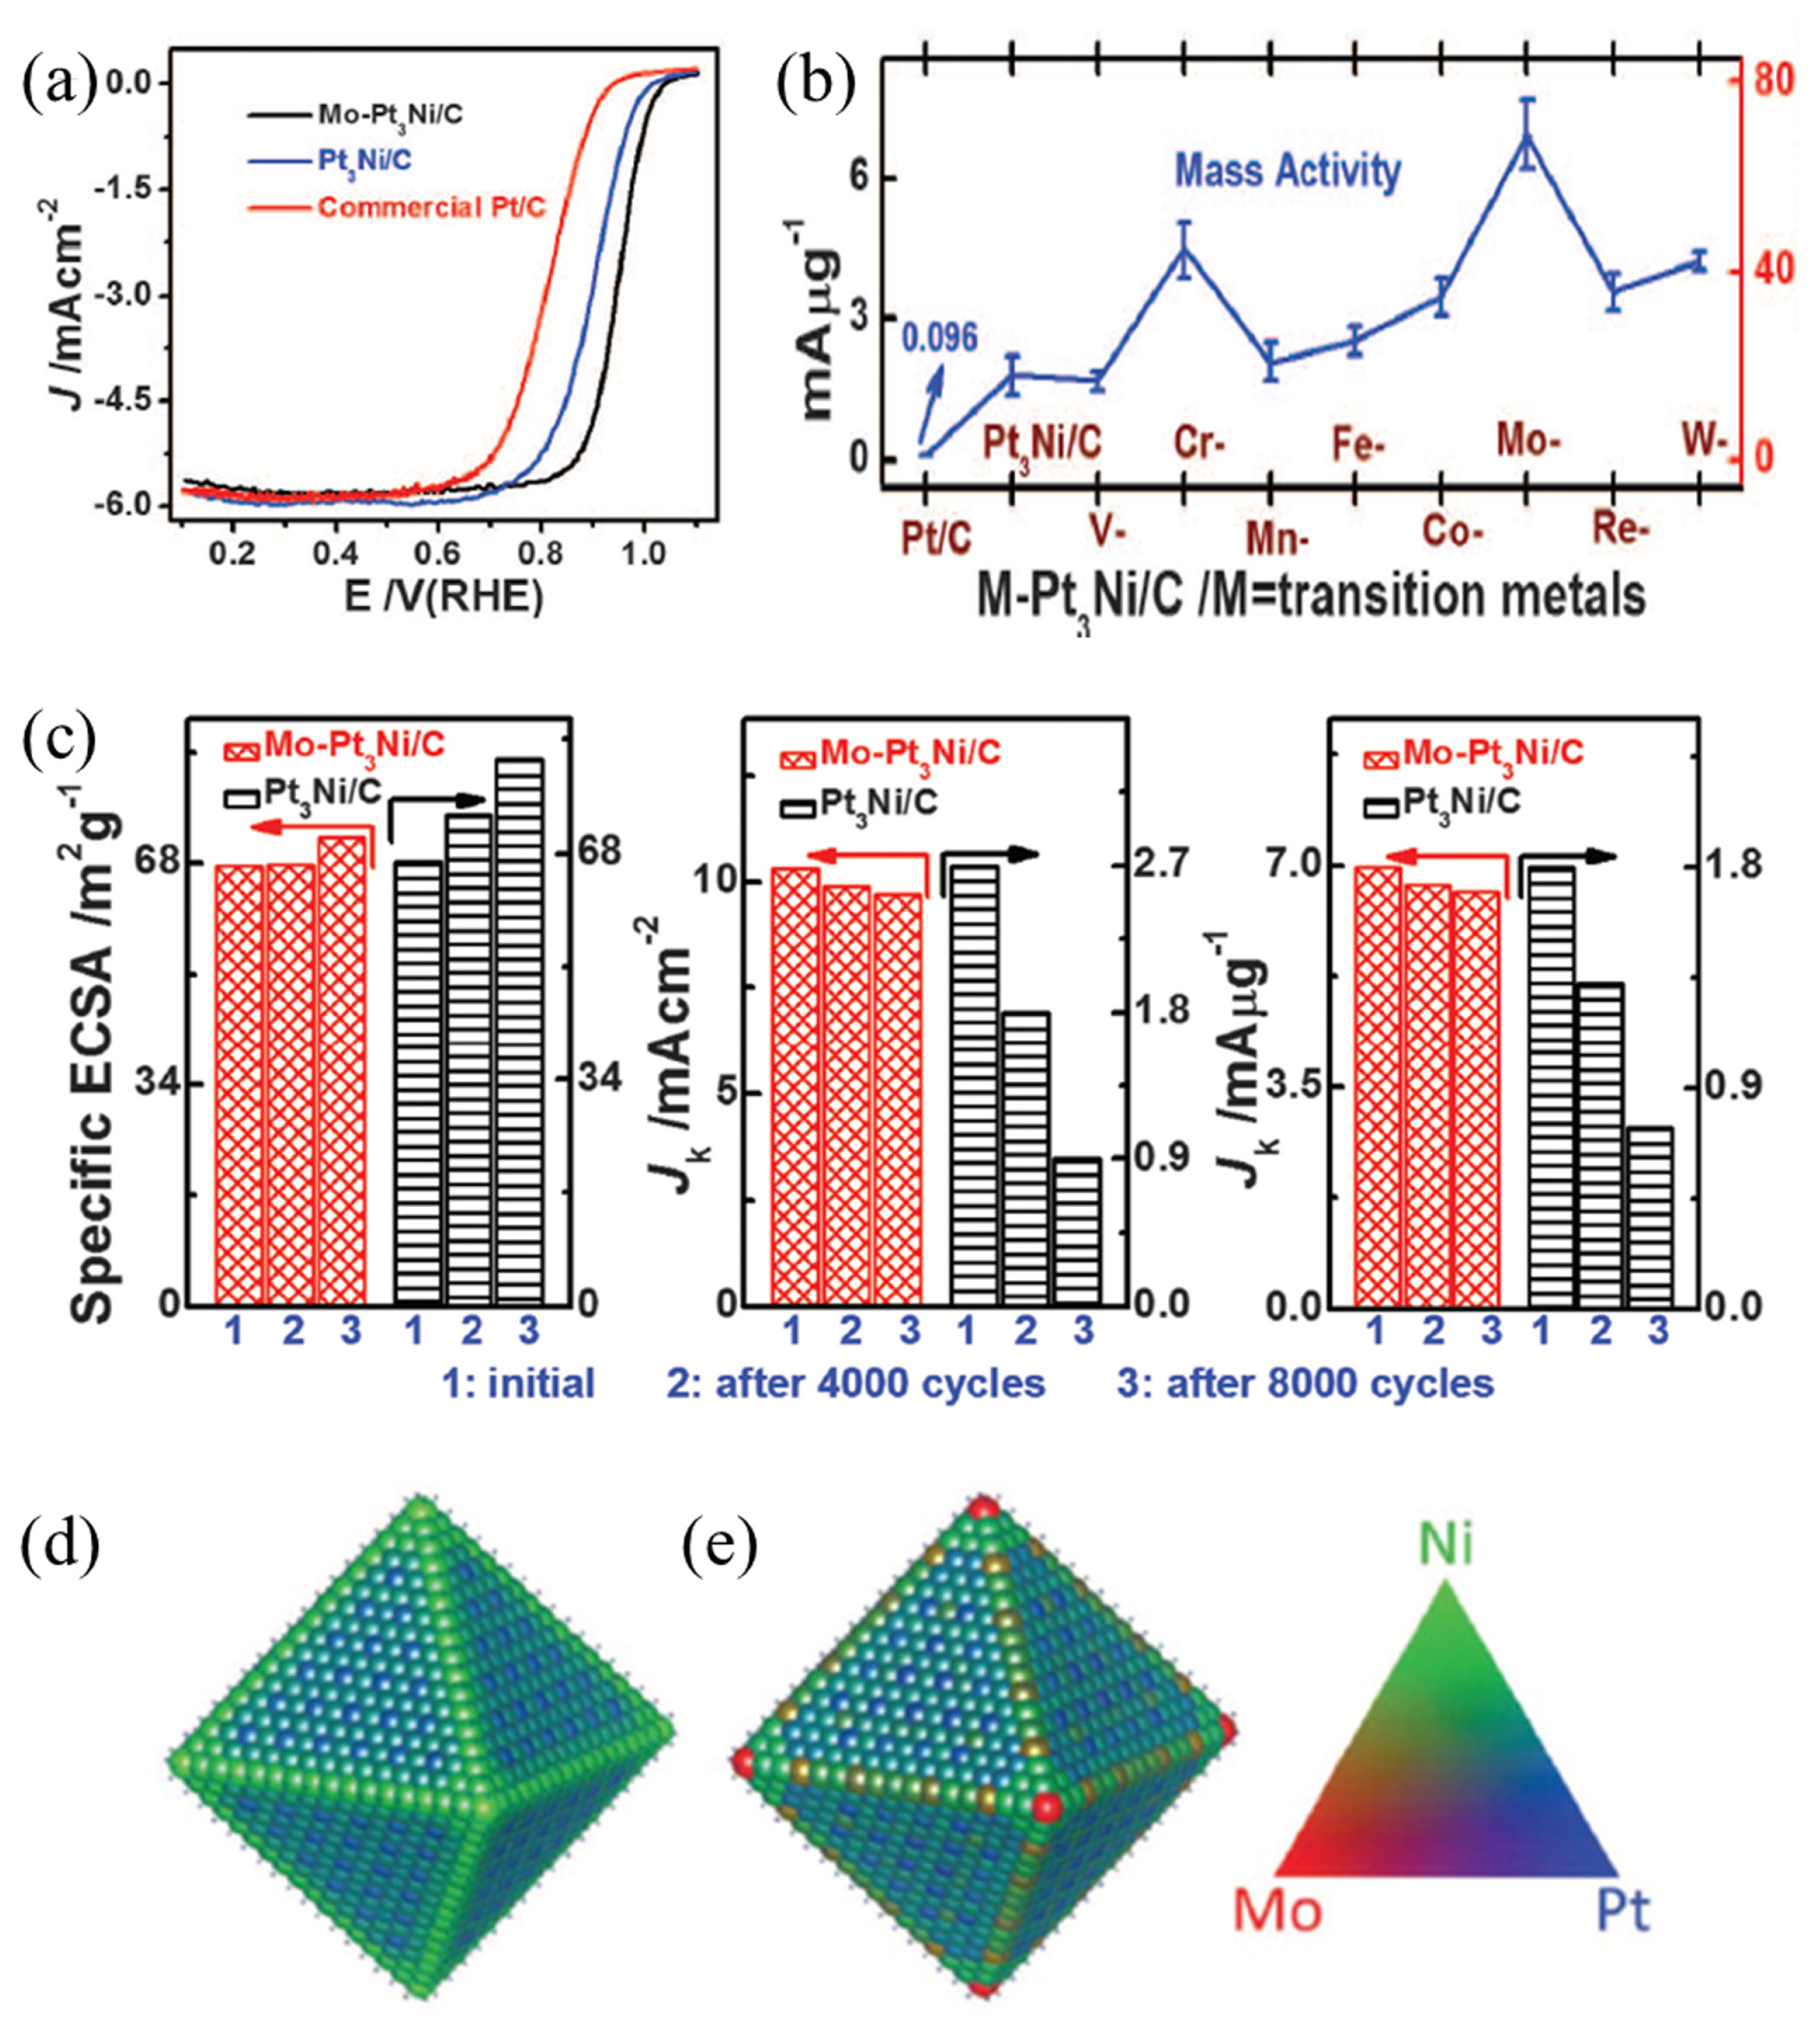
Third-metal doping for octahedral PtNi/C. (a) ORR polarization curves of Mo-Pt3Ni/C, Pt3Ni/C, and commercial Pt/C. (b) The electrochemically mass activity (MA) at 0.9 VRHE for transition metal-doped Pt3Ni/C catalysts. (c) The changes in ECSAs (left), specific activities (middle), and MA (right) of Mo-Pt3Ni/C and Pt3Ni/C before, after 4k, and after 8k potential cycles between 0.6 and 1.1 VRHE. The average occupancies of the second layer of (d) Ni1175Pt3398 and (e) Mo73Ni1143Pt3357 octahedra. Occupancies are indicated by the colored triangle on the right. Reprinted with permission from ref. [51], Copyright 2015 Science.
Although Mo-PtNi/C demonstrated promising results in RDE, further studies are required for its application in MEA. Donigi et al. [73] prepared an MEA (50 cm2 active area) using Mo-PtNi/C (17.9 wt%) as the cathode catalyst via a decal method on a perfluorosulfonic acid-type membrane. (Fig. 5a,b). It showed lower fuel cell performance at 0.6 V than that of Pt/C, indicating the need for high (40 wt%) Ptloading for thin CLs in electrode and MEA optimization. Although Mo-PtNi/C exhibited a higher MA of 0.45 A mgPt−1 than that of Pt/C with 0.28 A mgPt−1 at 0.9 V in the fuel cell tests, it possessed a lower current density of 1.17 A cm−2 at 0.6 V than that of Pt/C with a current density of 1.52 A cm−2. Hence, achieving approximately 40 wt% Pt loading is necessary because it can result in thin CLs that enable high mass transport [28–33]. This was supported by the results from MEA with different Pt loadings in Pt/C [31,32].
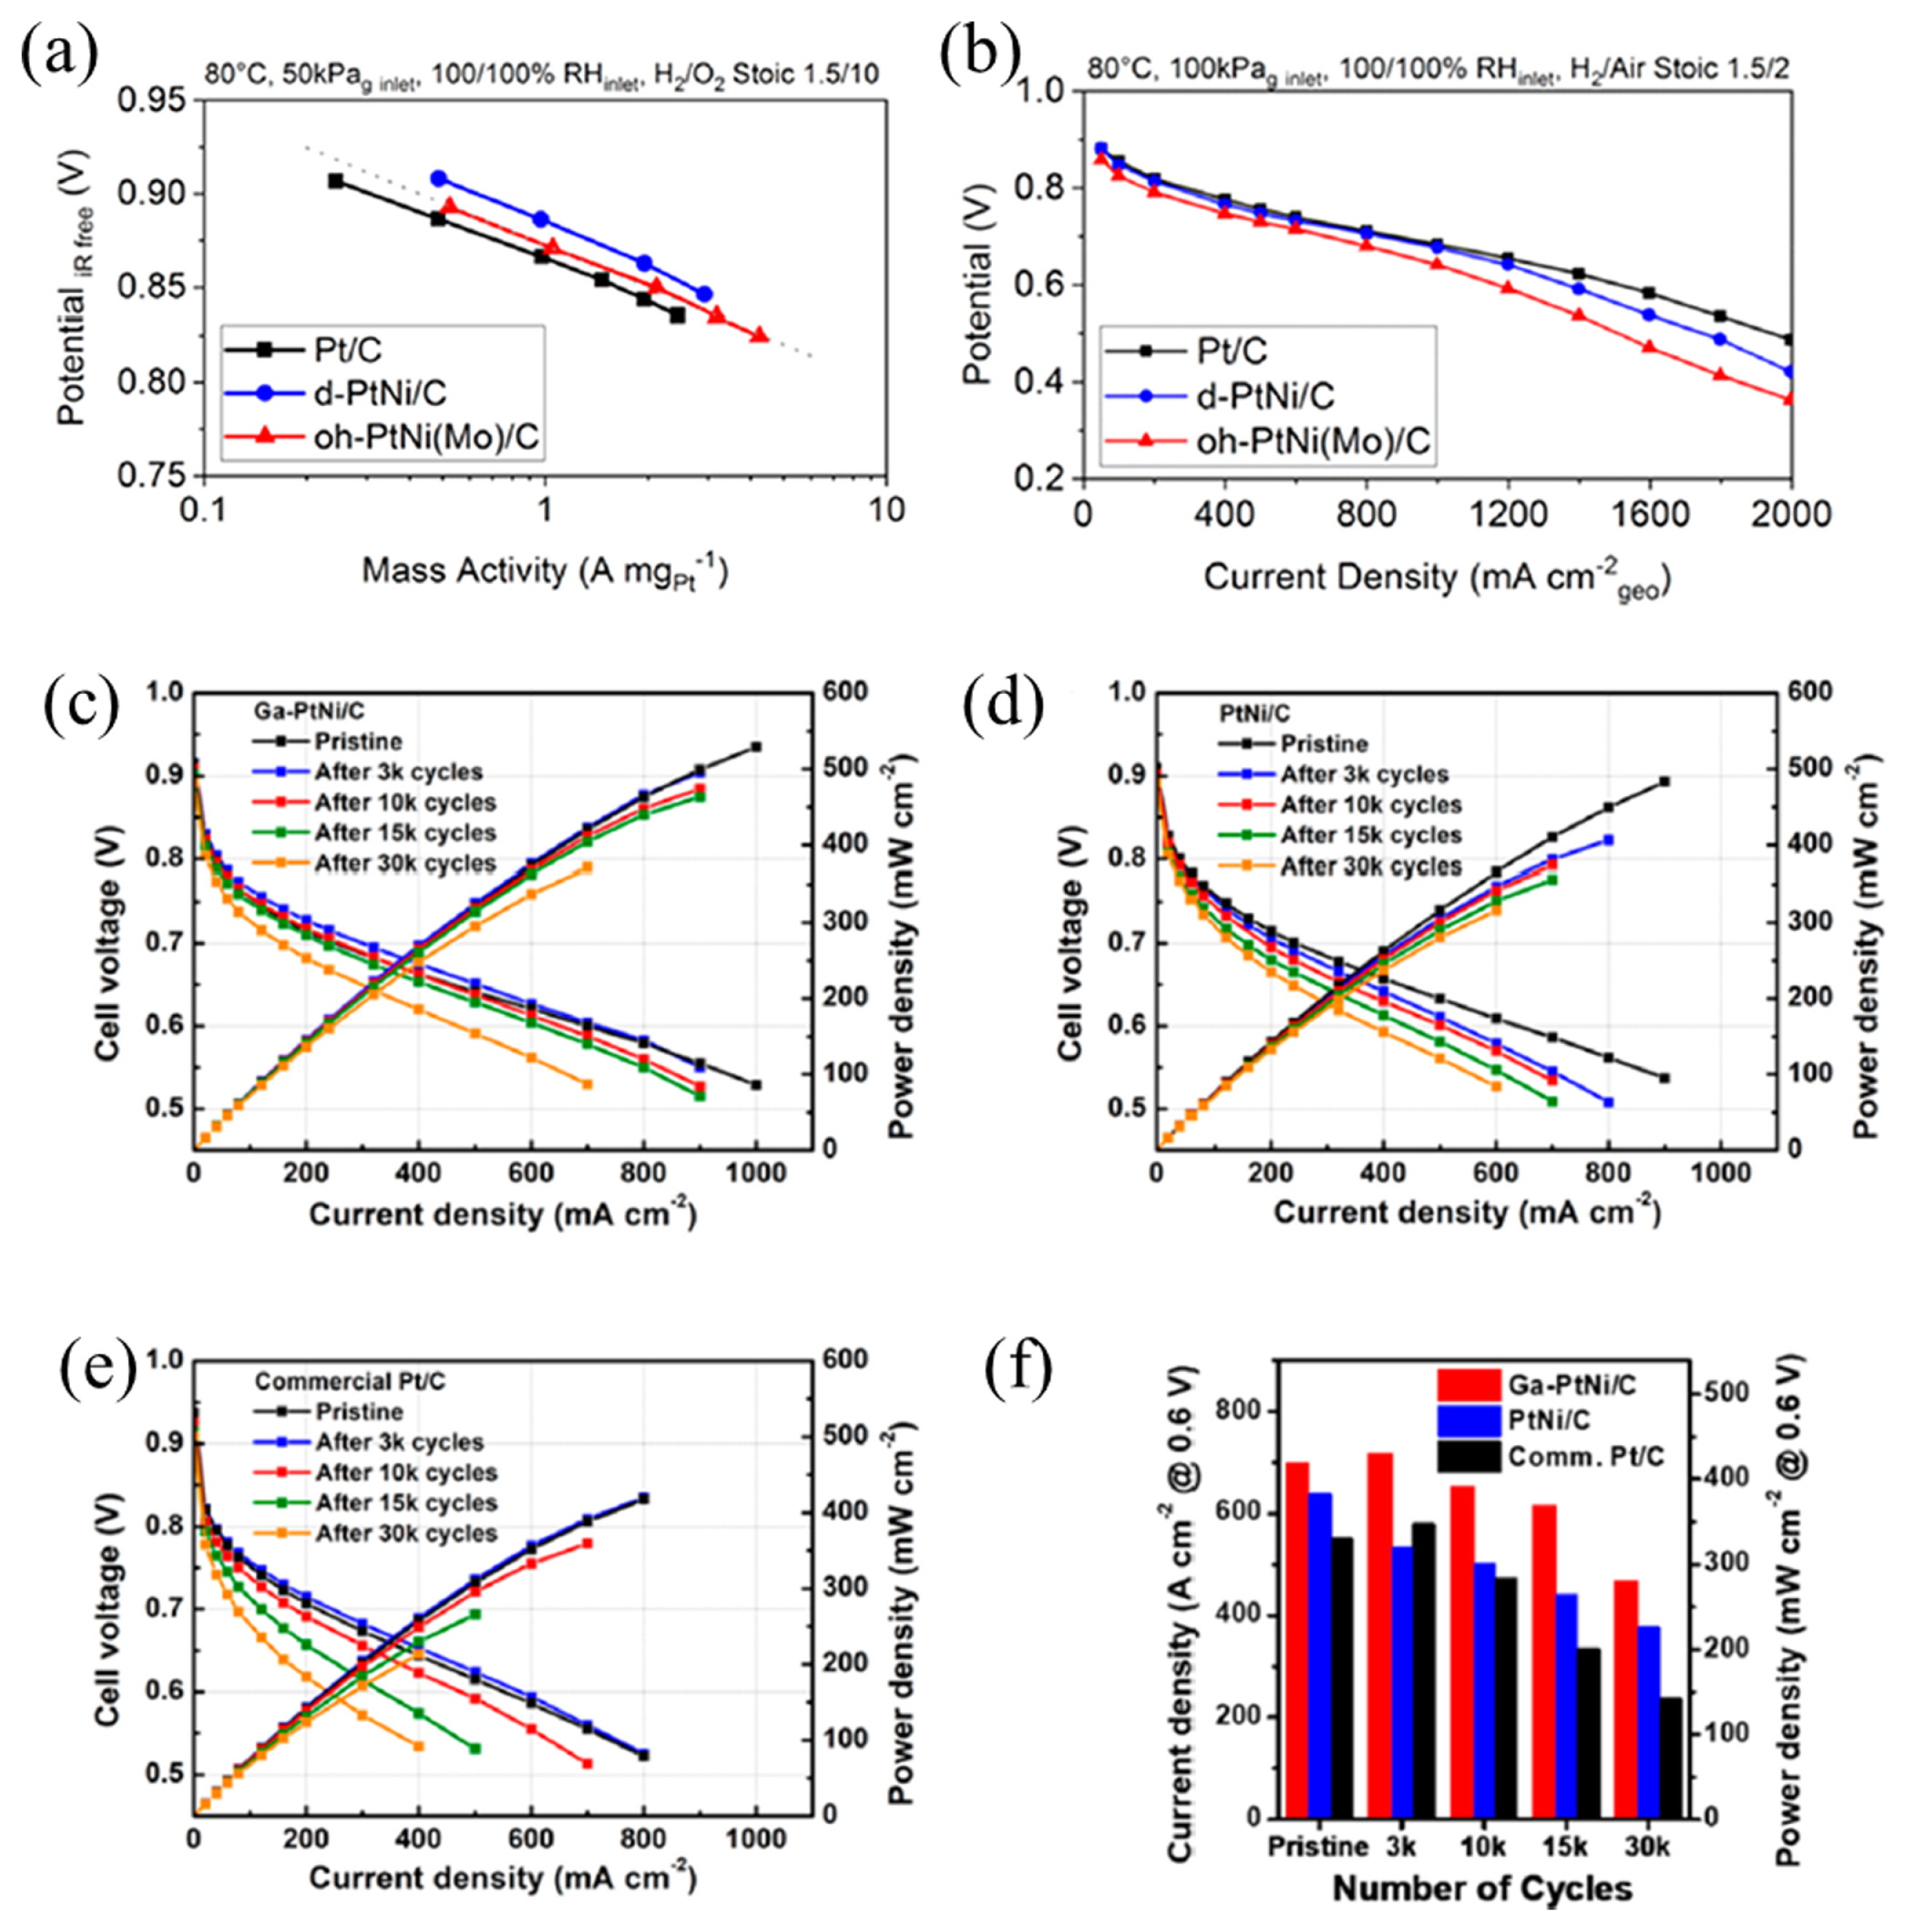
MEA performance of oh-PtNi(Mo)/C, d-PtNi/C, and Pt/C; (a) mass activity and (b) current density. The cathode loading was 0.2 mgPt cm−2 for Pt/C and 0.1 mgPt cm−2 for the other two catalysts. The loading for the anode was 0.1 mgPt cm−2. Reprinted with permission from ref. [73], Copyright 2019 American Chemical Society. Single-cell performance and long-term durability of the Ga-PtNi/C, PtNi/C, and commercial Pt/C as a cathode catalyst with Pt loading of 0.15 mgPt cm−2 (anode catalyst was the commercial Pt/C with Pt loading of 0.15 mgPt cm−2). Polarization curves for the single cells using (c) Ga-PtNi/C, (d) PtNi/C, and (e) commercial Pt/C recorded before and after 3k, 10k, 15k, and 30k cycles. (f) Current density (left) and power density (right) at 0.6 V of Ga-PtNi/C, PtNi/C, and commercial Pt/C. Reprinted with permission from ref. [55], Copyright 2018 American Chemical Society.
More recently, Lim et al. [55] reported that Ga-PtNi/C (14 wt% Pt) exhibited higher performance and durability than commercial Pt/C (46 wt% Pt). They screened doping elements (such as Ga, Gd, Ru, Zr, Pb, Zn, and Bi) not explored by Huang et al. [51] and found that Ga-PtNi exhibited the highest ORR MA, showing a stability improvement factor of approximately 3 in the RDE. After 30k cycles, Ga-PtNi mostly kept their octahedral shape, whereas PtNi nanoparticles turned spherical after only 4k cycles. Despite surface Ni atom dissolution, Ga-PtNi maintained 30% Ni content (initially 38%) along with 1.9% Ga. In contrast, Ni content in PtNi dropped from 40% to 10% over 30k cycles. Adding Ga to PtNi nanoparticles hindered Ni dissolution. The theoretical calculations revealed that the addition of Ga onto the PtNi surface successfully hindered the oxidation process of Pt and Ni, consequently diminishing the dissolution of both Pt and Ni from the nanoparticles. For the fuel cell tests (Fig. 5c–f), an MEA (5 cm2) was fabricated with Ga-PtNi/C on a Nafion 211 membrane (DuPont) using the spray method. Ga-PtNi/C (14 wt% Pt) exhibited a 1.26- and 1.7-fold higher fuel cell performance and durability, respectively, than that of commercial Pt/C (46 wt% Pt). Although further MEA validation is necessary, this highlights the potential of stability-enhancing third doping PtNi catalysts in fuel cells.
2.2. Composition control
The composition of PtNi is a crucial factor in determining not only the stability of PtNi octahedral electrocatalysts but also their activity. However, this aspect requires a deeper understanding through further research [44,59,69]. The PtNi composition alters the electrochemical structure of the catalyst, thereby influencing its activity and resistance to degradation. Although a Pt3Ni1 composition is known to be the most active, the composition that achieves optimal stability is still a subject of ongoing debate [69].
Cui et al. [44] studied the activities and stabilities of Pt1.5Ni1, Pt1Ni1, and Pt1Ni1.5. The MAs in the RDE were calculated as 1.16, 1.65, and 1.02 A mgPt−1. However, the losses of the MAs were estimated to be 17.2, 55.7, and 46.1%, respectively. They indicated that these differences in stability arose from variations in the ratio of the (111) facets that were maintained during durability testing which were determined by the composition (Fig. 6) [44].
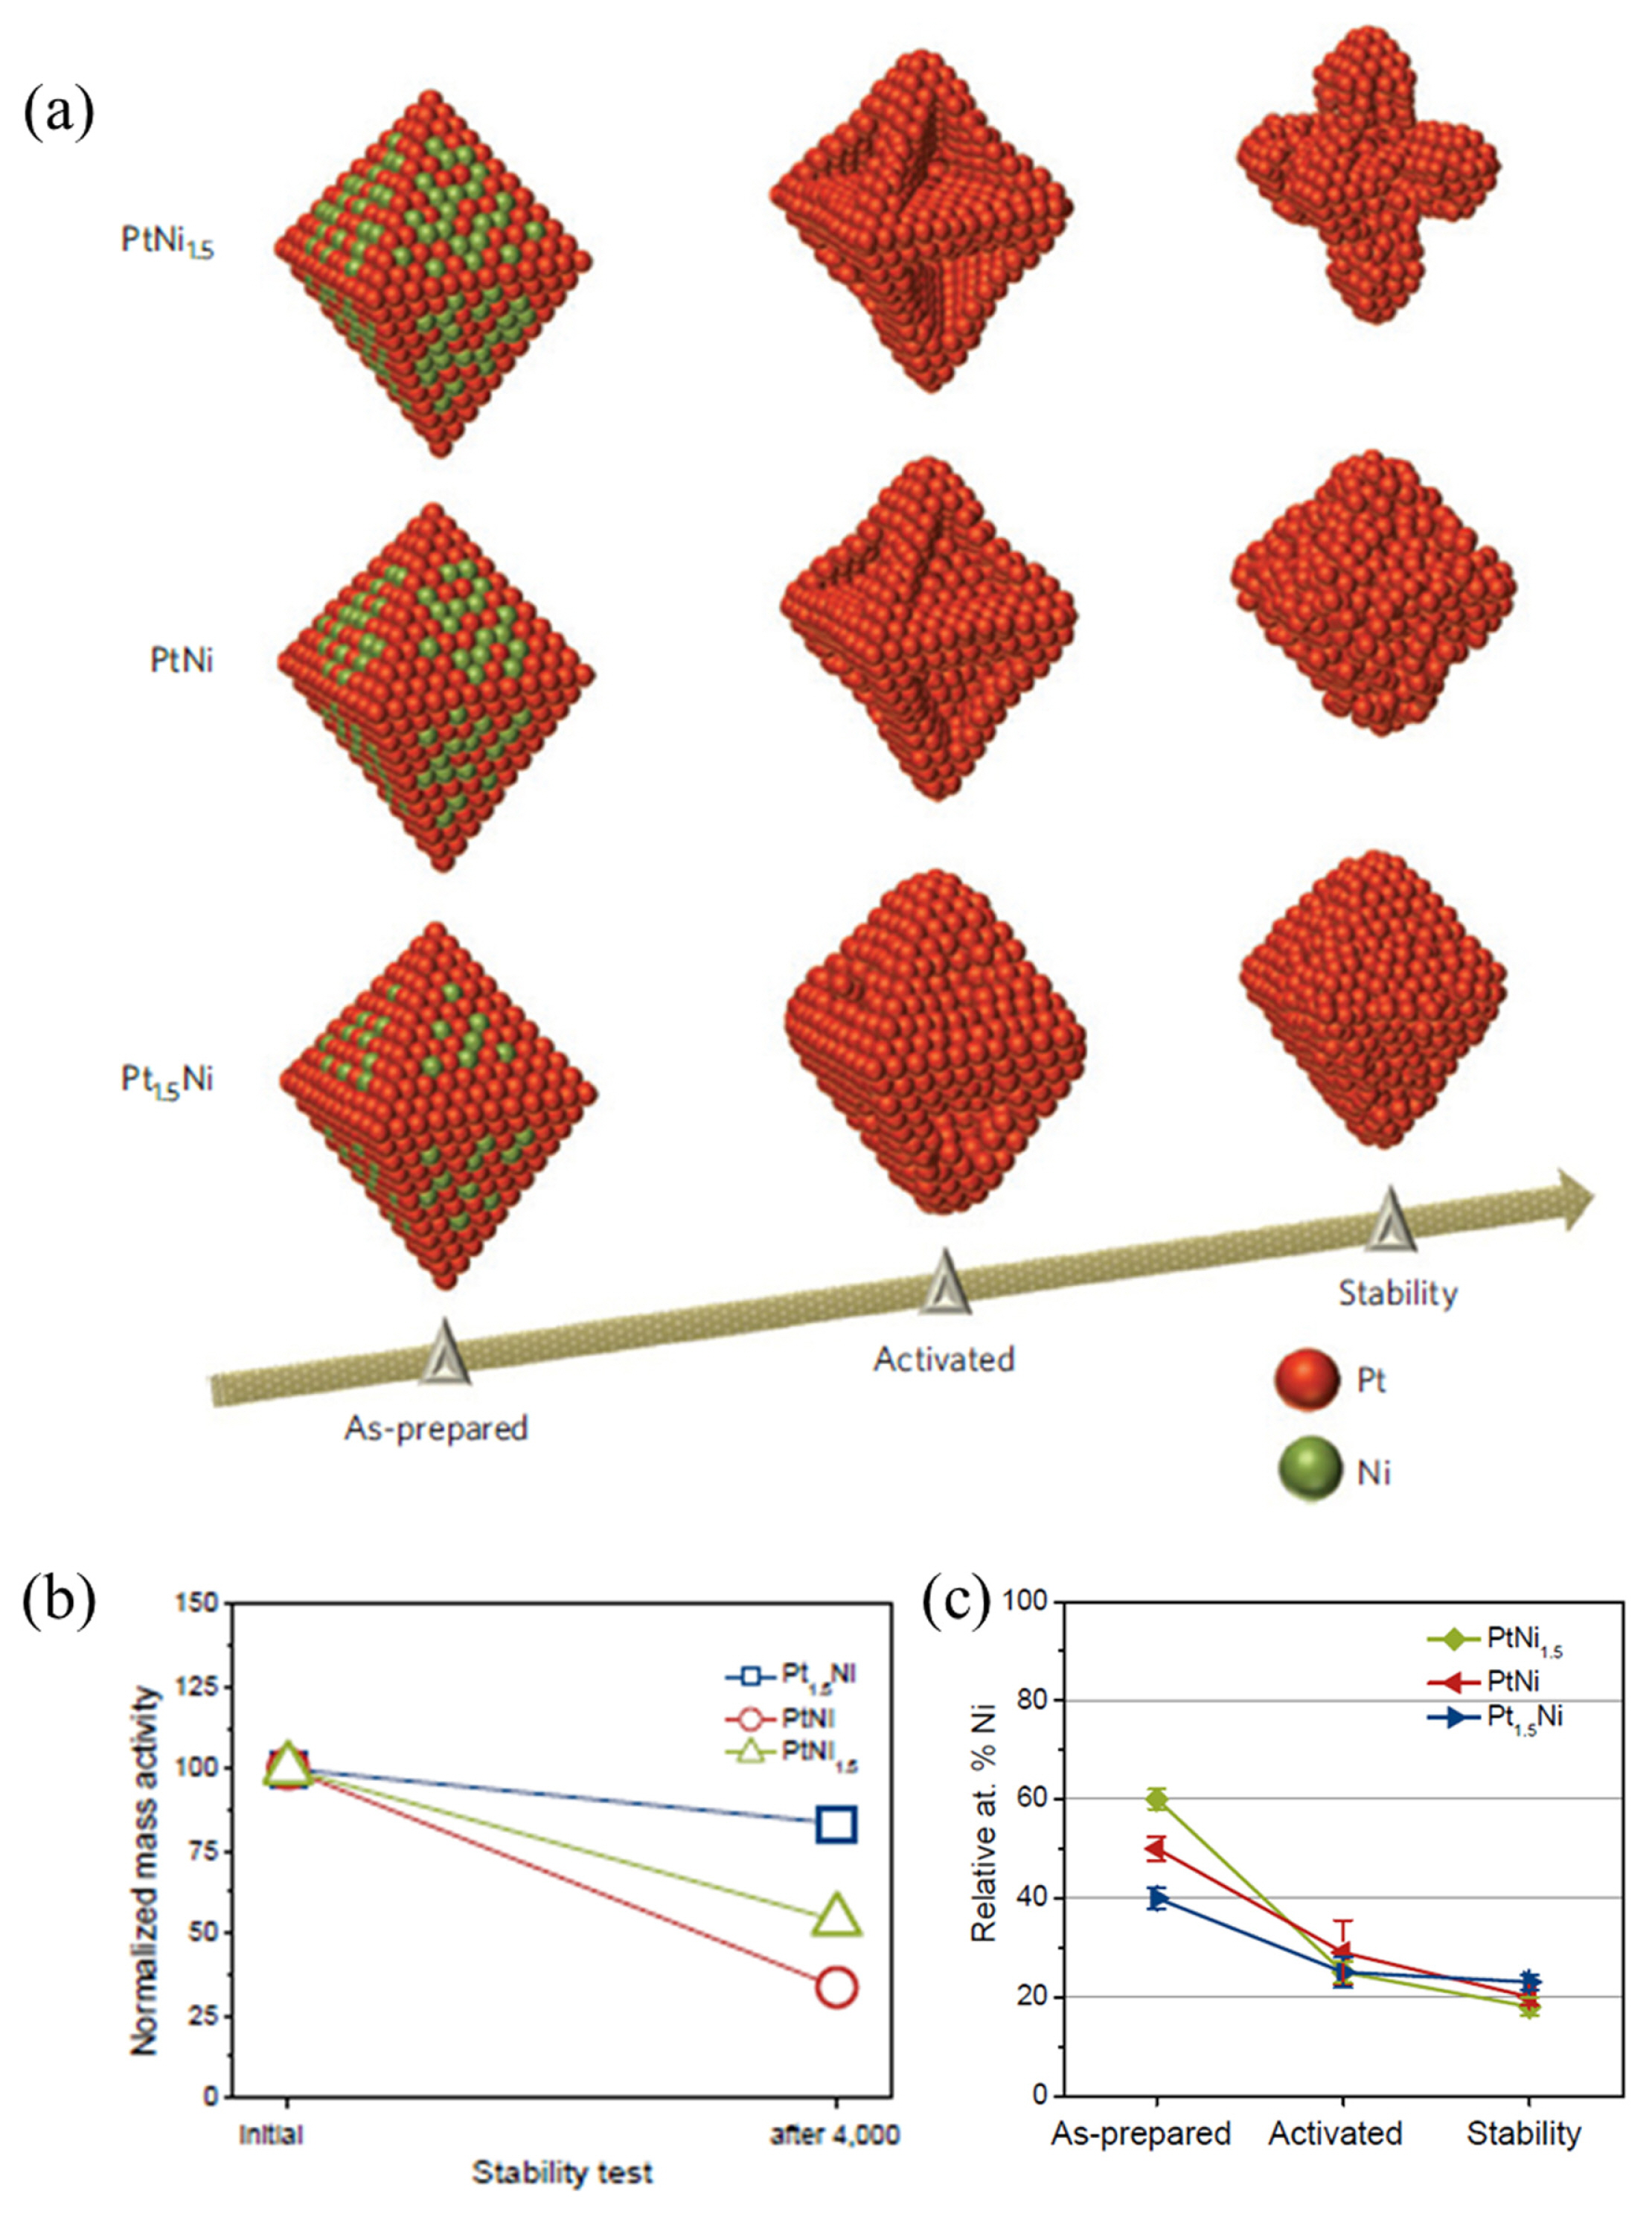
(a) Schematic representation of Pt1.5Ni1, Pt1Ni1, and Pt1Ni1.5 morphology and surface structure changes after electrochemical surface activation (25 potential cycles) and electrochemical stability tests. (b) Mass activities and (c) Ni leaching rates of Pt1.5Ni1, Pt1Ni1, and Pt1Ni1.5 after different kinds of electrochemical processing. Initial and activated represent after 3 and 25 potential cycles, respectively, in the potential region 0.06–1.0 VRHE at a scan rate of 0.25 V s−1. Reprinted with permission from ref. [44], Copyright 2013 Nature.
Zhang et al. [69] reported similar results. They studied Pt3Ni1 and Pt1.5Ni octahedral, in which the MAs decreased by approximately 52.5% and 58.9%, respectively, after potential cycling tests. However, TEM analysis revealed that Pt1.5Ni maintained more octahedral nanoparticles, whereas the octahedral shape of Pt3Ni was more rounded. These findings suggest that ORR activity is not influenced by the depletion of surface sites or the composition of bulk Ni; rather, it is governed by the detailed near-surface structure and composition [44,69].
2.3. Halide treatment
In terms of halide treatment (Fig. 7), the Br-treated PtNi octahedral exhibited higher stability than the untreated PtNi octahedral, but there is a need to address the decrease in initial activity [60]. Choi et al. [60] synthesized carbon-supported PtNi octahedral using the conventional DMF method and subjected them to halide treatment to enhance their stability. NH4X (X = F, Cl, Br, I) in a 1:1 molar ratio with Ni was adsorbed using a simple solution-mixing method. DFT calculations revealed that halogen atoms were preferentially adsorbed onto Ni sites rather than onto Pt sites. Shape changes were not observed after halide treatment. The calculated initial MAs of PtNi treated with F, Cl, Br, and I were found to be 0.41, 0.40, 0.21, 0.37, and 0.03 A mgPt−1, respectively, demonstrating a lower initial activity than that of the untreated PtNi. This decrease is attributed to halide elements blocking the active surface Pt sites. Among them, Br-PtNi exhibited a 15% loss in MA, whereas the other catalysts exhibited an approximately 50% loss. They revealed that the presence of Br on the nanoparticle surface prevented surface Ni from leaching and played a role in maintaining the octahedral shape, resulting in enhanced ORR stability. Furthermore, optimization of the halide treatment method and the amount adsorbed are required.
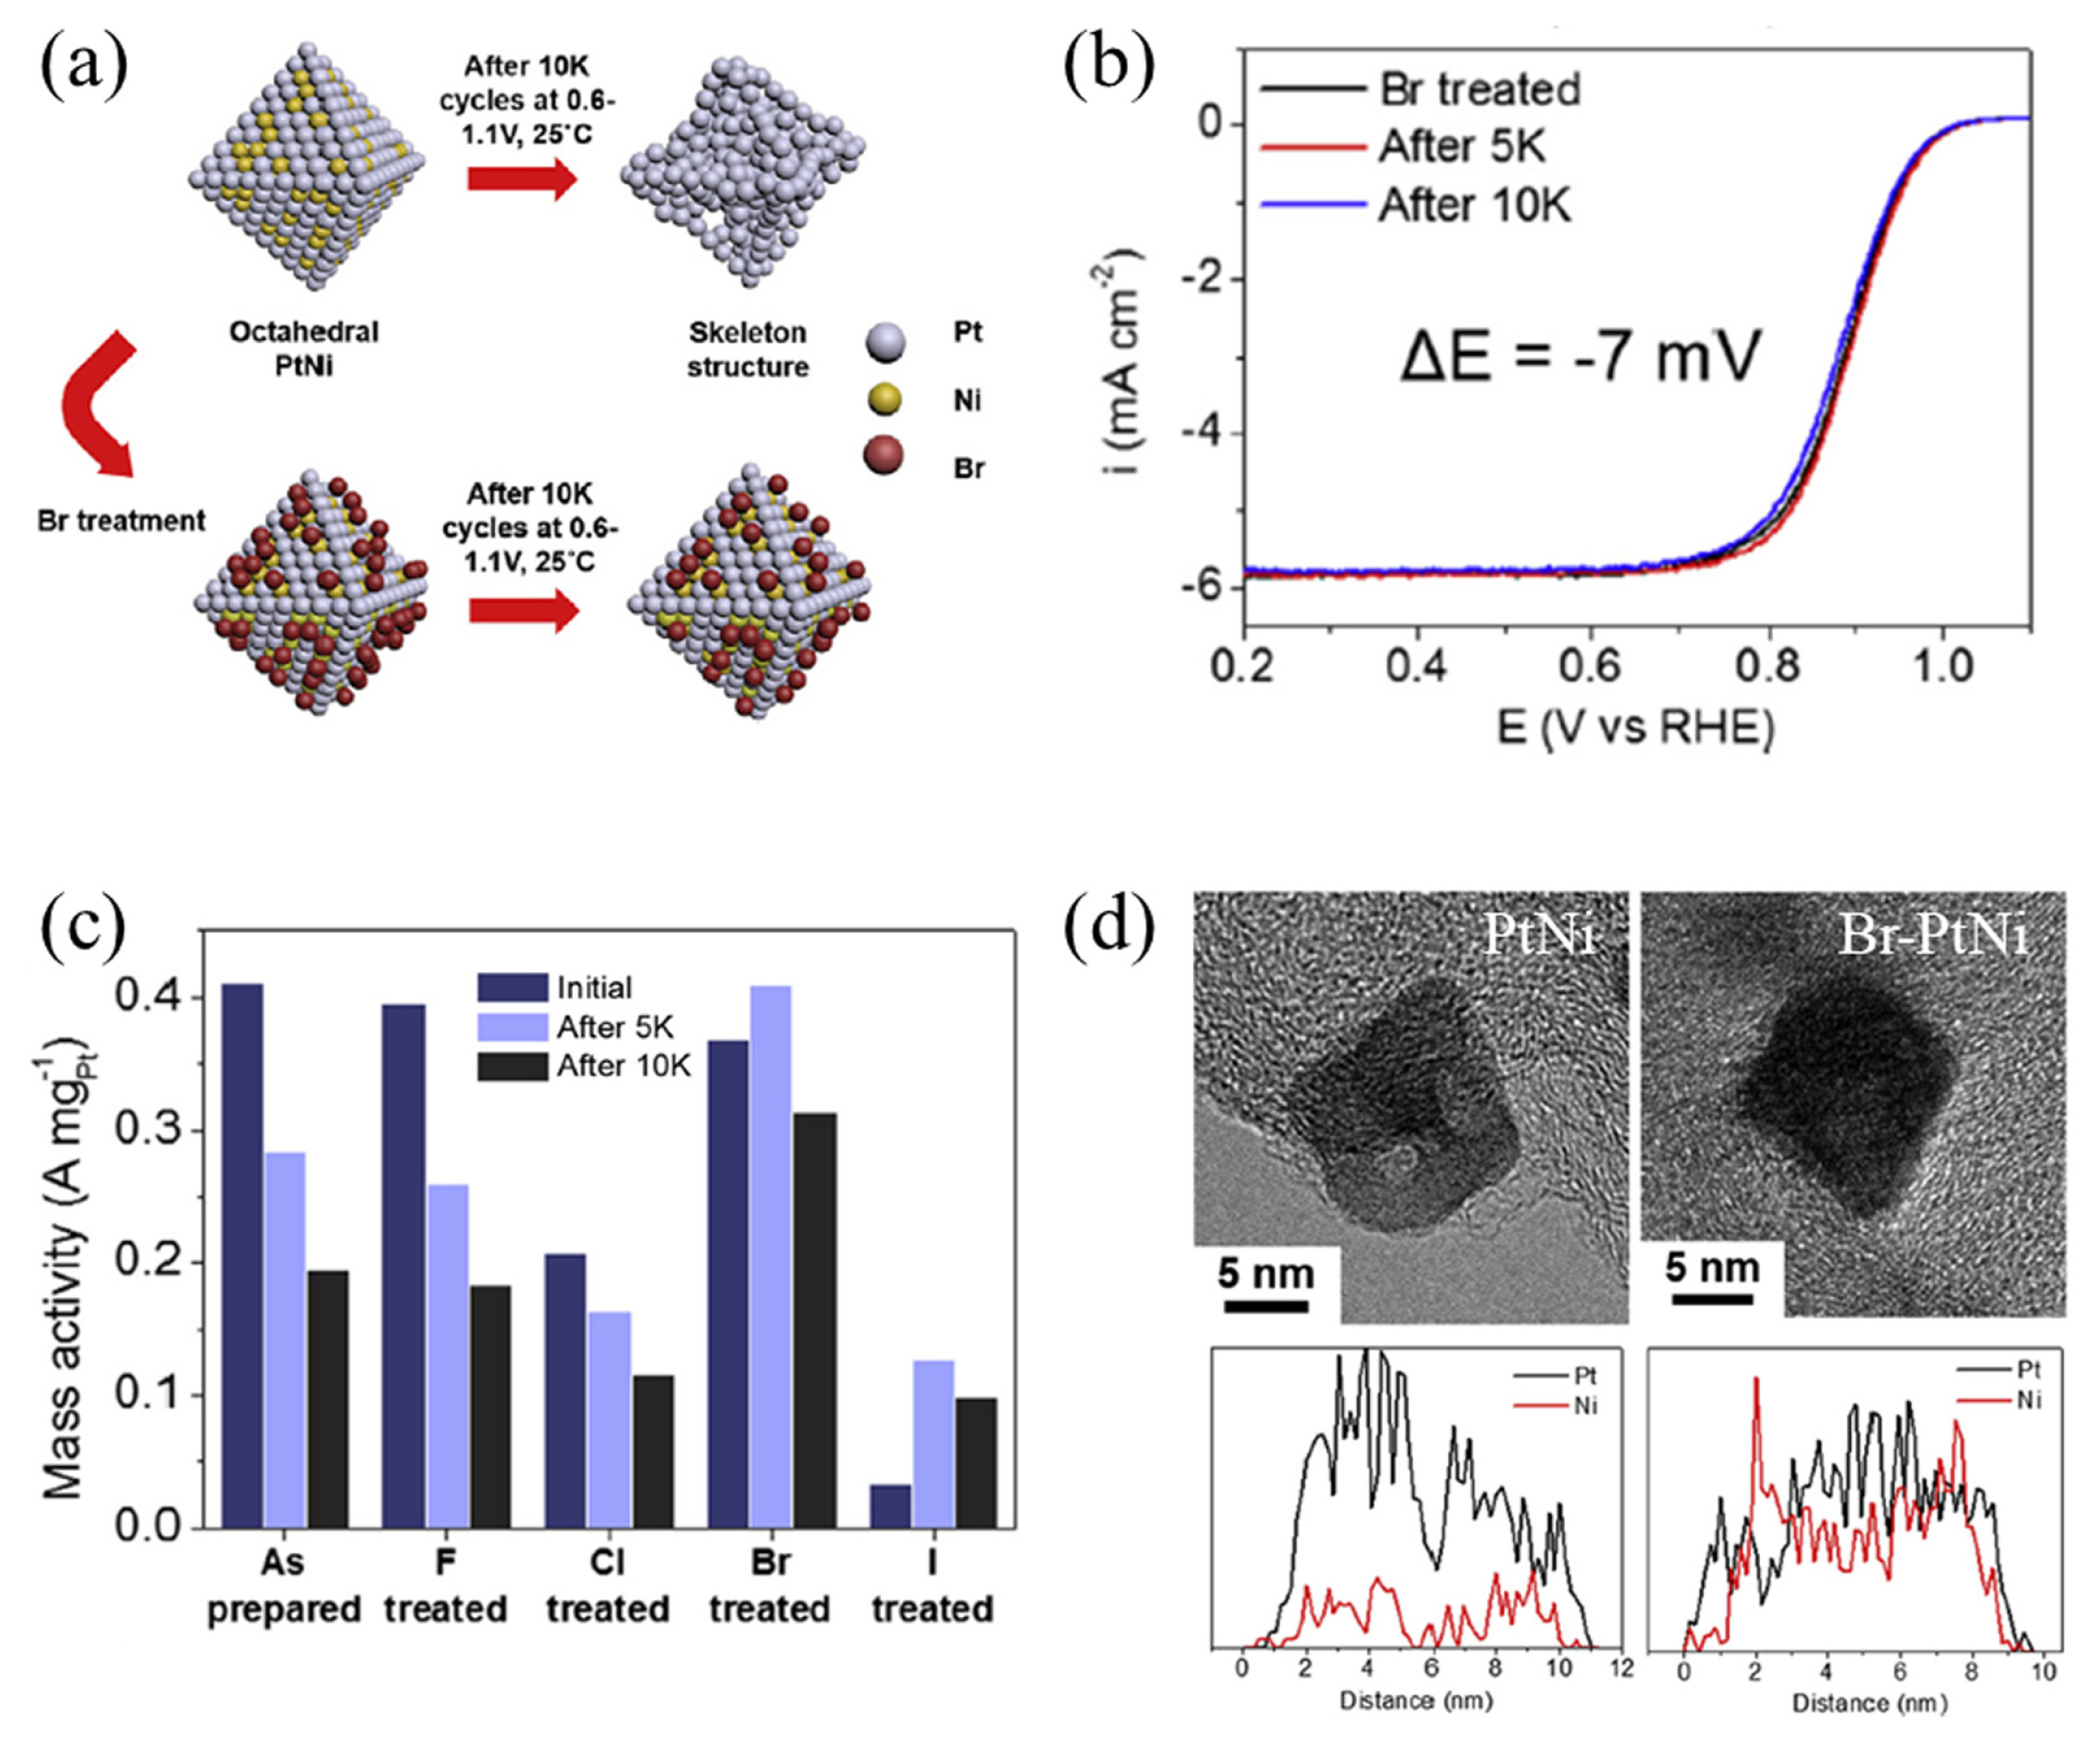
(a) Scheme for enhancing the stability of the PtNi octahedra via halide (Br, F, Cl, and I) treatment. (b) ORR polarization curves of Br-PtNi/C after 5k and 10k potential cycles in the potential range of 0.6–1.1 VRHE. (c) Change in ORR mass activity after the accelerated durability tests. HR-TEM and Pt and Ni elemental distribution image of (d) PtNi/C and (b) Br-PtNi/C after 10k cycles. Reprinted with permission from ref. [59] copyright 2016 Elsevier.
2.4. Formation of Pt layer
The formation of Pt layers, which significantly improves stability, is achieved through various methods. However, optimizing the thickness of the Pt layers is necessary (Fig. 8) [52,61–64]. A thin layer of Pt (around 0.3–0.45 nm) on the PtNi surface acts as a protective barrier, preventing direct contact between PtNi and the electrolyte [52,63]. As a result, this layer can inhibit Ni oxidation and dissolution, ultimately reducing the performance degradation. Furthermore, the Pt layer favorably alters the binding energy of the oxygen intermediates and enhances the activity of the ORR [52,77]. Several methods can be used to form a Pt layer, including Cu underpotential deposition (UPD), galvanic replacement [52], additional Pt reduction [61,63], and electrochemical approaches [62].
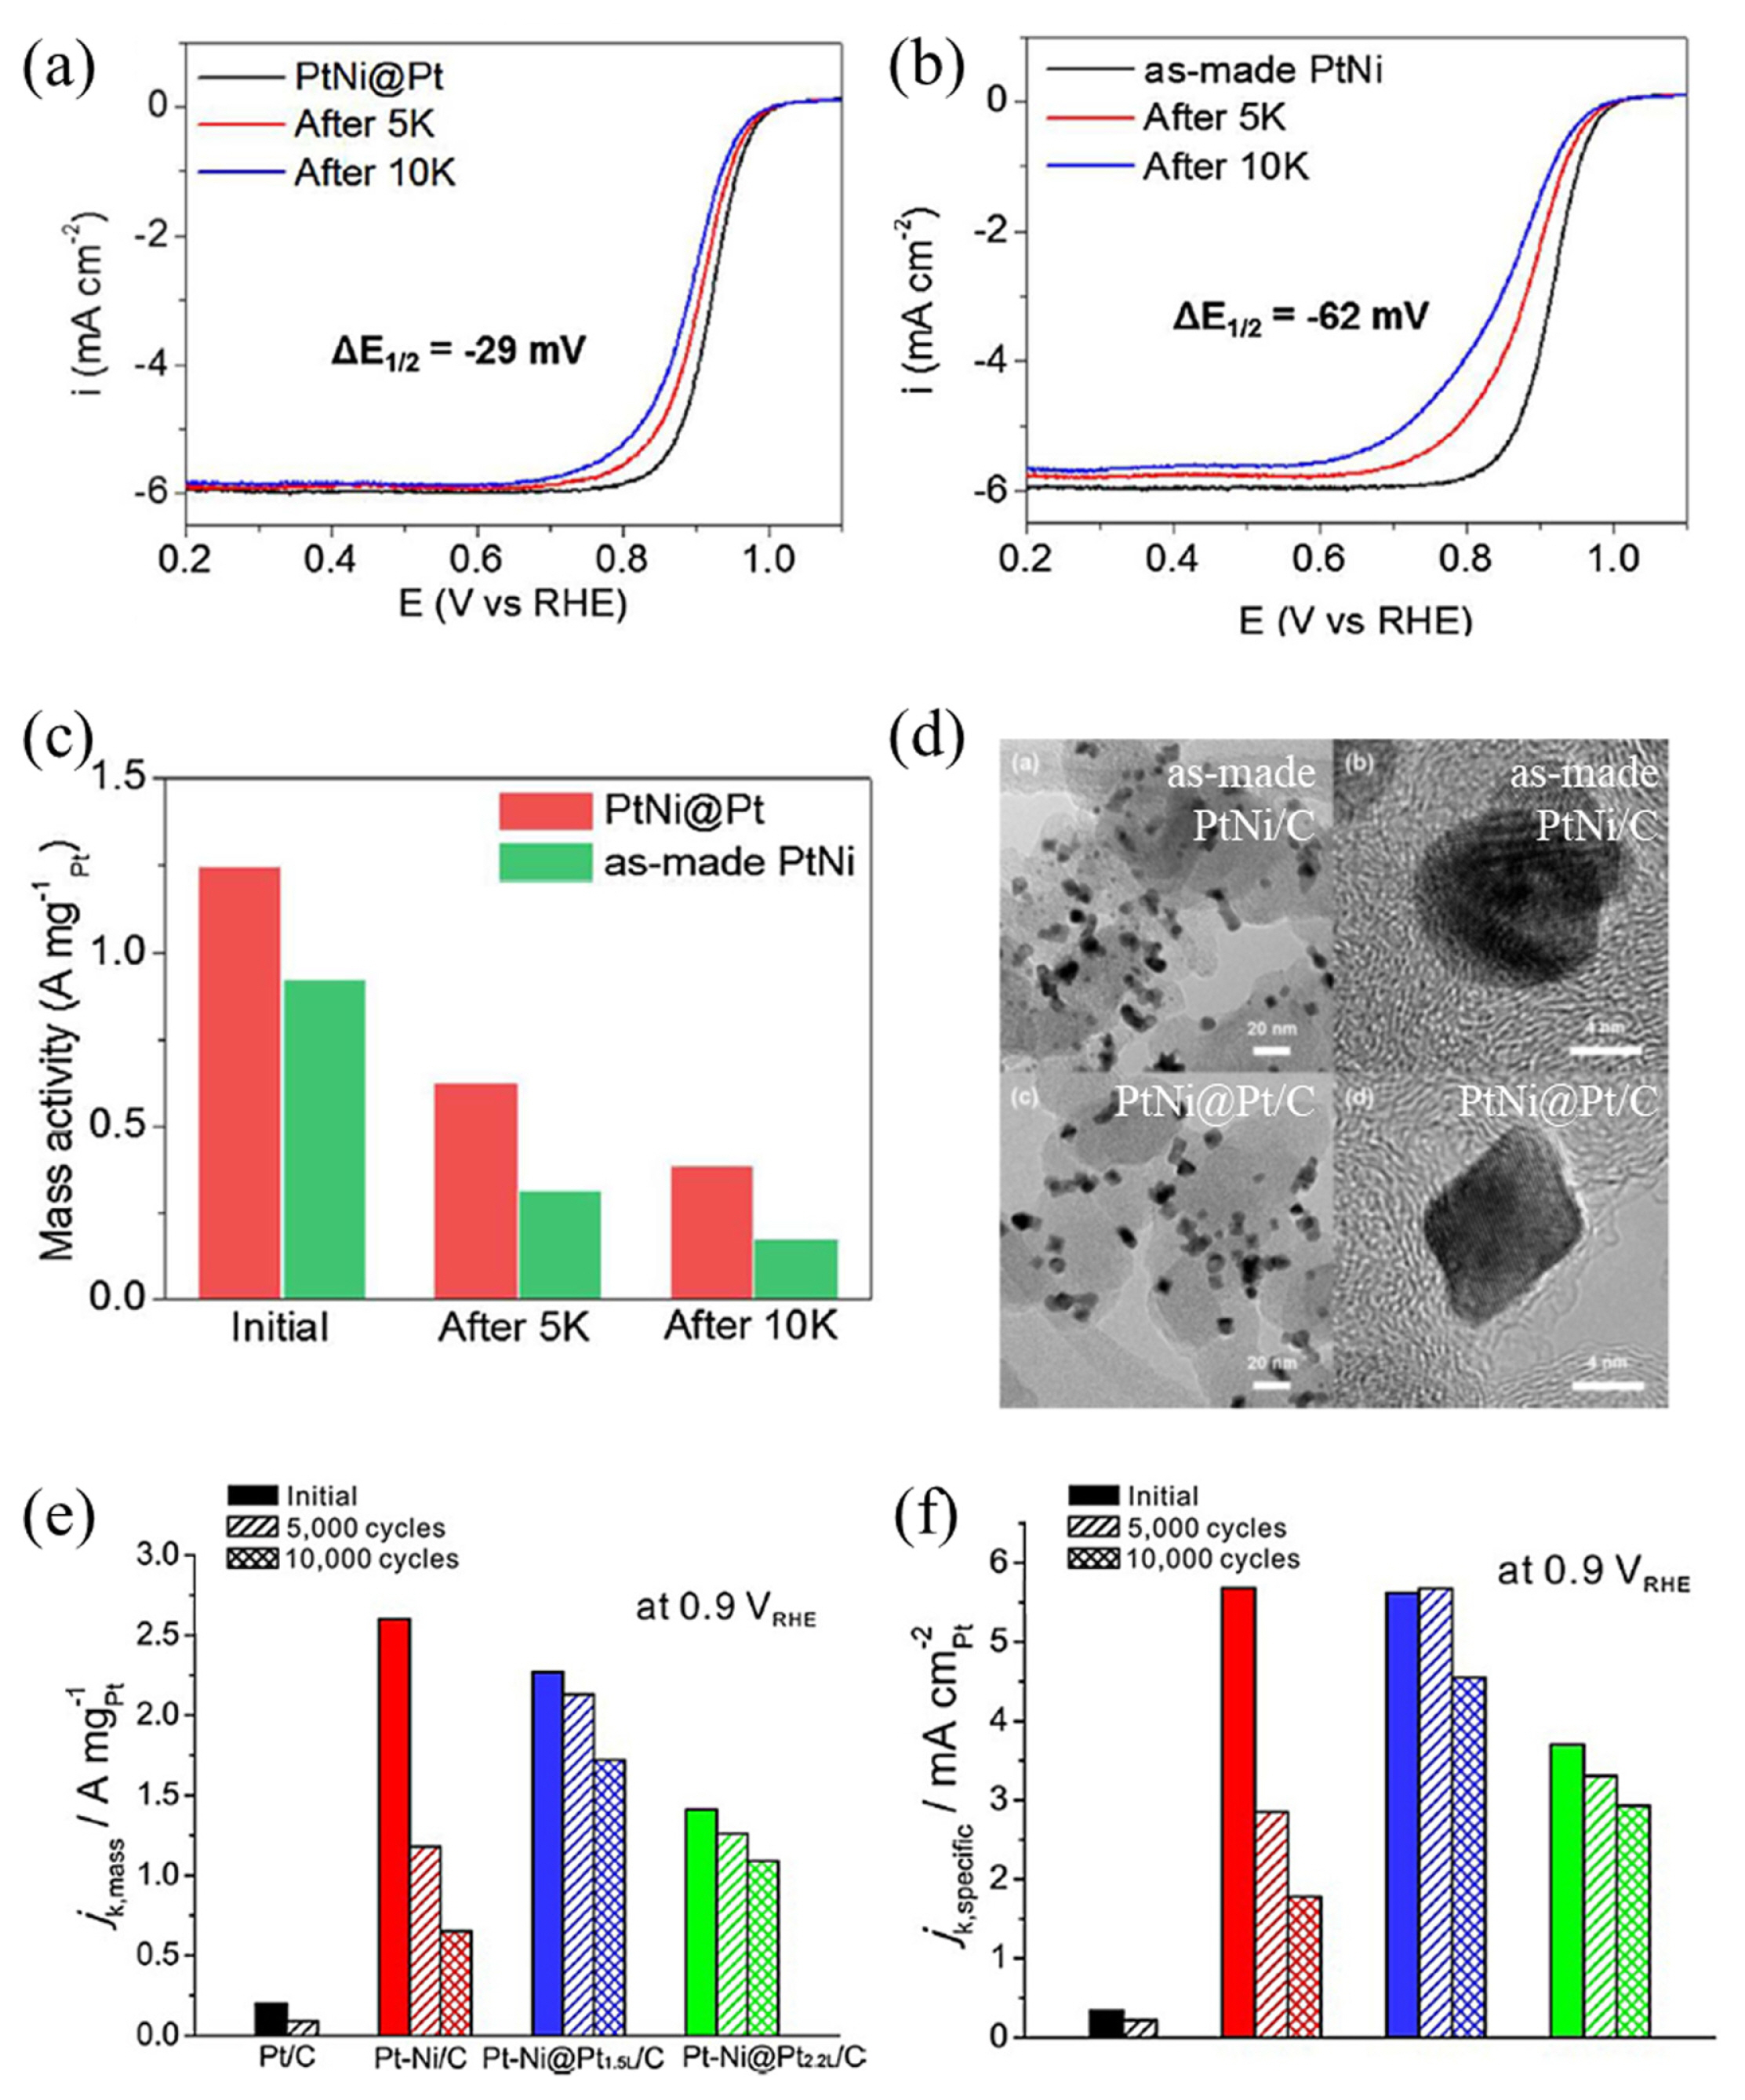
ORR polarization curves of (a) PtNi@Pt and (b) as-made PtNi. (c) The mass activities (MA) for the PtNi@Pt and as-made PtNi after 5k and 10k. The ADT was performed in the range of 0.6–1.0 VRHE at a scan rate of 0.1 V s−1. (d) TEM and HR-TEM images of the as-made PtNi/C and PtNi@Pt/C after 10k cycles of the ADT. Reprinted with permission from ref. [52], Copyright 2017 Elsevier. ORR MA of Pt/C, PtNi/C, PtNi@Pt1.5L/C, and PtNi@Pt2.2L/C before and after the accelerated durability tests. For the durability tests, mass activities were measured after sweeping 5k and 10k cycles between 0.6 and 1.1 VRHE at a rate of 0.1 V s−1. Reprinted with permission from ref. [61], Copyright 2016 Wiley-VCH.
Choi et al. [52] synthesized octahedral PtNi with Pt overlayers (PtNi@Pt) supported on carbon using Cu-UPD and galvanic replacement. They revealed that approximately 2.2 Pt overlayers were deposited on the PtNi octahedral considering that the distance between the Pt (111) planes is 2.27 Å. PtNi@Pt exhibited an increased stability, higher by 1.2-fold than that of PtNi, after 10k cycles at 0.6–1.0 VRHE in RDE. Based on TEM and ICP-MS results, it was observed that PtNi@Pt maintained its octahedral shape well after 10k cycles, whereas PtNi exhibited a spherical morphology with 2.8 times higher Ni concentration detected in the electrolyte after 10k cycles. It shows that the presence of Pt overlayers led to a substantial decrease in Ni leaching, enhancing the durability of PtNi octahedral. The single-cell test results also confirmed the improved durability of the octahedral PtNi with a Pt-layer catalyst, showing a 42% performance loss at 0.6 V while 52%, and Pt/C.
Park et al. [61] reported the significance of Pt shell thickness. They found that PtNi@Pt1.5L/C and PtNi@Pt2.2L/C showed similar stabilities, showing only a decrease of 25 and 22% after 10k cycles, respectively, while that of PtNi/C decreased by 75%. These results confirm the ability of the Pt shell to significantly enhance catalytic stability. The catalytic nanocrystals within the PtNi@Pt1.5L/C catalyst maintained their initial octahedral form without any signs of aggregation, even following 10k cycles of potential sweeping. In contrast, the PtNi/C lost their original octahedral shape and became spherical after the same number of cycles. However, PtNi@Pt2.2L/C exhibited a lower initial ORR activity than did PtNi/C. They proposed that the influence of the ligand effect originating from Ni in the core ceased when the Pt shell thickness exceeded two atomic layers [61]. Therefore, research on optimizing the thickness of the Pt layers for further improvement in durability is required.
2.5. Annealing treatment
Annealing treatment methods using a reductive mixture of H2 and Ar gases at 300–400°C are a convenient and effective approach for enhancing the stability of octahedral PtNi, but addressing the decrease in performance caused by the accompanying increase in particle size during heat treatment is essential (Fig. 9) [48,65–68]. The change in shape after annealing impacts the rate of Ni leaching, whereas the increase in particle size accompanying annealing leads to an initial decrease in performance. Therefore, it is crucial to find a balance between activity and stability [48,65–68].

(a) Correlation of the structure and catalytic ORR mass activity (MA) evaluated at 0.9 VRHE. (b) Performance stability of PtNi/C as a function of their annealing temperature: MA for the electrochemical ORR after 4k (green) and 8k (brown) potential cycles in the potential range from 0.5–1.0 VRHE (0.05 V s−1). The activated value (purple) is the ORR activity after 25 activation cycles (0.05 – 1.0 VRHE, 0.1 V s−1) in N2. Reprinted with permission from ref. [48], Copyright 2019 Royal Society of Chemistry. (c) Change of ORR MA for the Pt/C, PtNi/C catalysts before and after 4k cycles between 0.6 and 1.1 VRHE. Activity improvement factors vs. Pt/C before and after cycling are also shown. Reprinted with permission from ref. [68], Copyright 2011 American Chemical Society.
Kühl et al. [48] synthesized a carbon-supported PtNi1.5 octahedral cataylst, followed by annealing treatment at temperatures ranging from 200 to 500°C, suggesting that annealing at 400°C results in the most favorable balance between activity and stability. A 4% H2/Ar mixed gas was used, and the temperature was increased at a rate of 10 K min−1 and then held for 0.5 hours. The octahedral shapes remained stable at 200 and 300°C while annealing at 400°C resulted in a transformation from octahedral to cuboctahedral shapes, mainly composed of (111) and (100) facets. At 500°C, the shape of the particles changed from octahedral to spherical. The particle size gradually increased from 8 to 8.5 nm. The initial performance was highest when the catalyst annealed at 300°C, which had a high proportion of (111) facets. In contrast, annealing at 400°C led to decreased activity due to the formation of cuboctahedral with (100) facets. The PtNi at 300°C with a high proportion of (111) facets showed the highest activity, while annealing at 400°C resulted in reduced activity owing to the formation of cuboctahedral with (100) facets. During the stability test for 8k cycles, PtNi that was annealed at 400°C with unchanged cuboctahedral shape showed a 43% decrease in MA, whereas PtNi that was annealed at 200–300°C exhibited an approximately 85% decrease with particles changing to excavated octahedral, hexapod, or rounded shapes. Furthermore, the catalyst annealed at 400°C exhibited the lowest Ni leaching rate.
Similar results have been reported previously [65,67,68]. Beermann et al. [67] reported that the initial PtNi_raw with an MA of 1.66 A mgPt−1 increased to 2.72 A mgPt−1 after annealing at 300°C and decreased to 0.7 A mgPt−1 after annealing at 500°C. They highlighted that PtNi_500 exhibited reduced performance owing to a decrease in the proportion of (111) facets. In durability testing, although the PtNi_500 sample showed an increase in performance at 0.908 A mgPt−1 due to the formation of a Ptrich surface, PtNi_300, with a performance of 1.08 A mgPt−1 after stability testing, showed a better balance between activity and stability.
2.6. Size control
It is important to determine the optimal conditions for PtNi octahedral because their size and composition can influence each other, affecting performance and durability. However, research in this area has not been extensively pursued (Fig. 10). Generally, as the particle size of a catalyst increases, its performance decreases and durability increases [78,79]. However, in the case of octahedral PtNi, the particle size is intricately related to the compositions of Pt and Ni, exhibiting a more complex trend [69]. Moreover, because altering the composition of PtNi without changing its size is challenging, there has been limited research on the relationship between its size and durability [69,80].
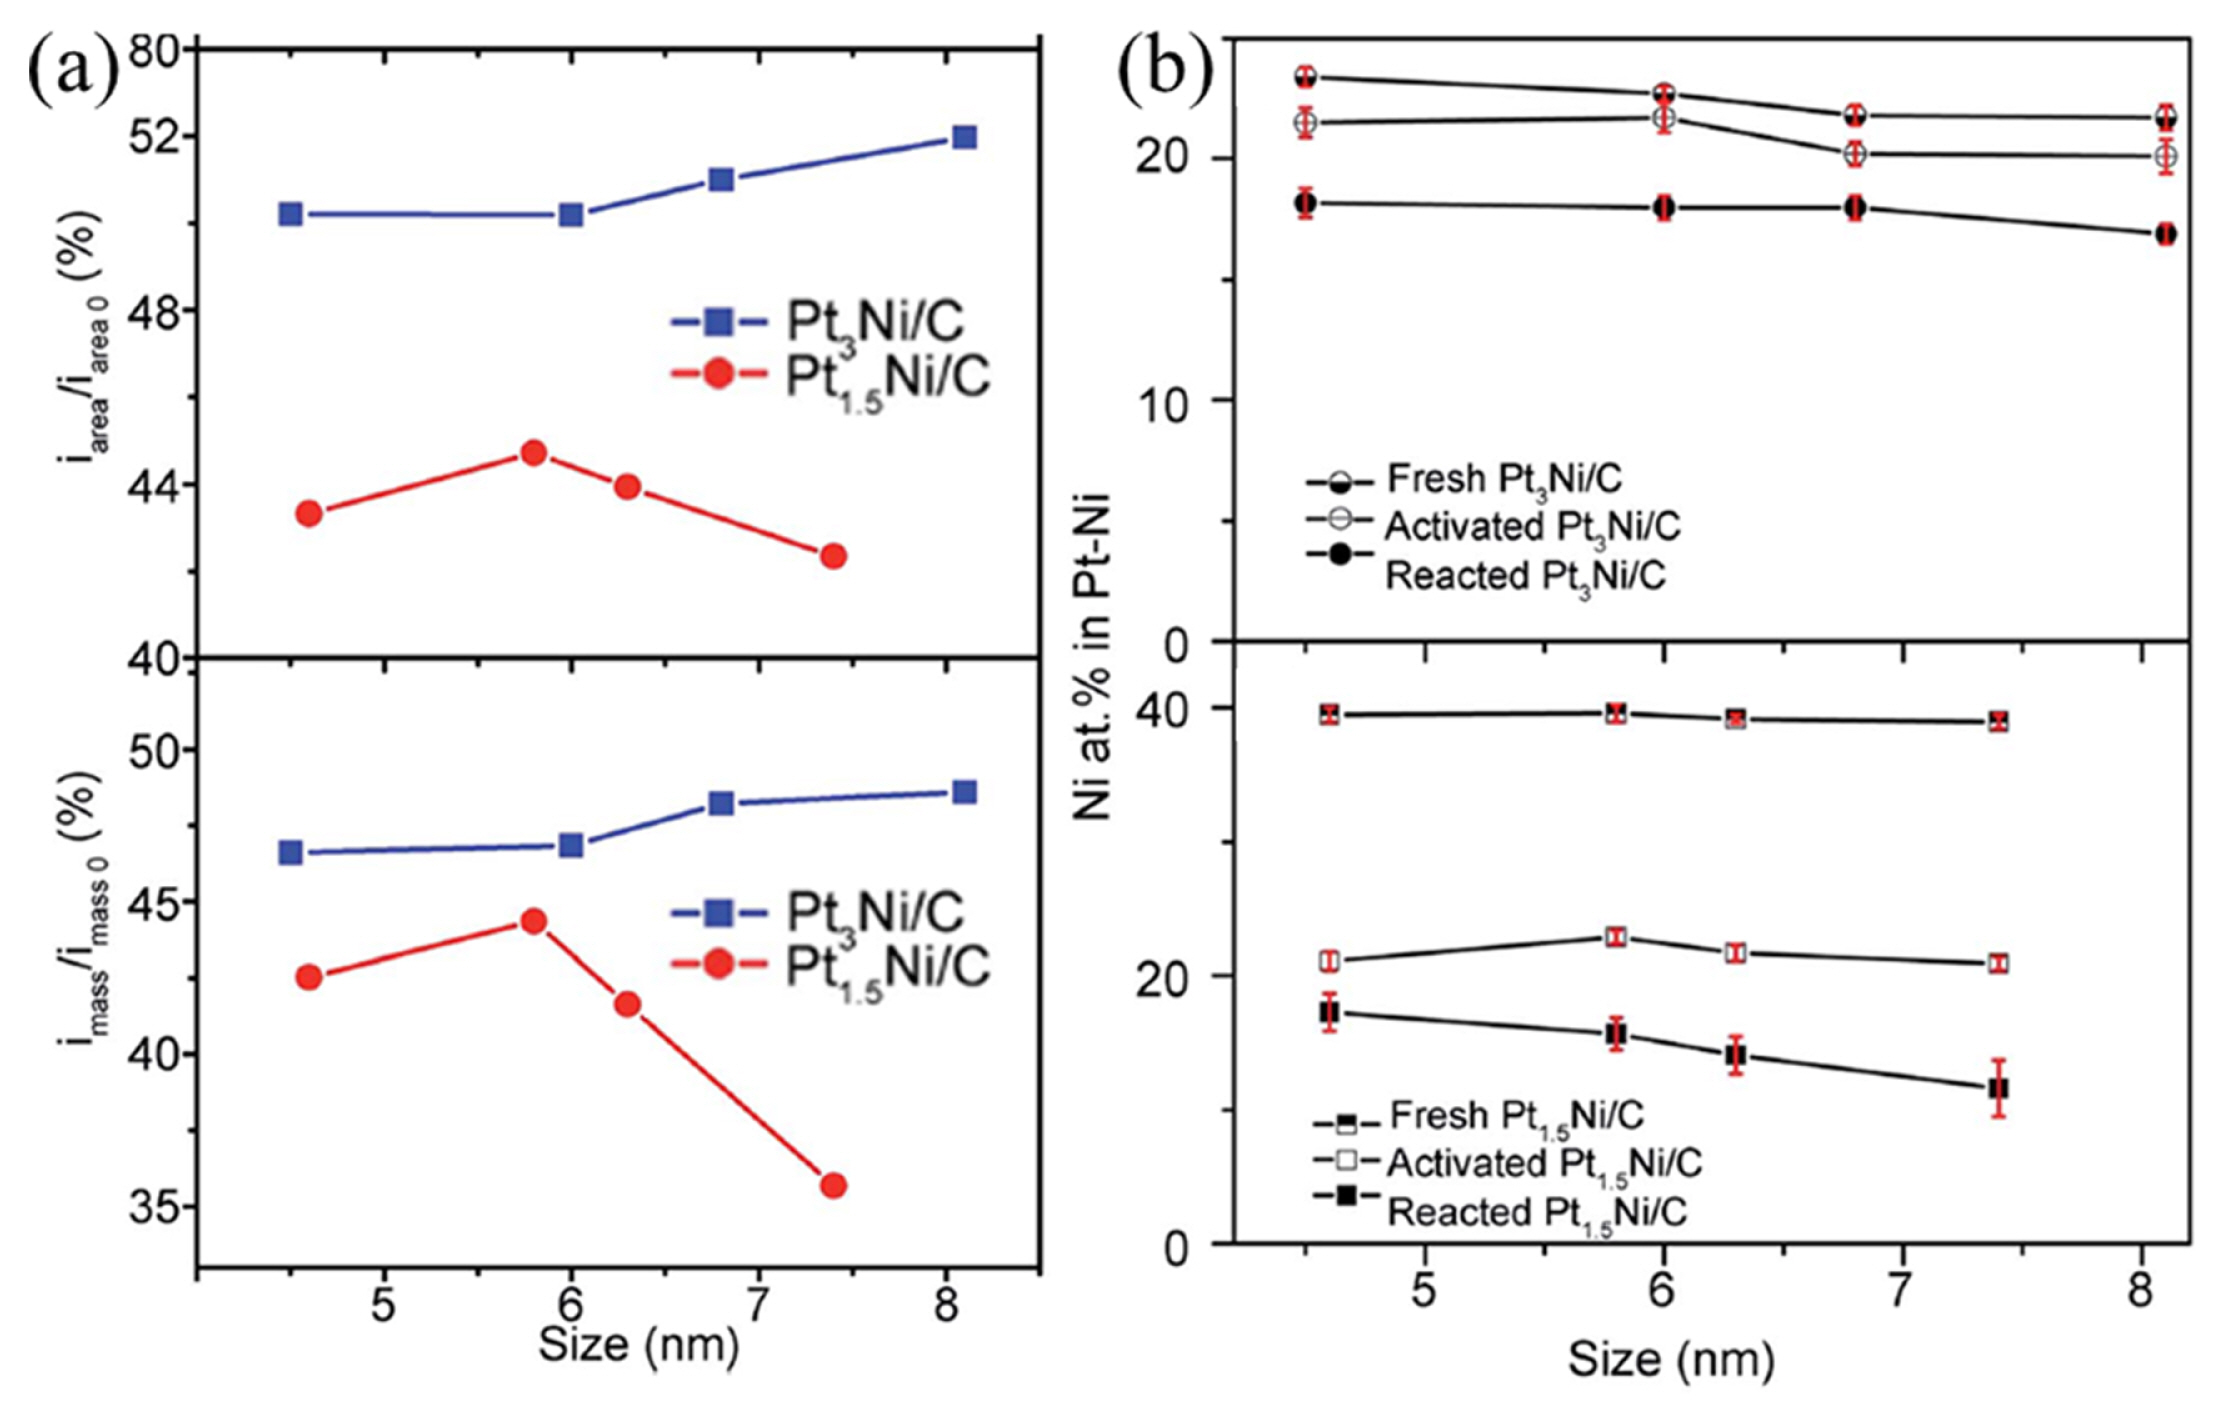
(a) The changes in specific current density (top) and mass activity (bottom) of Pt3Ni/C and Pt1.5Ni/C after the stability test with respect to that for the activated counterparts. The accelerated stability test includes 4k potential cycles between 0.6 and 1.0 VRHE at 0.05 V s−1. (b) Ni content in the fresh and after-stability-test octahedral Pt3Ni/C (top) and Pt1.5Ni/C (bottom). Reprinted with permission from ref. [69], Copyright 2014 Royal Society of Chemistry.
Zhang et al. [69] synthesized Pt3Ni and Pt1.5Ni octahedral with sizes ranging from 4 to 8 nm using the drop-wise solid-state method. The desired amounts of Pt and Ni were reduced on an air-treated carbon support, and adjusting the ramping rate during the subsequent heat treatment resulted in different octahedral particle sizes from 4 to 8 nm. The Pt3Ni octahedral exhibited similar durability regardless of the particle size, with approximately 30% loss of Ni and a 50% decrease in ORR activity during the stability test. The Pt1.5Ni octahedral showed a higher Ni leaching rate and ORR activity degradation with larger particle sizes, whereas an increase in the particle size improved the fraction of (111) terraces, impacting the ORR kinetics positively. Based on the ORR activity and stability, a Pt1.5Ni octahedral catalyst with a size of 5.8 nm was considered the optimal configuration, which was attributed to a combination of a size-dependent Ni leaching process and a higher fraction of (111) terraces.
3. Conclusions
Herein, strategies for improving the stability of PtNi octahedral as promising next-generation electrocatalysts for PEMFCs are reviewed. Various approaches have been explored to overcome the durability issues of PtNi octahedral, such as third-metal doping, composition control, halide treatment, formation of a Pt layer, annealing treatment, and size control, with promising improvements in stability. Among the various stability-enhanced PtNi octahedral catalysts, Mo-doped PtNi octahedral (Mo-PtNi) exhibited a significantly higher factor of 6.6 (4k) and 10.7 (8k), indicating the most pronounced improvement in stability, whereas others showed enhancement factors ranging from 1.2–8.8. It was also accompanied by a significant improvement in activity. Simultaneously, annealing treatment, formation of a Pt layer, and halide treatment also helped to improve stability but were accompanied by a decrease in activity, leaving the challenge of finding the optimum point. Controlling the size and composition significantly influences each other; thus, both aspects of the research should progress together. Notably, Mo-PtNi can be concluded to be the most promising stability-enhanced catalyst; however, further research on 40 wt% Pt loading, simplification of the synthesis method, MEA validation, and scale-up for mass production is still required. We hope that this review will serve as a valuable guide for the development of strategies to enhance the durability of octahedral PtNi.
Acknowledgements
This work was supported by the National Research Foundation of Korea (NRF) grant funded by the Korea government (NRF-2020M1A2A2080806 and NRF-2022M3J1A1085384), and the Korea Institute of Energy Technology Evaluation and Planning (KETEP) grant funded by the Ministry of Trade, Industry & Energy (MOTIE) (No. 20203010030010), and the Korea Institute of Science and Technology (KIST) Institutional Program.