Electrodeposition of Ni–W/Al2O3 Nano-Composites and the Influence of Al2O3 Incorporation on Mechanical and Corrosion Resistance Behaviours
Article information
Abstract
Ni–W/Al2O3 nano-composites were electrodeposited on mild steel substrate for mechanical and corrosion resistance applications. This study focused on the preparation of Ni–W/Al2O3 nano-composite coating with various quantity of Al2O3 incorporations. The addition of Al2O3 in the electrolytes were varied from 1–10 g/L in electrolytes and the Al2O3 incorporation in Ni–W/Al2O3 nano-composite coatings were obtained from 1.82 to 13.86 wt.%. The incorporation of Al2O3 in Ni–W alloy matrix influenced the grain size, surface morphology and structural properties were observed. The distributions of Al2O3 particle in alloy matrix were confirmed using electron microscopy (FESEM and TEM) and EDAX mapping analysis. The crystal structure informations were studied using X-ray diffraction method and it confirms that the deposits having cubic crystal structure. The better corrosion rate (0.87 mpy) and microhardness (965 HV) properties were obtained for the Ni–W/Al2O3 nano-composite coating with 13.86 wt.% of Al2O3 incorporations.
1. Introduction
Nano-composite coatings are widely used for engineering applications because of their excellent surface hardness, wear and corrosion resistance properties [1–2]. The reinforced particles in metal matrix are enhancing the mechanical, electrochemical properties and these coatings are being considered for many applications [3–5]. The preparation of composite coating using electrodeposition method is technologically feasible and it is one of the best method for the preparation of various composites coatings [6,7]. The electrodeposition process is a cost effective and easy equipment method to obtain a variety of composite coatings with various metal matrix and secondary particles (composite elements). The amount of secondary particle reinforcement in metal matrix will be improved by means of varying (i) Surfactant addition [8] (ii) Ultrasonic agitation [9,10] and (iii) Magnetic agitation [11]. Organic surfactant like sodium dodecyl sulphate is added to the electrolyte to improve the distribution of composite particles in metal matrix composites (MMC) deposits [12,13].
In this study, the Ni–W alloy matrix were selected for preparing nano-composite coating because of its excellent mechanical and chemical properties [14,15]. The nickel and refractory metal (Mo, W) based alloy nanostructures are known to exhibit a superior mechanical and chemical properties [16]. Ni–W alloys are useful for high temperature applications [17], lithographic galvanic deposition technique (LGDT) [18], micro-electromechanical systems (MEMS) [19,20], electrocatalyst [21,22], corrosion protection [23–25], hydrogen energy [26–28], wear resistance [25,29–32], biofuel [33] etc. Recently reported that, the Ni–W alloy electroplating is the substitute for environmentally harmful hexavalent hard chromium electroplating process because of their unique properties such as high hardness, wear and corrosion resistance [34]. Moreover, our previous studies shown that Ni–W alloy coatings exhibit very good corrosion resistance and high microhardness properties [35,36]. The secondary particle reinforcement in Ni–W alloy matrix will enhance the mechanical and chemical properties. Based on this, some of the earlier studies discussed about Ni–W alloy matrix with different secondary particle reinforcement such as TiN [37–40], TiO2 [41], ZrO2 [42,43], MoS2 [44], La2O3 [45], CeO2 [46], CNT [47], diamond [48], SiC [49] and Al2O3 [50–53].
In this study, Al2O3 nano-particles were selected as a secondary particle for reinforcing to Ni–W alloy matrix. In common, the ceramic nanoparticle incorporations in metal matrix results the enhancement of wear, hardness and corrosion resistance properties [54,55] of the coatings. The Ni–W/Al2O3 composite coatings are widely useful in various applications like ceramic composite, metallurgy, hydrogenation, automotive emission control, catalysis, electronics, and wear protection. Also, Al2O3 having good chemical stability, higher micro hardness, low price and act as resistance against corrosion [56]. The Al2O3 particles were reinforced in the coatings for increasing the wear resistance and reduce the wear rate [57]. In this work, nano-crystalline Ni–W/Al2O3 composites were deposited on mild steel substrate with various quantity of Al2O3 incorporation using electrodeposition method. The particle size of Al2O3 nanoparticles used in this work is 40–50 nm. The Al2O3 nanoparticles were dispersed in the electrolyte using suitable surfactant like anionic surfactant. Anionic surfactants are surface active agent and helps to achieve uniform dispersing, surface morphology and enhance the electrostatic adsorption [58]. Meguro et al. discussed about the zeta potential relation with particle surface charge and potential difference between the Al2O3 particles dispersed [59]. In this work, the influences of Al2O3 incorporation on deposit grain size, surface morphology and structural properties were studied. The microhardness and corrosion resistance of the composite coatings were accessed for all the deposits.
2. Experimental
Ni–W/Al2O3 nano-composites were deposited on mild steel substrate using direct current method. The electrolytes comprise of 0.06 M Nickel sulphate hexahydrate, 0.1 M Sodium tungstate dihydrate, 0.6 M tri-sodium citrate, 0.5 M of ammonium chloride, 1–10 g/L Al2O3 and 2 g/L Sodium Dodecyl Sulphate as surfactant. The electrodeposition experiments were carried out using the above-mentioned electrolyte at pH 8.5 and the electrolyte temperature maintained at 60°C. Two electrode configurations were used for electrodeposition experiments, nickel bar used as an anode and mild steel (area 2 cm2) sheet used as a cathode. The cathode surface was pre-cleaned with alkaline (3.5 wt.% Na2CO3 and 2.5 wt.% NaOH) electrocleaning process and acid dip (30 V.% H2SO4) and further cleaned with de-ionized water. Before electrodeposition process, the electrolytes were ultra sonicated for 30 min to obtain uniform distribution of Al2O3 particle in electrolyte. The composite coatings were electrodeposited at current density 5 A/dm2 for 30 min. During electrodeposition process, the electrolytes were stirred using magnetic stirrer with 200 rpm (revolution per minute).
The elemental analyses and surface morphology of the deposits were characterized by Energy Dispersive X-ray analysis (EDAX) and Scanning electron microscopy (TESCAN SEM) respectively as per ASTM E 1508 standard. The Al2O3 particles were visualized using Field Emission Scanning Electron Microscopy (FESEM) studies. The EDAX elemental mappings were done for the selected samples for confirming the distribution of composite particles in the alloy matrix. The structural properties of the deposits were studied using X-ray diffraction (XRD) with Cu kα radiation (1.5414 Å). In addition, the surface morphology and alumina particle distribution of the deposits were obtained using transmission electron microscopy (TEM). For TEM studies, the deposited samples were scratched using a diamond tipped cutter. The scratched films were dispersed in to ethanol solvent and subjected to sonication for 20 min. The sonicated solutions were drop casted on a copper grid and dried. Further the drop casted grid is subjected to TEM analysis. As per ASTM E384 standard the Vicker’s microhardness properties were measured at 50 g load using Evarone make microhardness diamond indenter equipment. The corrosion performances of the deposits were studied using Tafel polarization and Electrochemical impedance spectroscopy methods as per ASTM G3–89 (2010) standard and the procedure followed is same as reported in our previous publications [37]. ZSimpwin3.2 software is used for fitting the obtained impedance Nyquist plots with corresponding equivalent circuit.
3. Results and Discussion
3.1 Composition and microhardness studies
The influence of Al2O3 addition in the electrolyte on incorporation of Al2O3 in the composite deposits and its microhardness properties were depicted in Fig. 1. In this study, 1–10 g/L of Al2O3 nano-particles were added in to the electrolyte and observed the incorporation of Al2O3, crystallite size and microhardness properties of the deposits (Table 1). The addition of Al2O3 particles from 1 g/L to 5 g/L in the electrolyte gives steady increment of Al2O3 incorporation in composite deposits. The incorporation of Al2O3 is 1.82 wt.% for the composite deposit obtained from electrolyte with 1 g/L Al2O3 addition and it is increased to 3, 4 and 6 wt.% for the deposits obtained from the electrolyte with addition of 2, 3 and 4 g/L Al2O3 particles. The maximum Al2O3 particle incorporation obtained is 13.86 wt.% for the composite deposit obtained from the electrolyte with addition of 5 g/l Al2O3. The further addition of Al2O3 particle from 6–10 g/L in electrolyte gives less incorporation of Al2O3 in composite deposits. The Al2O3 particle incorporation in composite deposit from the electrolyte with addition of 1–5 g/L Al2O3 particle is obtained as expected, i.e., more Al2O3 particle in the electrolyte enables more incorporation of Al2O3 particle in deposits. The incorporation of Al2O3 particle is decreased for the deposits obtained from the electrolyte with addition of 6–10 g/L Al2O3. This behaviour may be due to the sedimentation of composite particle in electrolyte instead of having proper suspension. In general, if the addition of composite particle higher than the suspension capacity in particular electrolyte will lead to sedimentation behaviours in electrolytic cell and these non-suspended composite particles will not be available for the incorporation during deposition process. The composite particle should be in proper suspension in electrolyte for obtaining composite coatings with more and uniform distribution of composite particles. This study confirms that the 5 g/L Al2O3 addition is the optimum quantity for obtaining good suspension in the electrolyte for obtaining composite deposit with maximum Al2O3 incorporation.

Changes in (a) microhardness, thickness and (b) crystalline size of the Ni–W/Al2O3 composite coatings with different Al2O3 particles additions in the electrolyte.

Materials and mechanical properties of electrodeposited Ni–W/Al2O3 composite coatings
In Fig. 1, Y2 axis shows the microhardness values of the composite coatings deposited using electrolyte with various addition of Al2O3 and the influence of Al2O3 incorporation on microhardness properties. The microhardness values were high for more incorporation of Al2O3 particle in composite deposits. The less microhardness value is observed for the composite deposit with low incorporation of Al2O3 particle. The incorporation of Al2O3 particle and microhardness properties shows linear or direct relationship. The maximum microhardness values obtained is 965 HV for the composite deposit with 13.86 wt.% of Al2O3 incorporation and the minimum microhardness properties obtained is 762 HV for the deposit with 1.82 wt.% of Al2O3 incorporation. The incorporation of more ceramic particle like Al2O3 in alloy matrix will enhance the microhardness properties. In our previous study, the microhardness property reported is 850 HV for Ni–W alloy matrix [37] and in this study, the microhardness properties increased to 965 HV by incorporating Al2O3 particle in Ni–W alloy matrix. The general view of this results (Fig. 1b) shows the oscillation behaviors of the crystallite size with the addition of Al2O3 particle in the electrolyte. The closer observation confirms that the crystallite size is increased for the addition of more Al2O3 particle in the electrolyte. The crystallite size 9.01 nm for the addition of 1 g/L of Al2O3 particle and it is increased up to 11.3 nm for the addition of 10 g/L Al2O3 particle.
3.2 Crystal structure studies
Fig. 2a shows the X-ray diffraction spectrum of Ni–W/Al2O3 nano-composite coatings with various quantity of Al2O3 incorporations. All deposits are having face centred cubic crystal (fcc) structure with predominant (111) plane. The X-ray diffraction studies were done from 20 to 55° axis and found two peaks at 43.8° and 51.1° positions respectively. The peak at 43.8° corresponds to (111) plane and the peak at 51.1° corresponds to (002) plane of Ni–W alloy. A third peak is observed at 25.57° position for the deposit obtained from electrolyte with addition of 5 g/L Al2O3 particles and this peak corresponds to (012) plane of hexagonal Al2O3 (Fig. 2b). We did not observe any peak for Al2O3 in all other composite deposits except the composite deposit obtained from the electrolyte with the addition of 5 g/L Al2O3 particle. The composite deposit with higher Al2O3 incorporation (13.86 wt.%) gives Al2O3 peak with reasonable intensity in X-ray spectrum. All other deposits having less than 8.38 wt.% of Al2O3 incorporations and this quantity of incorporation may not give sufficient x-ray diffraction to obtain a peak with reasonable intensity. This might be the reason for not obtaining Al2O3 peak for the deposit having less Al2O3 incorporation. Also, there is no reasonable change in position and intensity of Ni–W alloy peaks. This indicates that, the Al2O3 particle reinforcement in the Ni–W alloy matrix is not affecting the crystalline structures of alloy matrix.
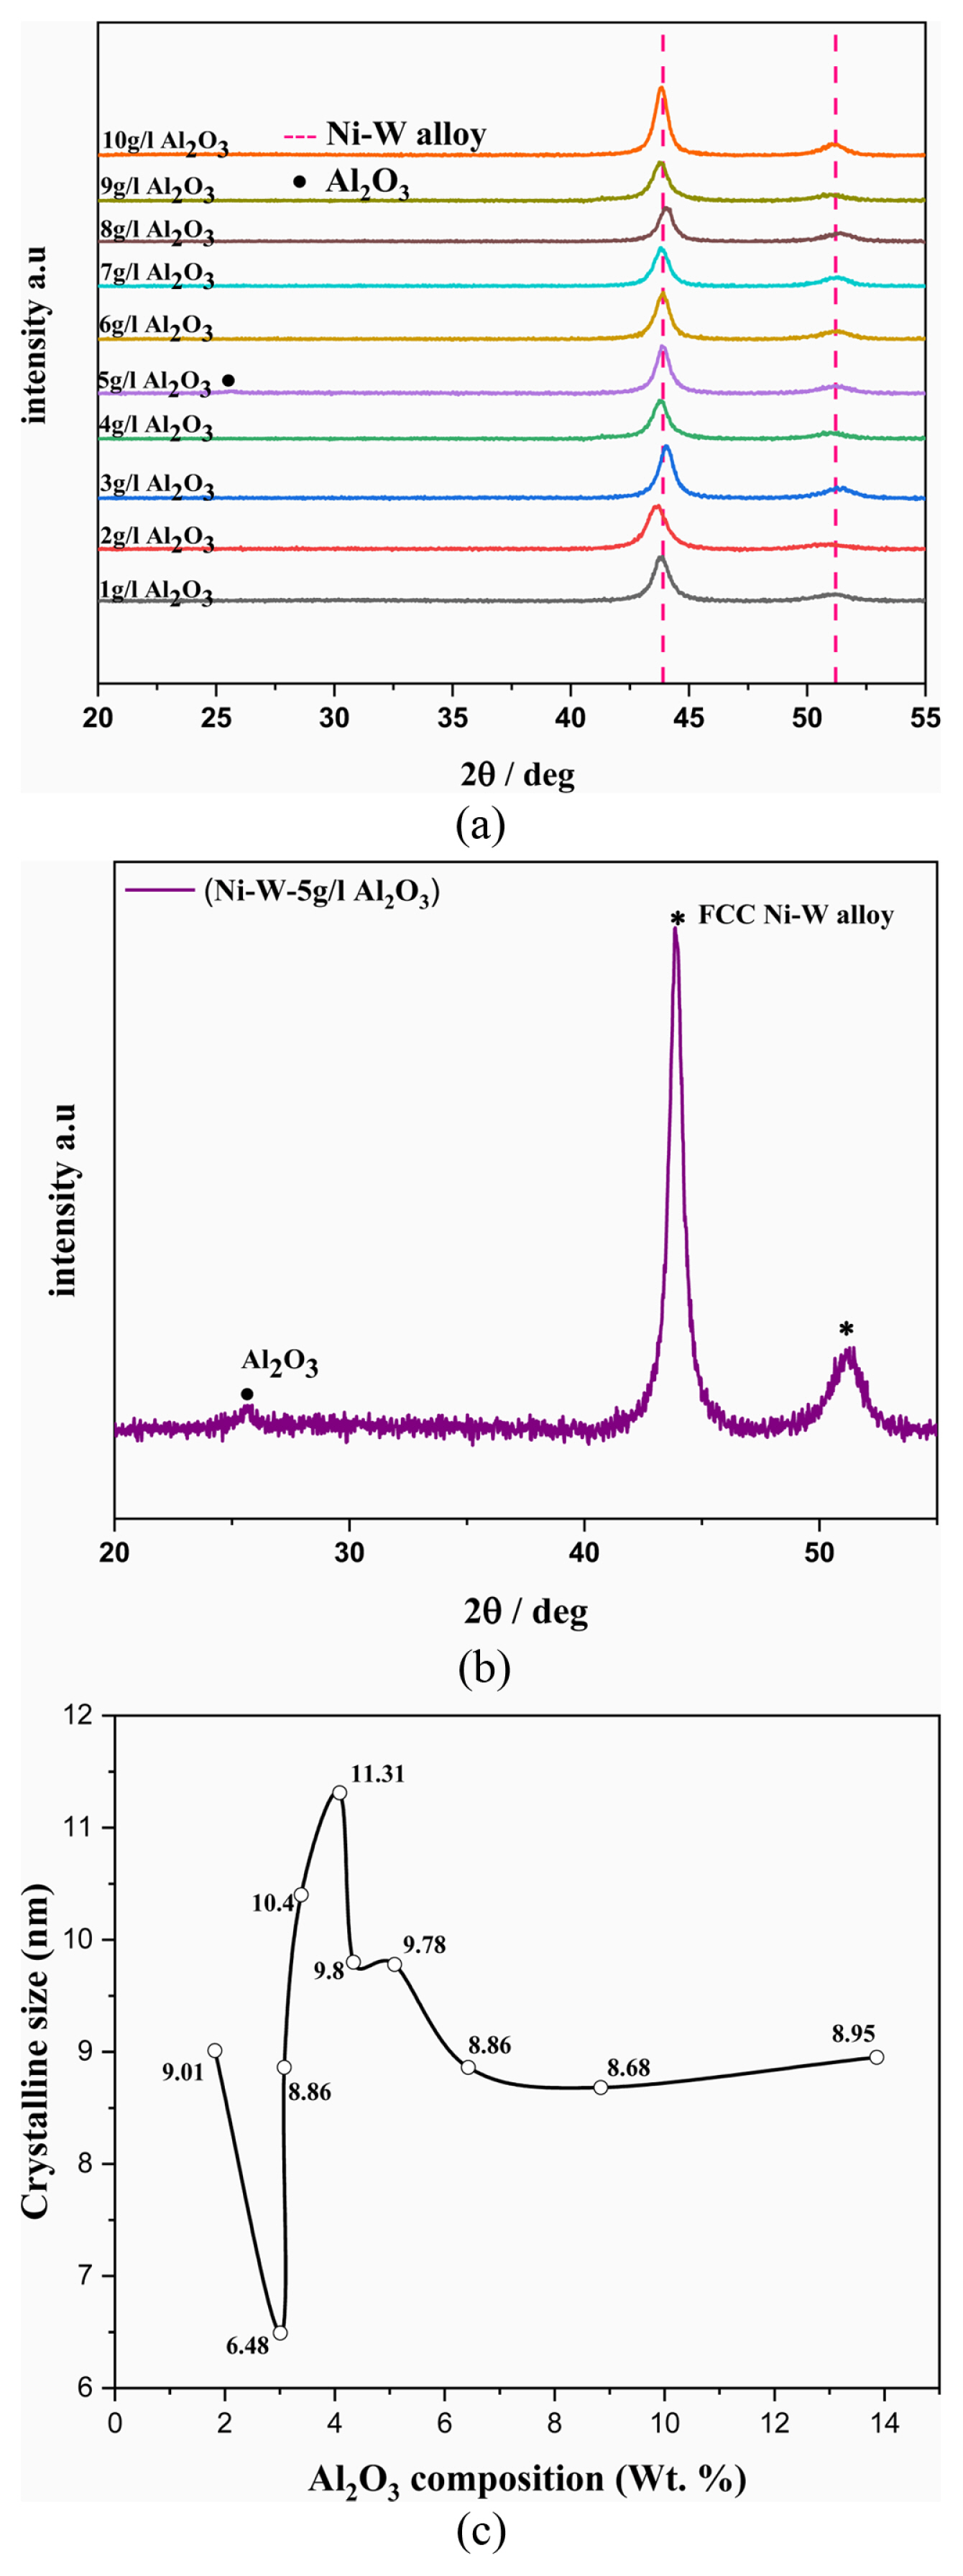
(a) XRD spectrum of Ni–W/Al2O3 nanocomposite deposits obtained from the electrolyte with the addition of 1–10 g/L Al2O3 particles. (b) XRD spectrum of Ni–W/Al2O3 nanocomposite deposits obtained from the electrolyte with the addition of 5 g/L Al2O3 particles. (c) The influence of Al2O3 incorporation on crystallite size of the nano-composite deposits.
The crystallite sizes were calculated for all the deposits using Scherrer’s formula and the results are tabulated in Table 1. This study confirms that, all deposits are nano-crystalline and the crystallite sizes obtained in the range of 6.5 to 11.3 nm. Fig. 2c shows the relation between the Al2O3 incorporation and crystallite size of the deposits. The less incorporation of Al2O3 (up to ~5 wt.%) in alloy matrix gives slight oscillatory behaviour on crystallite sizes and it is varied between 6.5 to 11 nm. The crystallite sizes in the range of 8.5 to 9 nm for the deposit having more than ~6 wt.% of Al2O3 incorporation. The smallest crystallite size obtained is 6.5 nm for the deposit having 3 wt.% of Al2O3 incorporation and the biggest crystallite size obtained is 11.3 nm for the deposit having 4.1 wt.% of Al2O3 incorporation. In most of the deposits, the crystallite size is in the range of 8.6–10 nm.
3.3 Surface microstructure studies
Surface microstructure and composite particle incorporations were studied using electron microscopy such as SEM, FESEM and TEM.
Fig. 3 shows the scanning electron microscopy images of Ni–W/Al2O3 nano-composite coatings with various quantity of Al2O3 incorporation. The surface morphology of the deposits gets modified because of the incorporation of Al2O3 nano-particle in alloy matrix.
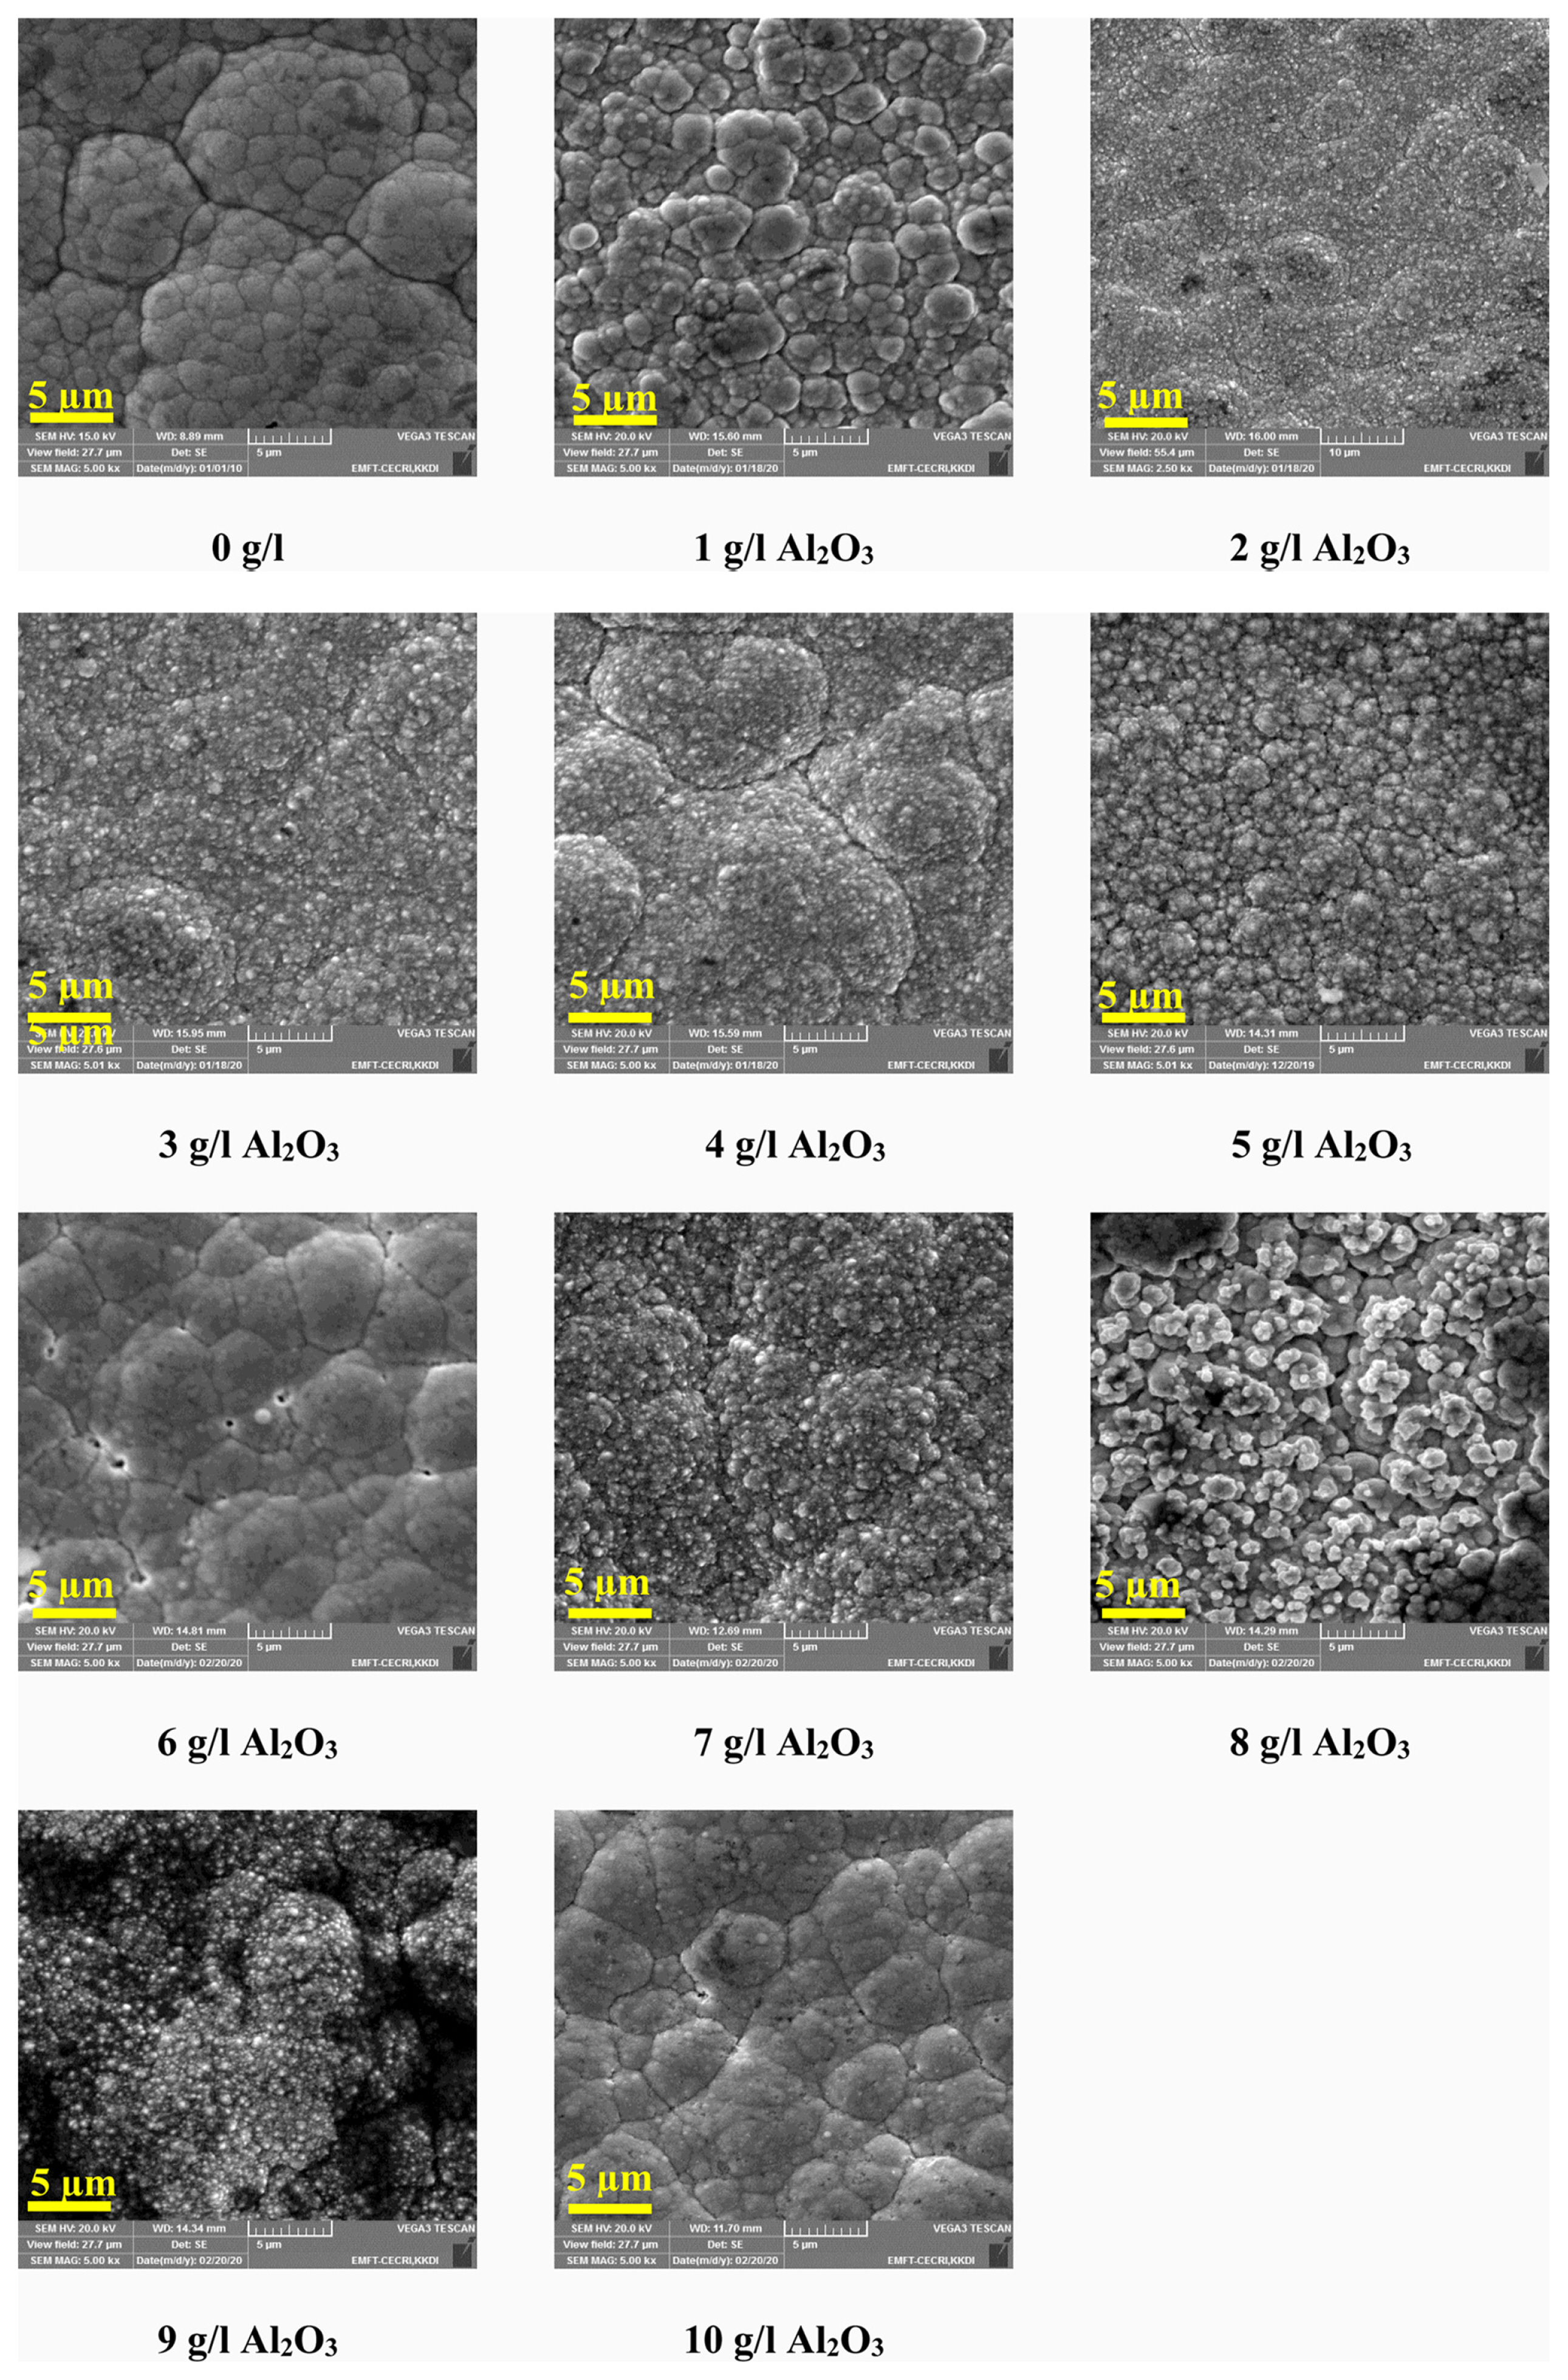
Scanning electron microscopy images of Ni–W alloy and Ni–W/Al2O3 nano-composite deposits obtained from the electrolyte with the addition of 0–10 g/l Al2O3 particles.
The Ni–W alloy deposits having cauliflower like morphology and Ni–W/Al2O3 composite deposits are having different morphologies than Ni–W alloy deposits. In common, we obtained three different morphologies in all composite deposits such as cauliflower, flaky, and agglomerated fine particle surfaces. Each composite deposit obtained from the electrolyte with various addition of Al2O3 particle having different morphologies, i.e., in large agglomerate, fine particles, micro particles, flakes etc. In SEM studies, the Al2O3 particle presence in the composite deposit could not able to visualize due to its nano sizes.
The FESEM studies were explored for visualizing the nano-composite particles presence/distribution in composite deposits. Fig. 4 shows the FESEM images of pure Al2O3 powders, Ni–W alloy deposit and Ni–W/Al2O3 composite deposit with higher alumina incorporation (13.86 wt.%). Fig. 4a confirms the spherical shape of Al2O3 nano-particle and Fig 4b shows the morphology of Ni–W alloy deposits. Fig. 4c shows the morphology of Ni–W/Al2O3 nano-composite deposits and it shows the presence of Al2O3 particle and it is encircled for better visibility. Fig. 4d,e shows the cross sectional FESEM image of Ni–W/Al2O3 composite coatings. It is clearly confirmed that the incorporation of Al2O3 nano-particles in alloy matrix and the observed spherical shaped Al2O3 nanoparticles were encircled for better visibility (Fig. 4d). Fig. 4e confirms that the composites were uniformly coated on the substrate and the coating thickness is 21.7 μm.
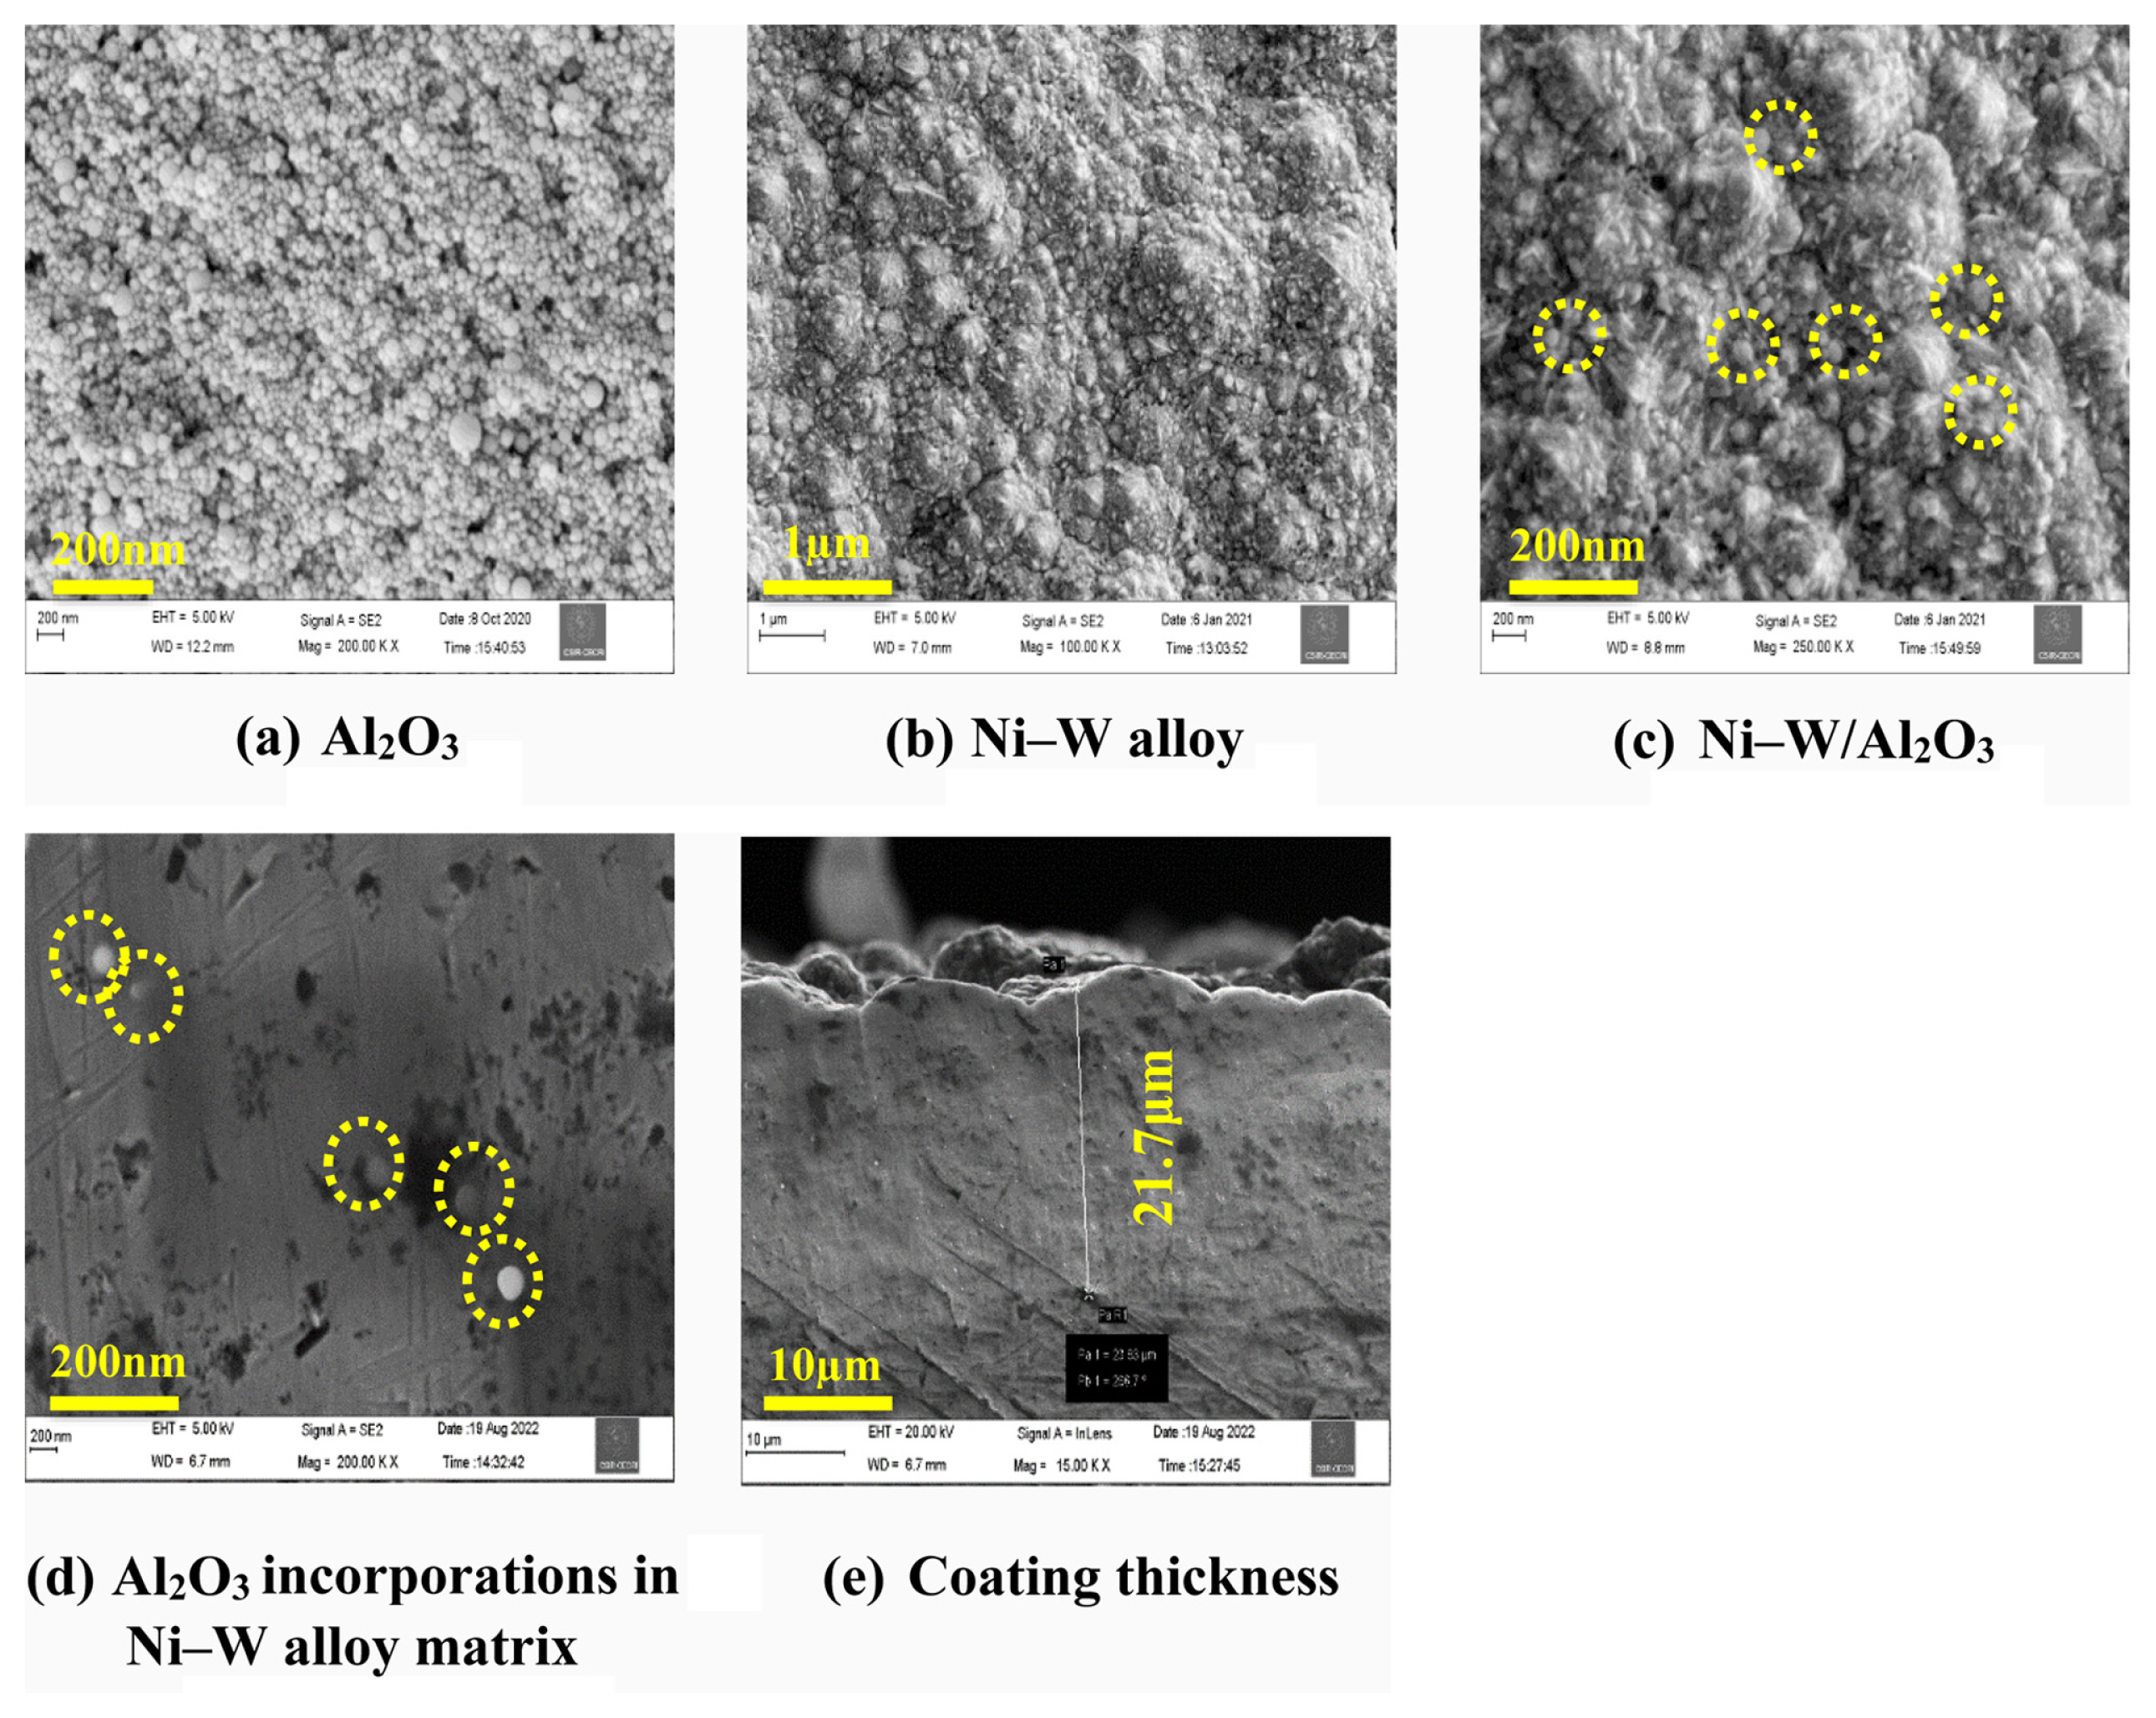
Field emission electron microscopy of (a) Al2O3, (b) Ni–W alloy, and (c) Ni–W/Al2O3. (d) Cross sectional images for Al2O3 nanoparticle incorporation and (e) deposit thickness.
The elemental mapping of Ni–WAl2O3 composite deposit obtained from the electrolyte with the addition of 5 g/L Al2O3 is depicted in Fig. 5. This result confirms that the presence of Ni, W, Al and O elements on the composite deposits. Also, this confirms the uniform distribution of Al and O elements on the composite deposits. This study confirms the presence and uniform distribution of Al2O3 particle on the deposits.
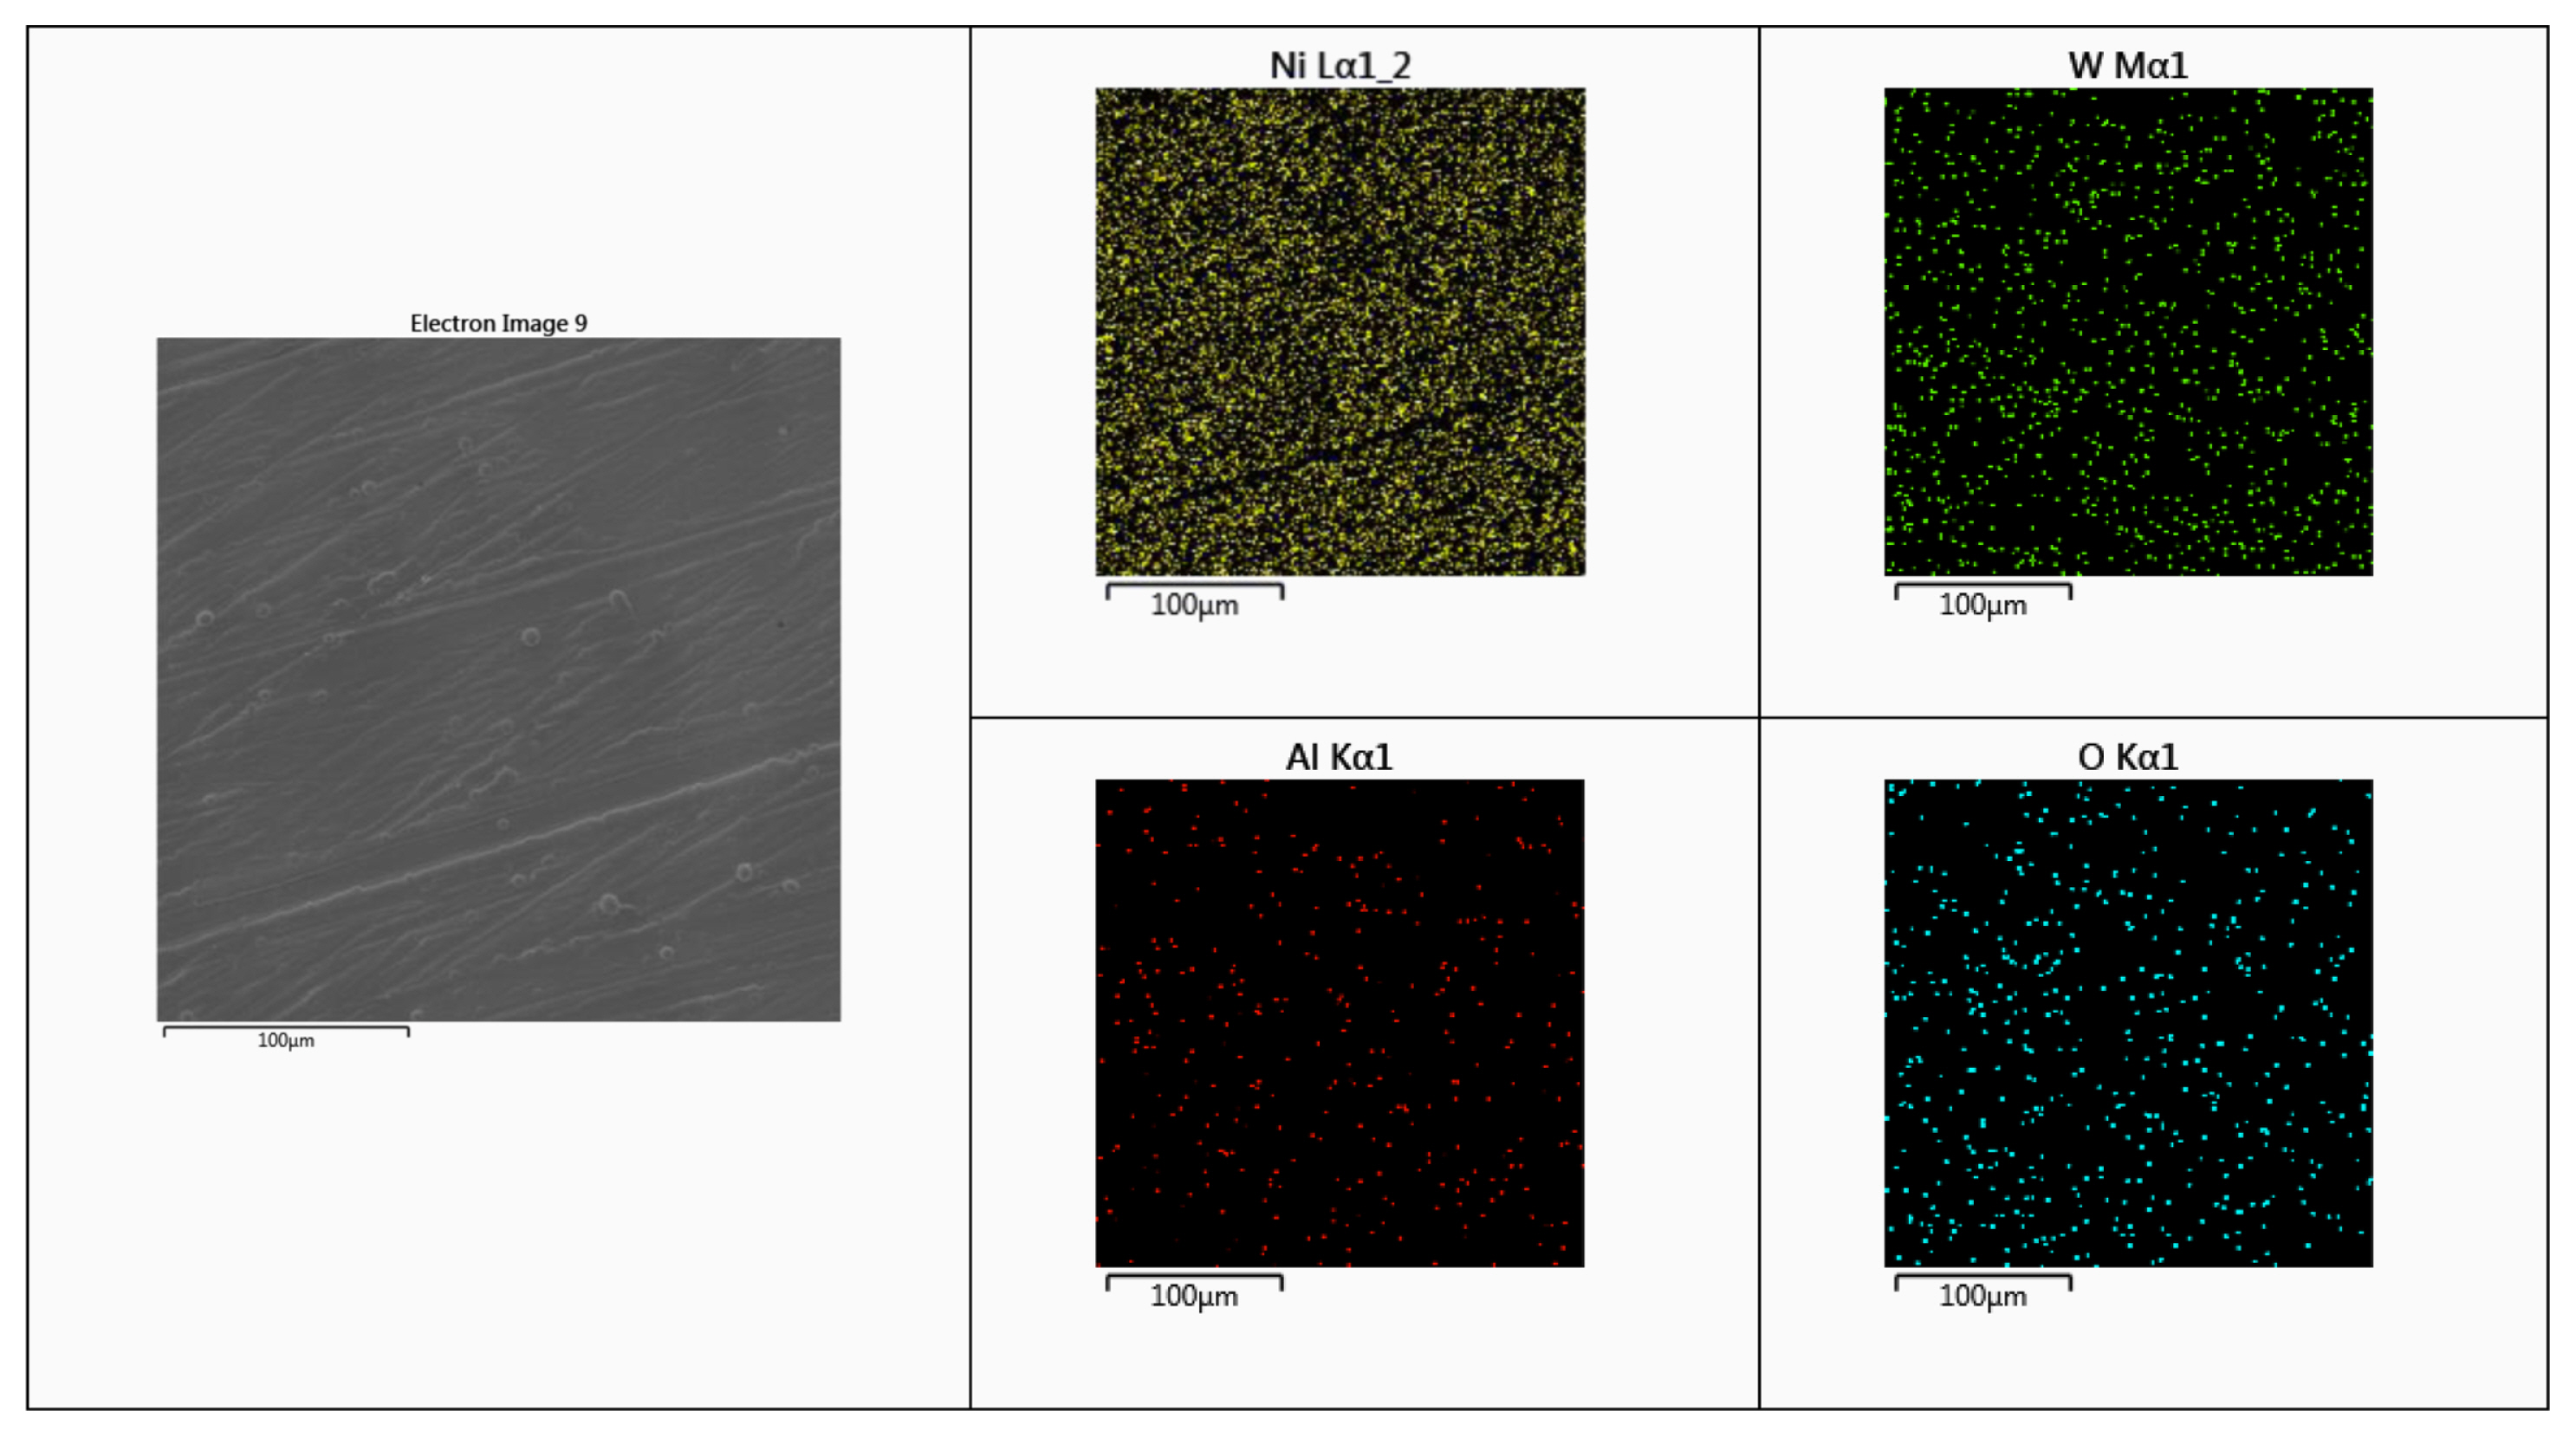
EDAX mapping of Ni–W/Al2O3 composite deposit obtained from the electrolyte with the addition of 5 g/L Al2O3.
Transmission electron microscopy studies were also explored for confirming the composite particle presence/distribution. The TEM images of Ni–W alloy and Ni–W/Al2O3 composite deposits were depicted in Fig. 6. From these images, the Ni–W alloy having needle shape morphology (Fig. 6a) and Ni–W/Al2O3 composite deposits having spherical particle presence along with needle shape morphology (Fig. 6b). This confirms that the spherical Al2O3 particle presence in the composite deposits.
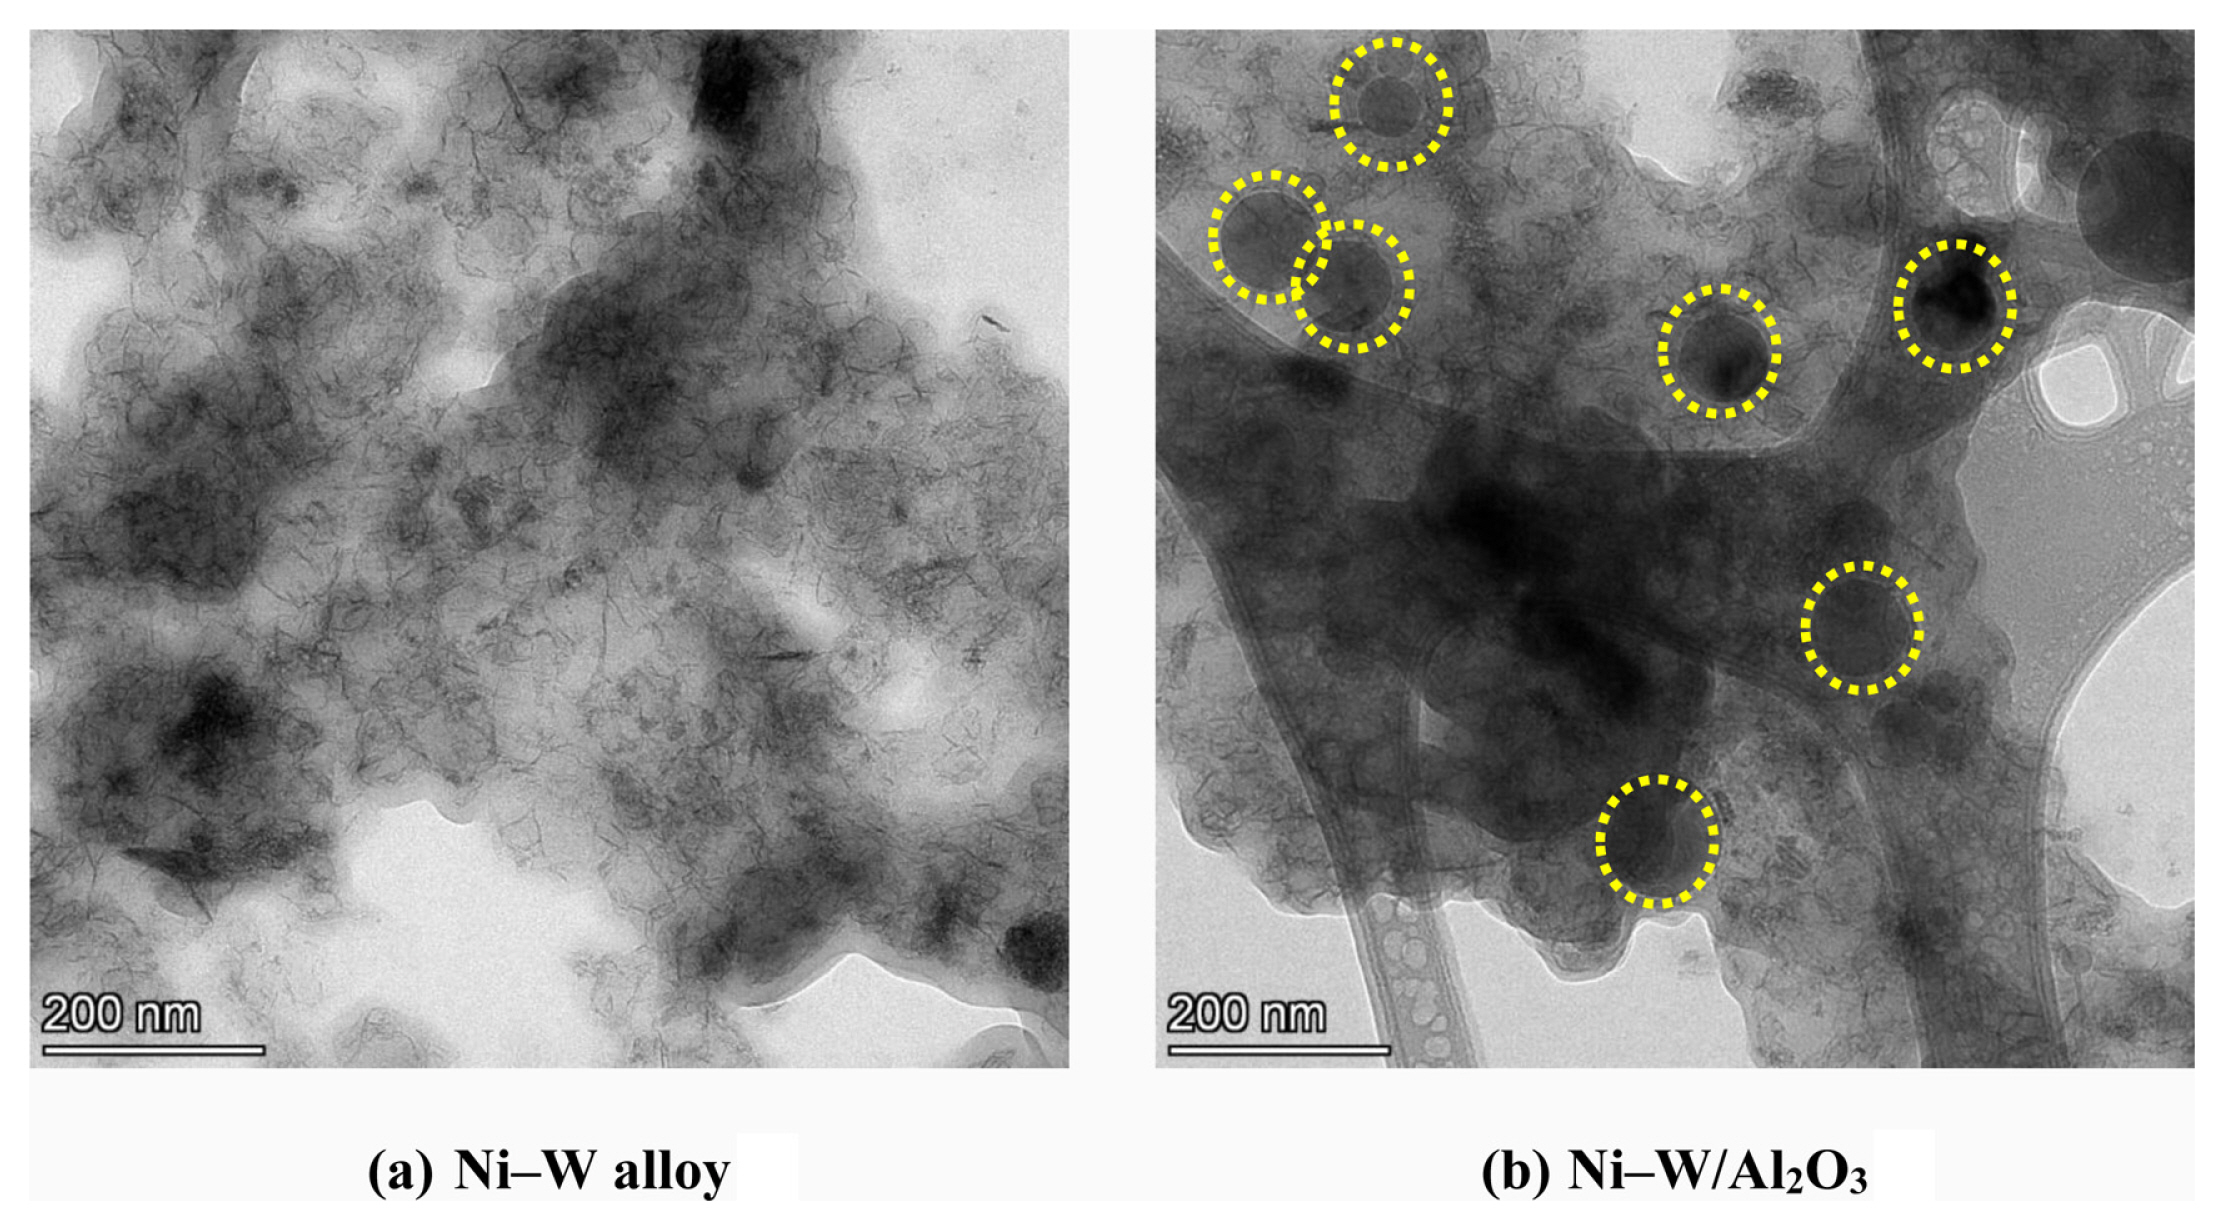
Transmission Electron Microscopy images of Ni–W alloy and Ni–W/Al2O3 (deposited from the electrolyte with the addition of 5 g/l Al2O3) composite deposits.
3.4 Corrosion studies
Corrosion resistance behaviour of composite deposits were studied using tafel polarization (Fig. 7) and electrochemical impedance spectroscopy (Fig. 8).

Tafel polarization curves of electrodeposited Ni–W/Al2O3 composite coatings.
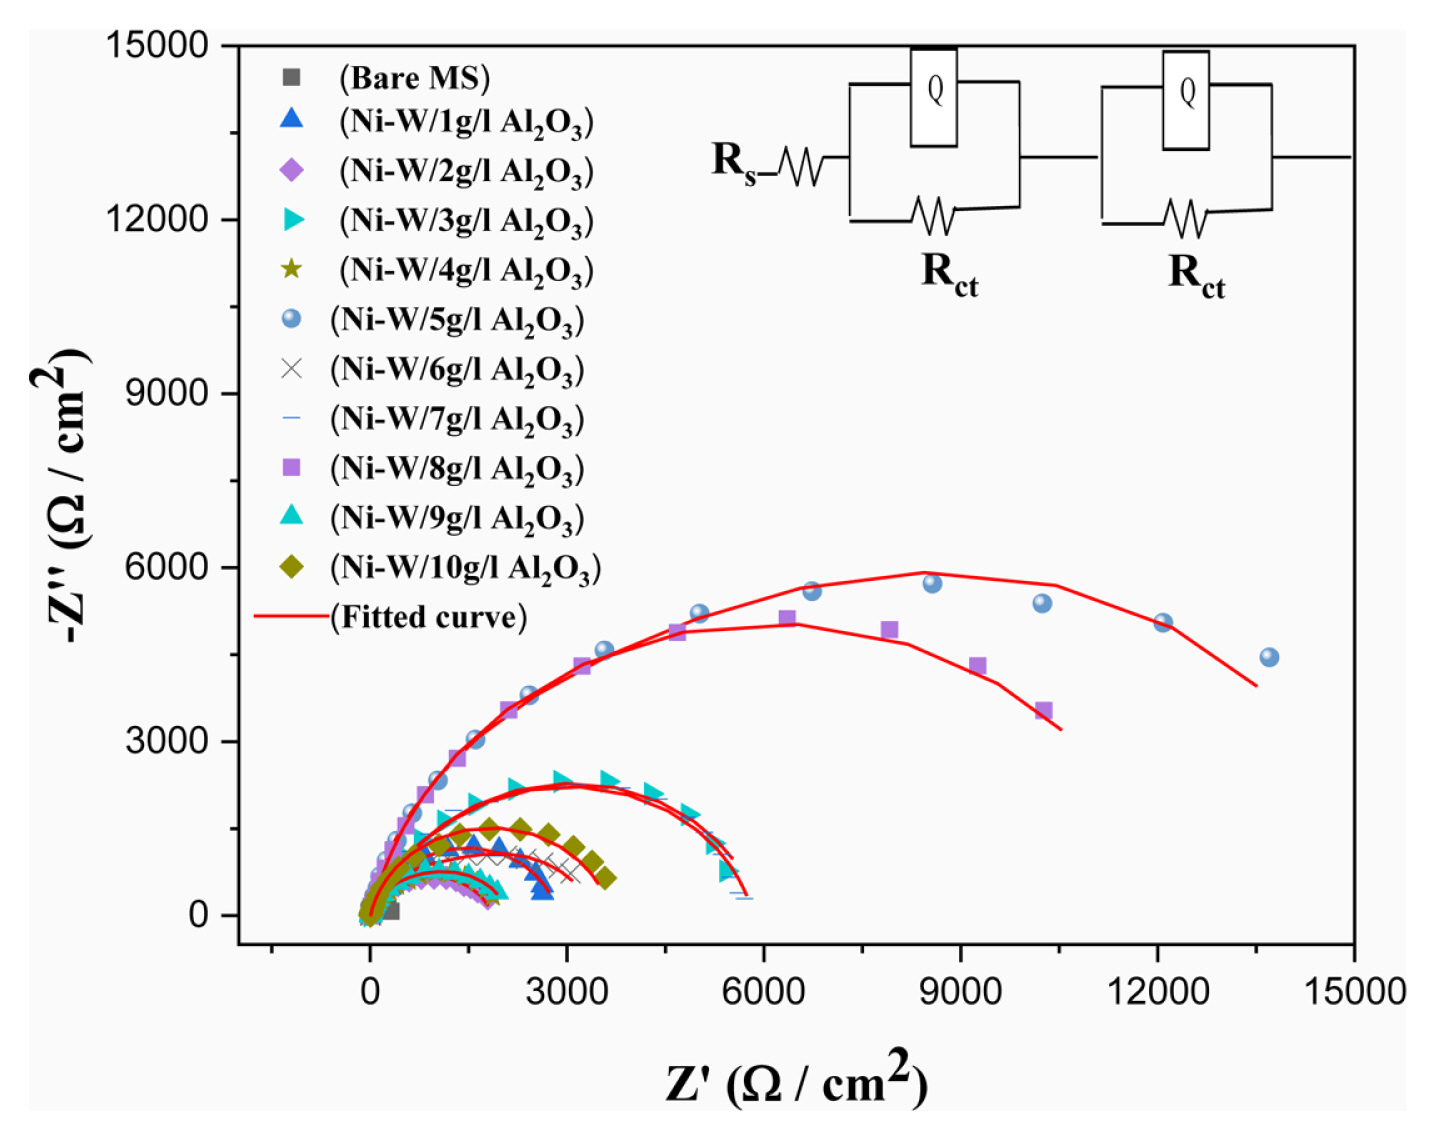
Electrochemical impedance spectroscopy of electrodeposited Ni–W/Al2O3 composite coatings.
3.4.1 Tafel Polarization
Fig. 7 shows the Tafel polarization of Ni–W/Al2O3 composite coatings with various quantity of Al2O3 incorporations. The Tafel polarization of mild steel substrate also measured for understanding the corrosion protection behaviours of composite coatings on mils steel substrate. The Tafel polarization curves of all composite coatings having noble corrosion potential with respect to mild steel substrate. This confirms that the Ni–W/Al2O3 composite coating gives better corrosion protection for mild steel substrate. The efficiency of the corrosion protection varies according to the quantity of Al2O3 incorporation and it is confirmed from corrosion resistance parameters. Among all the Tafel polarization curves, the composite with higher Al2O3 incorporation (13.86 wt.%) curve shows better corrosion potential and low corrosion current density than the other curves. The corrosion parameters obtained from Tafel polarization, viz., corrosion current density (jcorr), corrosion potential (Ecorr) and corrosion rate were given in Table 2.
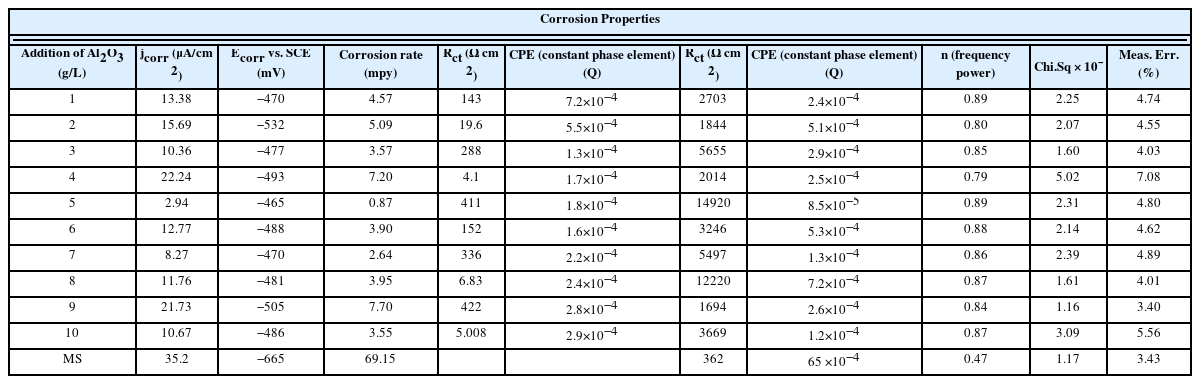
Corrosion resistance properties of electrodeposited Ni–W/Al2O3 nano-composite coatings extracted from Tafel polarization and electrochemical impedance spectroscopy studies
The mild steel substrate corrosion potential, corrosion current density and corrosion rate is −665 mV vs. SCE, 35.2 μA/cm2, and 69.15 mils per year (mpy). The Ni–W/Al2O3 composite deposits are having superior tafel parameters than the mild steel substrate, i.e., low corrosion current density, noble corrosion potential and low corrosion rate which confirms the composite coatings provides superior corrosion protection for mild steel substrate. Among all the composite coatings, lowest corrosion current density (2.94 μA/cm2) and more noble corrosion potential (−465 mV vs. SCE) was observed for the composite deposits having high incorporation of Al2O3 (13.86 wt.%). The corrosion rate also obtained less (0.87 mpy) for the composite having high incorporation of Al2O3. The Ni–W/Al2O3 composite with 13.86 wt.% (high alumina content) deposits provides superior corrosion protection for mild steel substrate.
3.4.2 Electrochemical impedance spectroscopy
Electrochemical impedance spectroscopy of Ni–W/Al2O3 composite deposits with various quantity of Al2O3 incorporation is shown in Fig. 8. The electrochemical impedance spectroscopy of mild steel substrate also measured for understanding the corrosion protection behaviour of composite coatings. The experimental curves were fitted (red line) with R(QR)(QR) circuit model. The equivalent circuit fittings were validated by chi square value and measurement errors with experimental results (Table 2).
The circuit model used for this fitting is the combination of one solution resistance (Rs), two constant phase element (CPE) and two charge transfer resistance (Rct). In this, CPE and Rct are parallel and this has been utilized to simulate the metal/solution interface. The impedance data, viz., charge transfer resistance (Rct) and constant phase element (CPE) values were derived from equivalent circuit fitting (Nyquist plot) for all spectra and tabulated (Table 2). The goodness of this fitting processes was confirmed from Chi. Sq. value which also given in Table 2 and it confirms all fitting are having the well accepted value in the order of 10−3. The equivalent circuit is having two time constant i.e one may be belongs to alumina particle embedded in the surface or surface passive layer and other one belongs to bulk composite deposits.
The corrosion resistance parameters were considered majorly from bulk composite deposit performances. The frequency power (n) value varies from 0 to 1 and if it is 0, the CPE is a resistor and if the value is 1, CPE is a capacitor respectively. The mild steel substrate Rct value of is 362 Ω cm2 and it is high for Ni–W/Al2O3 composite coatings, i.e., 14920 Ω cm2. This confirms the composite coatings gives better corrosion protection for mild steel substrate. The highest Rct value observed is 14920 Ω cm2 for the composite deposits with high Al2O3 content (13.86 wt.%) compared with earlier report of 5305 Ω cm2 at 20 g/l Al2O3 addition in electrolyte [56].
4. Conclusions
Ni–W/Al2O3 nano-composite coatings were electrodeposited on the mild steel substrate and its composition, crystal structure, microstructure, microhardness, and corrosion resistance properties were studied. The Al2O3 addition in electrolytes were varied from 1–10 g/L and the maximum Al2O3 incorporation obtained in nano-composite deposit is 13.86 wt.% for the composite deposit obtained from the electrolyte with the addition of 5 g/l Al2O3. The microhardness properties increased from 850 HV to 965 HV by incorporating 13.86 wt.% of Al2O3 particle in Ni–W alloy matrix. The deposits are having face centred cubic crystal structure with predominant (111) plane and Al2O3 particle incorporation in Ni–W alloy matrix is not affecting the crystalline structures of alloy matrix. The composite deposits are nano-crystalline and the crystallite sizes obtained in the range from 6.5 to 16.6 nm. The surface morphology of the deposit gets modified due to the incorporation of Al2O3 nanoparticle in alloy matrix. The electron microscopy studies confirm the spherical shape Al2O3 particle presence in the nano-composite deposits. The EDAX mapping also confirms the presence of Ni, W, Al and O in the Ni–W/Al2O3 nano-composites. The corrosion studies confirm that the nanocomposite coating provides better corrosion protection for mild steel substrate. Among all composite deposits, the composite coatings with high Al2O3 incorporation (13.86 wt.%) shows superior corrosion resistance properties. The lowest corrosion current density (2.94 μA/cm2), more noble corrosion potential (–465 mV vs. SCE), highest Rct value (14920 Ω cm2), better corrosion rate (0.87 mpy) was observed for the composite having high Al2O3 incorporation (13.86 wt.%).
Notes
Conflict of Interest
The authors declare that they have no conflict of interest.
Ethical Submission Statement
Herewith I have been declaring that, this manuscript consists of original, unpublished work which is not under consideration for publication elsewhere. Also, all co-authors have approved the content of this manuscript and submissions.
CSIR-CECRI Manuscript Communication Number: CECRI/PESVC/Pubs/2022-009