Numerical Analysis of the Effect of a Three-Dimensional Baffle Structure with Variable Cross-Section on the Parallel Flow Field Performance of PEMFC
Article information
Abstract
In this study, a 3D model of the proton exchange membrane fuel cell is established, and a new 3D baffle structure is designed, which is combined with the parallel flow field and then optimized by numerical simulation methods. The number of baffles and the cross-sectional trapezoidal base angle are taken as the main variables, and their impacts on the performance indexes of the cathode side are analyzed. The results show that the 3D baffle can facilitate the convection and diffusion mass transfer of reactants, improve the uniformity of oxygen distribution, enhance the drainage capacity, and make the cell performance superior; however, too small angle will lead to excessive local convective mass flux, resulting in the decrease of the overall uniformity of oxygen distribution and lowering the cell performance. Among them, the optimal number of baffles and angle are 9 and 58°, respectively, which improves the net output power density by 10.8% than conventional flow field.
1. Introduction
The proton exchange membrane fuel cell (PEMFC) is one of the devices for new energy power due to its high energy density, zero contamination, and low operating temperature, which is of great value to achieve energy transition [1–4]. The PEMFC is mainly composed of bipolar plates (BPs), flow channels, gas diffusion layers (GDLs), catalytic layers (CLs), and proton exchange membranes, and BPs are the important constituent parts, which are loaded with a flow field (FF) structure to transport the reactants uniformly to the electrodes and are responsible for facilitating the removal of water, and should also have good heat dissipation properties [5–7]. Optimization of the geometrical parameters of the classical flow field parallel, serpentine, cross-finger, and direct flow channels are common lines of research, among which parallel flow channels are widely used due to their low fabrication difficulty and low processing cost [8–10].
Many researchers have improved the performance of PEMFC by putting baffles in the channel. Heidary et al. [11,12] reported the influence of different blockage ratios of baffles in a single channel on the mass transfer effect using numerical simulations, and it showed that the best effect was achieved when the blockage ratio reached 100%, and the net output power was increased by 30%; then, they investigated the effect of baffle arrangement (staggered and inline) on the enhancement effect of the parallel flow field (PFF) and discovered that the staggered configuration could improve the peak power density by 28%. Yin et al. [13] studied the effect of the baffles number and blockage ratio in a single channel and found that the mass transfer effect would be reduced by excessive blockage of the channel, and the optimal blockage ratio and number were 0.8 and 5, respectively, which could improve the PEMFC performance by 12.12%. Wang et al. [14] found that the layout of baffles in the triple serpentine FF has a significant effect on the PEMFC, and the global arrangement can improve the current density and the arrangement at the rear can improve the gas distribution uniformity.
The improvement of PEMFC performance and the enhancement of the mass transfer effect by baffle is significant, but the increase of flow resistance leads to greater pressure loss. To solve these problems, Chen et al. [15] created a 3D wave channel with wave-shaped baffle that is more mobile than rectangular baffle. The best overall cell performance was achieved when the baffle depth was 0.45 mm and the wavelength was 2 mm, which reduced the liquid water saturation and facilitated oxygen transfer. Yan et al. [16] designed a new centrosymmetric four-serpentine flow field and combined it with a wave channel, which retained the advantages of a serpentine flow channel with high water removal capacity and introduced convective mass transfer to reduce the pressure drop, with the best performance when A = 0.3 mm and λ = 2 mm. Chen et al. [17] improved the rectangular baffle by changing the angle of the rectangle to guide the gas flow and setting the baffle to a porous structure as a way to enhance the flow. It showed that the enhancement of mass transfer was more pronounced with low porosity baffles, and the change in baffle volume caused by the angle dominated the mass transfer process rather than the change in the flow direction. Dong et al. [18] designed a double baffle structure and investigated the impact of operating parameters after optimizing the number of baffles. It showed that the fuel cell performance was more prominent at low stoichiometric ratios and high relative humidity. Yin et al. [19] investigated the effect of trapezoidal front and rear inclination angles on mass transfer based on trapezoidal baffles and showed that the best mass transfer effect was achieved when the front and rear inclination angles were 45° and reduced the airflow disturbance due to the baffles, which improved the performance by 10.7% compared to the conventional channel. Guo et al. [20] designed a streamlined baffle structure with dimensional optimization of the windward area and backwind length as key variables and found that streamlined baffles could reduce the flow resistance to reduce vortices, thus increasing the net power.
In summary, incorporating baffles in the FF is an effective measure of improving the cell performance, while the study of baffle geometry in most of the above studies is limited to the variation in the flow channel length direction and less in the width direction. Therefore, in this paper, a new 3D baffle structure is designed and combined with PFF, because the pressure drop in the PFF is lower compared to other flow fields [21,22]. Firstly, it studied the influence of the number of 3D baffles, and after determining the optimal solution, the influence of the baffle cross-section height on the performance of PEMFC is further analyzed.
2. Model development
2.1 Geometric model
Since the current density of PEMFC is limited by the mass transfer rate of reactants to porous electrodes, the mass transfer effect can be enhanced by designing a reason able flow channel structure [19]. In this study, a new 3D baffle structure was designed and combined with the PFF, which is different from conventional structures such as rectangular, trapezoidal, and triangular baffles: the baffle structure not only strengthens convective mass transfer in the vertical direction but also the left and right-side structures provide velocity components toward the GDL direction, as shown in Fig. 1 for the 3D schematic diagram of the flow field geometry model. As shown in Fig. 1, the top edge of the rectangular channel section is the bottom edge and the midpoint of the bottom edge is the vertex to form an isosceles triangle, and the end height of the baffle is variable, and the edge length is intercepted by the isosceles triangle, which changes with the increase or decrease of the end height. In this paper, the impact of the 3D baffle on the mass transfer performance of PEMFC is investigated step by step based on the number of baffles (BN) and cross-sectional trapezoidal base angle (θ). The geometric parameters of the flow field are shown in Table 1.
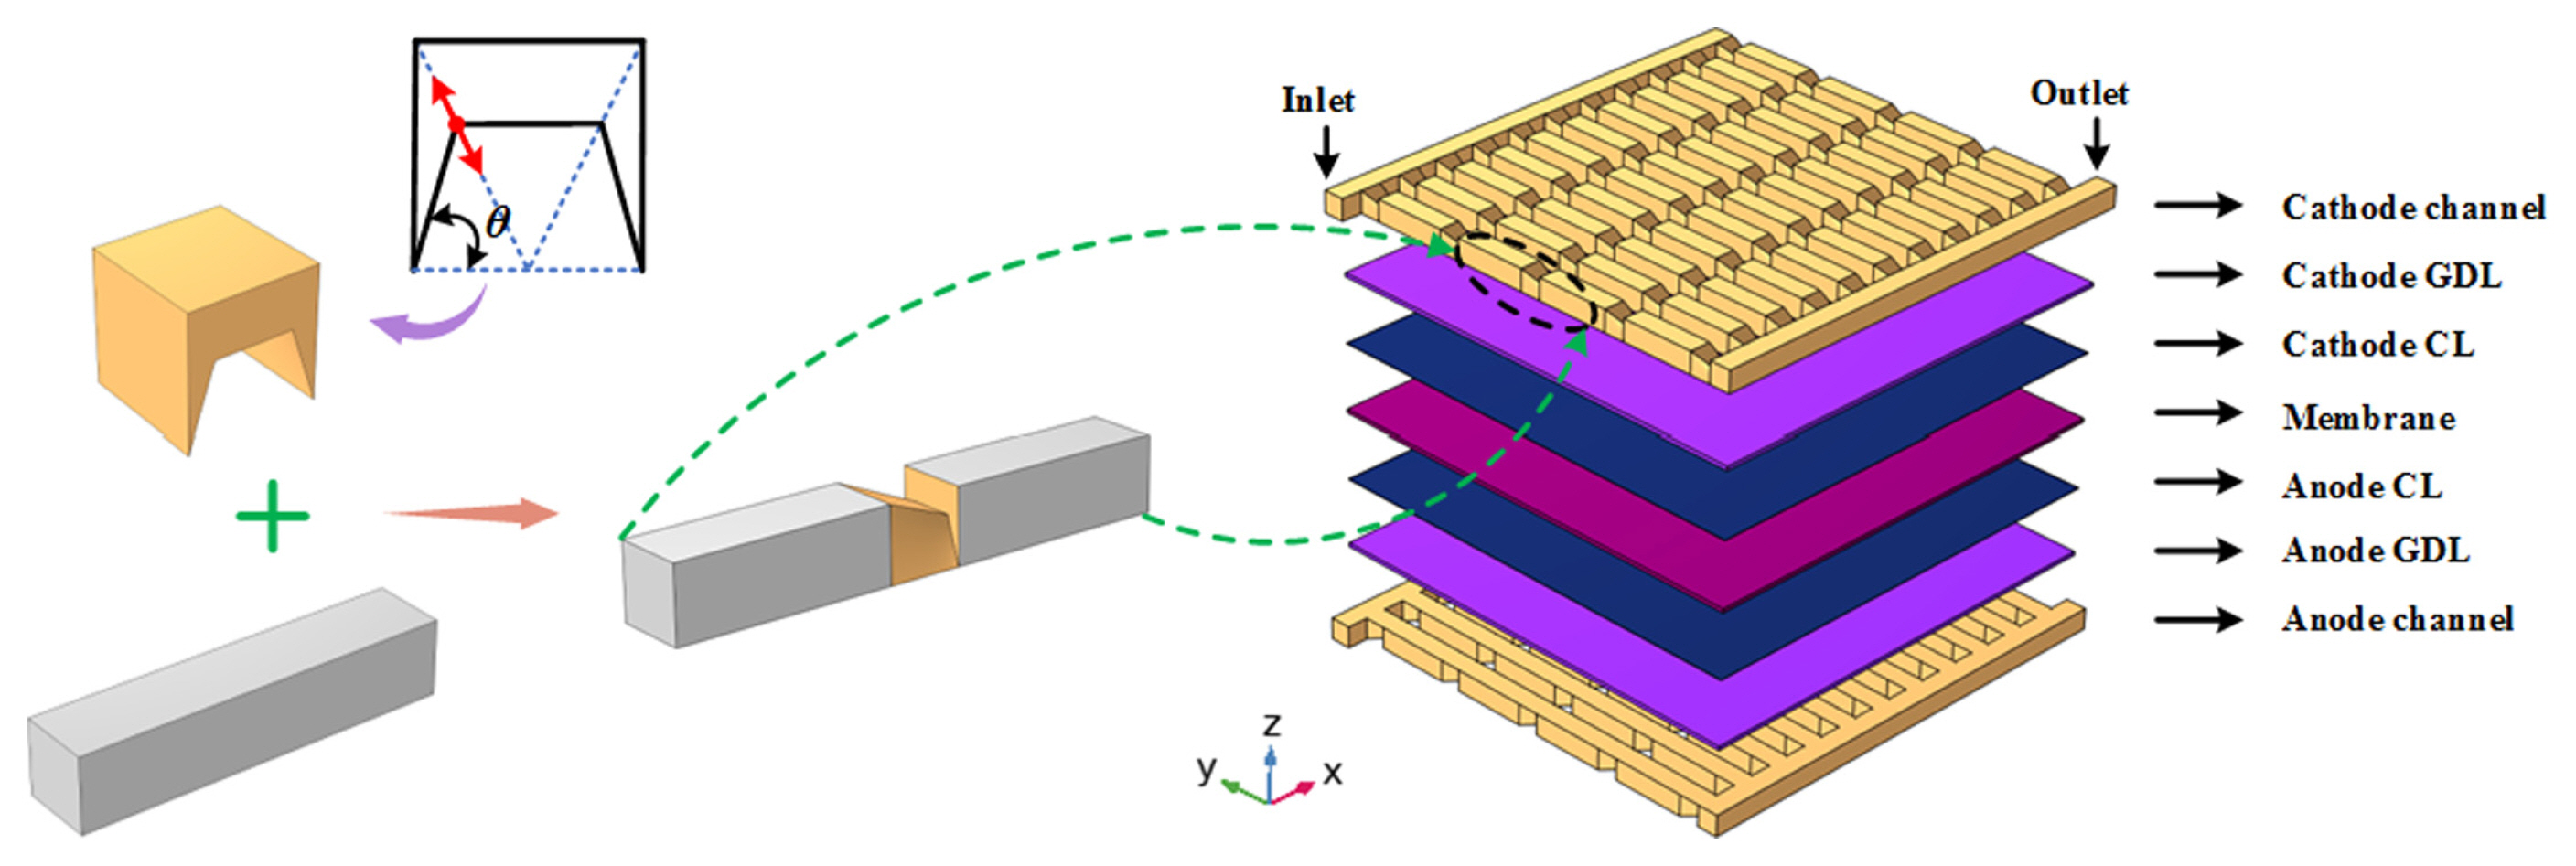
Geometric model.

Model parameters
2.2 Model assumptions
The PEMFC system has a complex structure, which contains electrochemical reactions, charge transfer, matter transfer, and fluid flow. In this study, the operating temperature of the cell is set to 80°C and the reaction products are in the form of gases. And the following assumptions were made for the model [23,24]:
The effect of gravity is ignored.
The cell maintains steady-state operation.
The reaction gas is ideal, and the laminar flow is maintained in the cell.
The gas diffusion layer and catalytic layer are isotropic.
2.3 Control equations
The conservation of mass equation is [25]:
where ɛ denotes the porosity, ρ is the gas density, and u⃗ is the velocity vector.
The conservation of momentum equation is [25]:
where ρ is the fluid density; u⃗ is the fluid velocity vector, and Su is the mass source term.
The conservation of energy equation is [25]:
where T is the temperature, Cp is the effective thermal conductivity, and Sh is the energy source term.
The material transfer equation is [25]:
Where, ci is the volume fraction of the substance;
The charge conservation equation is [26]:
where σsol and σmen are the conductivities of the solid phase and membrane terms, respectively, φsol and σmem are the potentials of the solid phase and membrane terms, respectively; Rsol and Rmen are the current supplies of the solid phase and membrane terms, respectively.
The electrode kinetic equation is [26]:
where ξa and ξc are the active specific surface areas of the anode and cathode CL, respectively;

2.4 Boundary conditions
The boundaries are set to be flux-free, except for the inlet and outlet, and there is no back pressure at the outlet. The cathode inlet velocity was calculated using Equation (9) and Equation (10), respectively [29].
where Am is the active area, Ach is the cross-sectional area of the flow channel, ζ is the stoichiometric ratio,ω is the mass fraction, and iref is the reference current density.
2.5 Numerical methods
In this paper, a hexahedral mesh is used for all models of the proton exchange membrane and CLs, with maximum cells of 0.27 mm, 0.27 mm, 0.28 mm 0.30 mm, and 0.35 mm, respectively, all with 5 layers in the thickness direction. The tetrahedral mesh was applied to the flow channel and GDLs parts with maximum cells of 0.27 mm, 0.28 mm, 0.30 mm, 0.35 mm, and 0.39 mm, respectively. Five (223185, 323419, 439696, 504008, 598884) different numbers of mesh schemes were obtained. All calculations were done in COMSOL Multiphysics software, and the separated solver was used to calculate the cell variables sequentially, and the direct solver was used for each variable to improve convergence, and the simulation results are shown in Fig. 2. Among them, the difference between the results when the grid number is 504008 and 598884 is less than 1%, so the scheme with grid number 504008 is used.
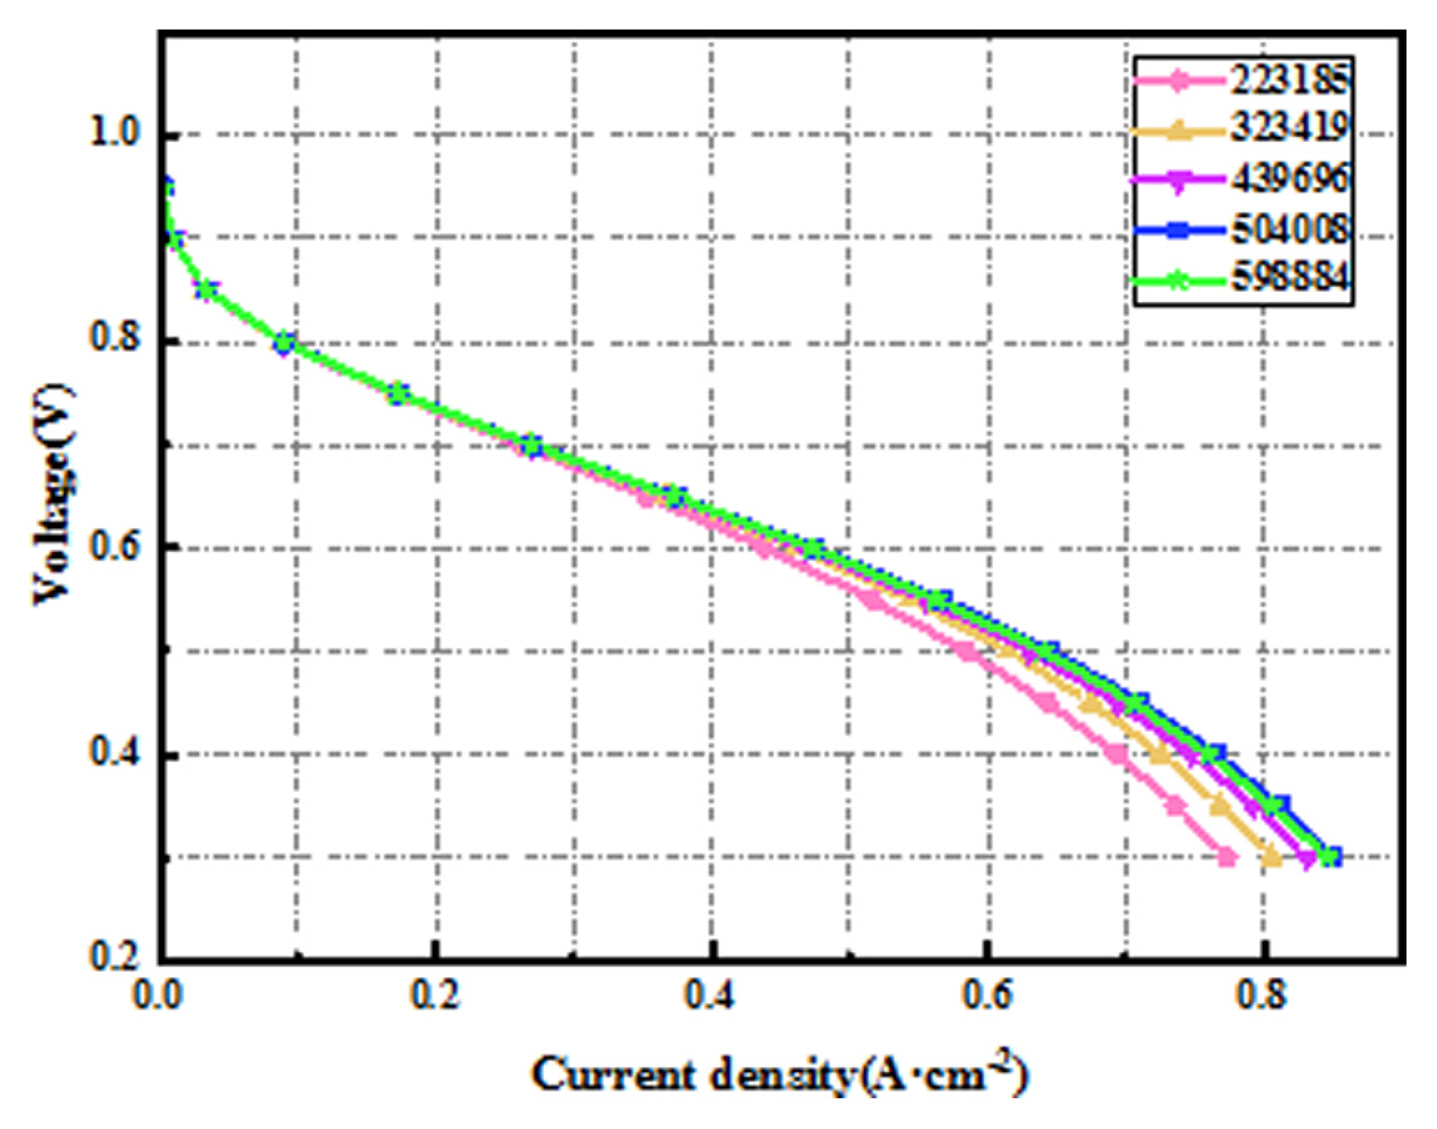
Grid independence test.
2.6 Model validation
This section reconstructs the geometric model in reference [30], and uses the model in section 2.3 and the meshing method in section 2.5 to confirm the accuracy of the model built in this study by comparing the calculated and experimental values. The results are shown in Fig. 3, and the polarization curves obtained from the calculation results and the reference results match, which illustrates the reasonableness of the model in this paper.
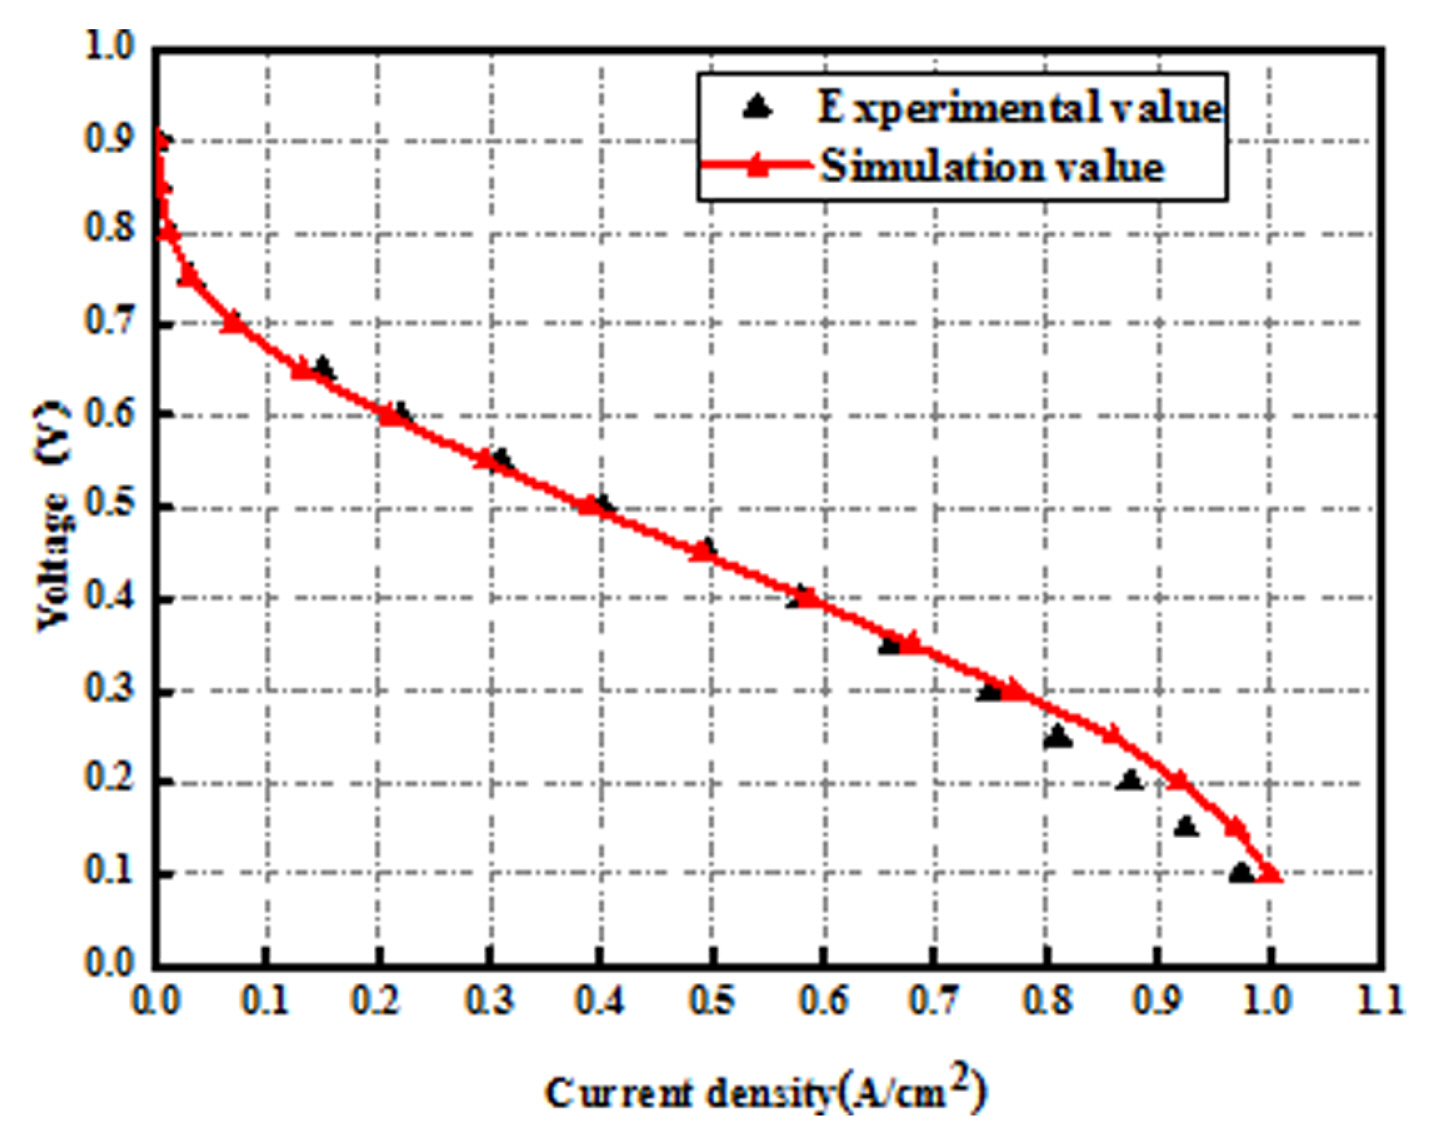
Comparison of reference results and calculation results.
3. Results and Discussion
3.1 Effect of the baffles number
In this subsection, five different flow fields were designed with the number of baffles as the main variable, BN = 3, BN = 5, BN = 7, BN = 9, and BN = 11, respectively, and the baffles were uniformly arranged throughout the flow field with the initial height set at 0.6 mm. The effect of baffles on the mass transfer and output performance of PEMFC was evaluated in terms of current density, power density, convection/diffusion flux, oxygen distribution, water distribution, and pressure drop.
The impact of the BN on the polarization curve and power density is shown in Fig. 4. As shown in Fig. 4(a): In the low current density region, the voltage loss mainly attributes to the activation polarization, and the flow channel structure has less effect on the current density. As current density grows, the effect of the baffle on PEMFC gradually appears. It can be seen that adding these 3D characteristics in the FF can all boost the reaction rate, and when BN = 9 and BN = 11, the two polarization curves almost overlap, indicating that the baffles start to converge on the enhancement of current density. In Fig. 4(b), the peak current density of various flow fields gradually increases and finally converges to 0.952 A/cm2 (BN = 9), which is 12.5% higher than that of the conventional PFF (0.846 A/cm2). The trend of power density is the same, with the number of baffles increasing sequentially, and finally, the extreme value converges to 0.349 W/cm2 (BN = 9), which is 9.1% higher than the conventional parallel flow field (0.32 W/cm2), indicating that the flow field performance is superior after adding baffles.
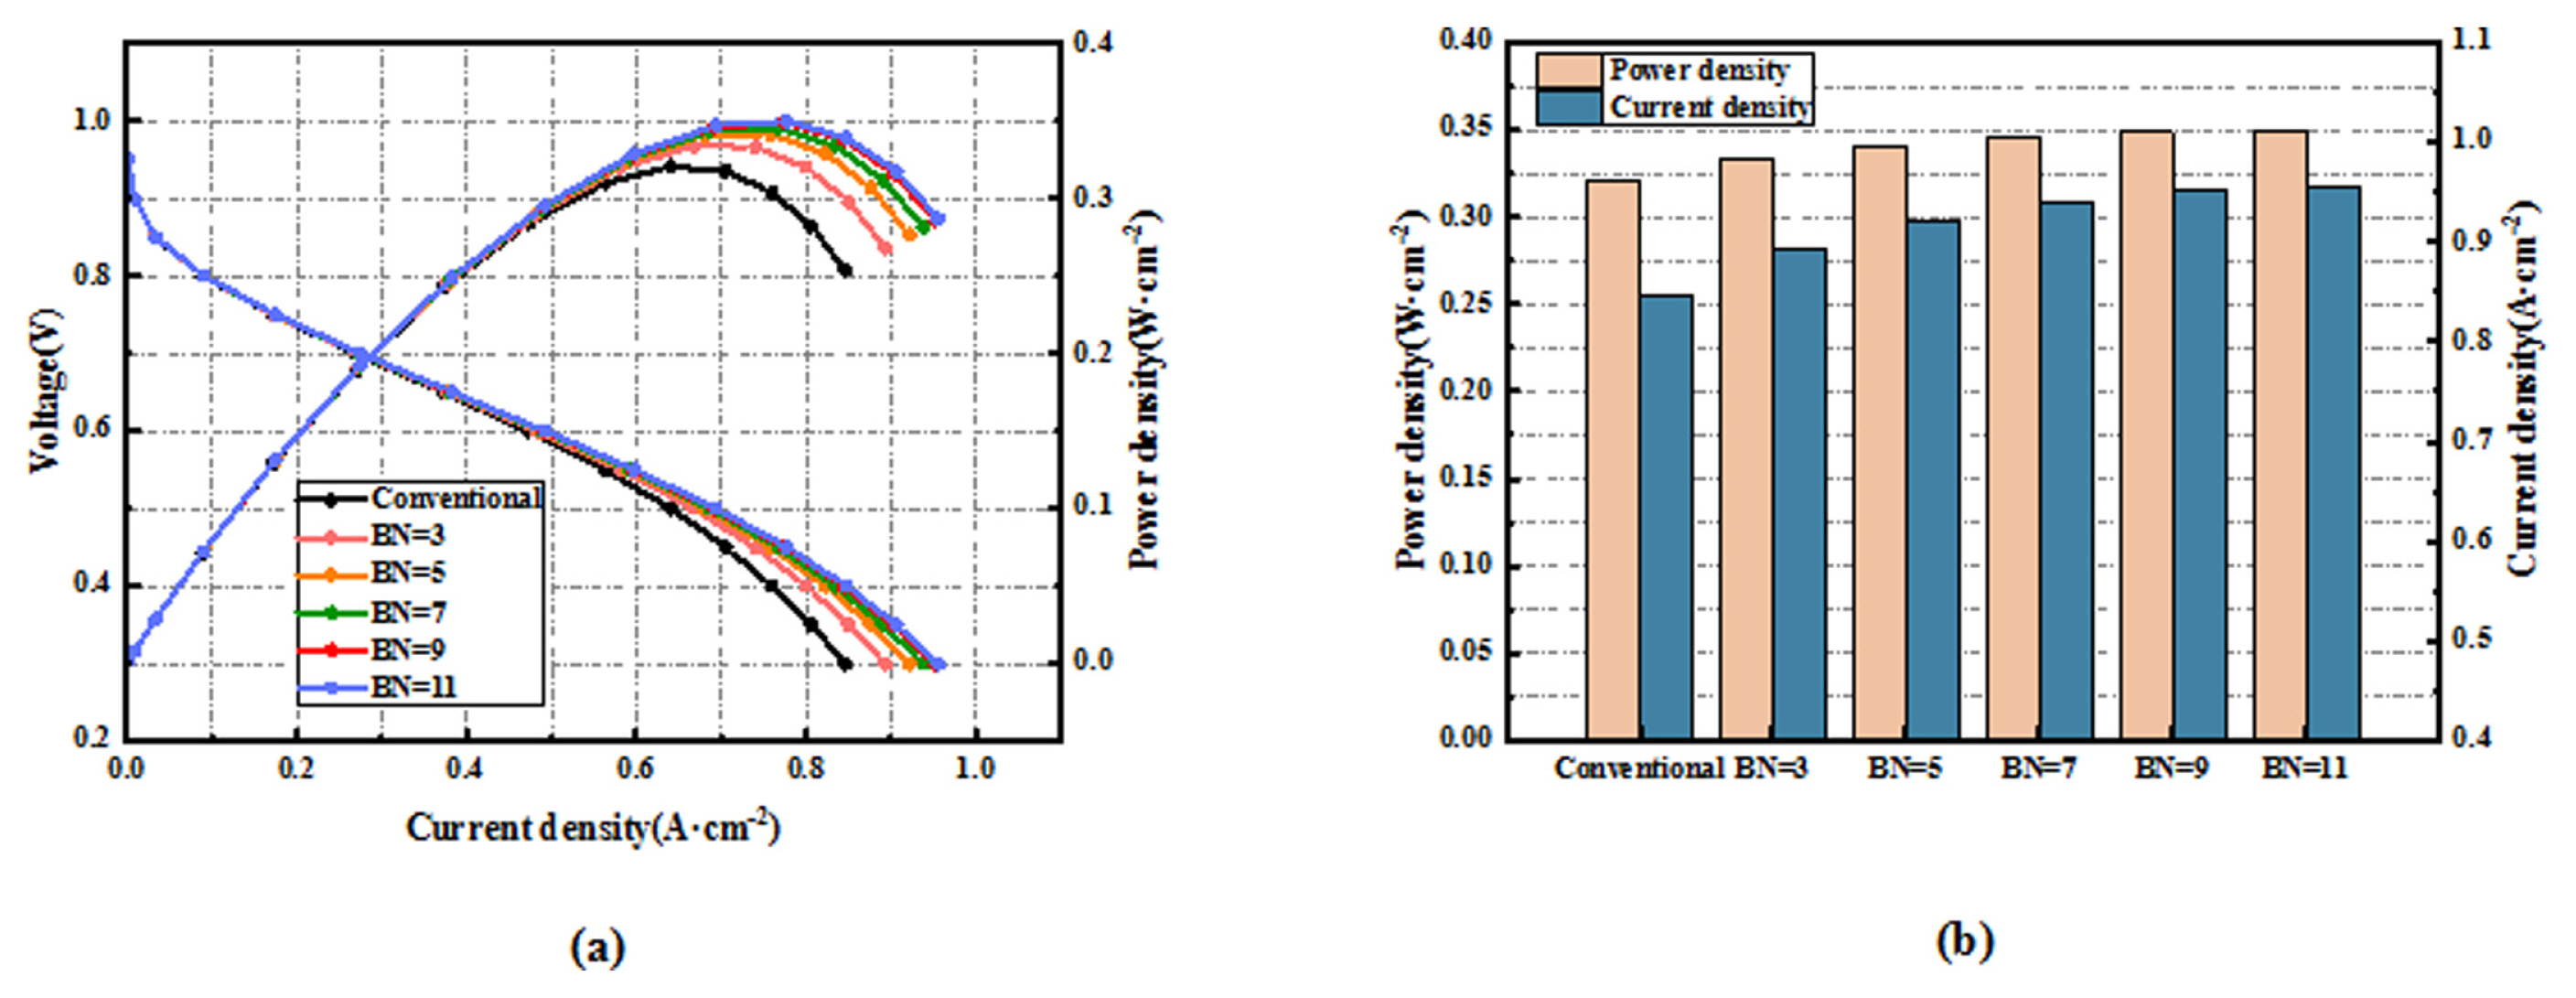
Different flow fields (a) U-I, P-I curves, (b) peak power density and peak current density.
To elucidate the influence of the 3D baffle on the nature of mass transfer, the variation of reactant mass fluxes was compared in six cases. As can be seen in Fig. 5, the total oxygen flux gradually decreases from the inlet to the outlet for each scheme. As the number of baffles increases, the oxygen flux in the flow channel gradually increases, with the increase in flux at the baffles being particularly pronounced. The curves shown in Fig. 6 reflect the local (X = 10.5 mm) oxygen convective and diffusive mass fluxes along the Y-axis direction at the contact surface of the channel and GDL. They can be calculated using the following equations, respectively [19]:
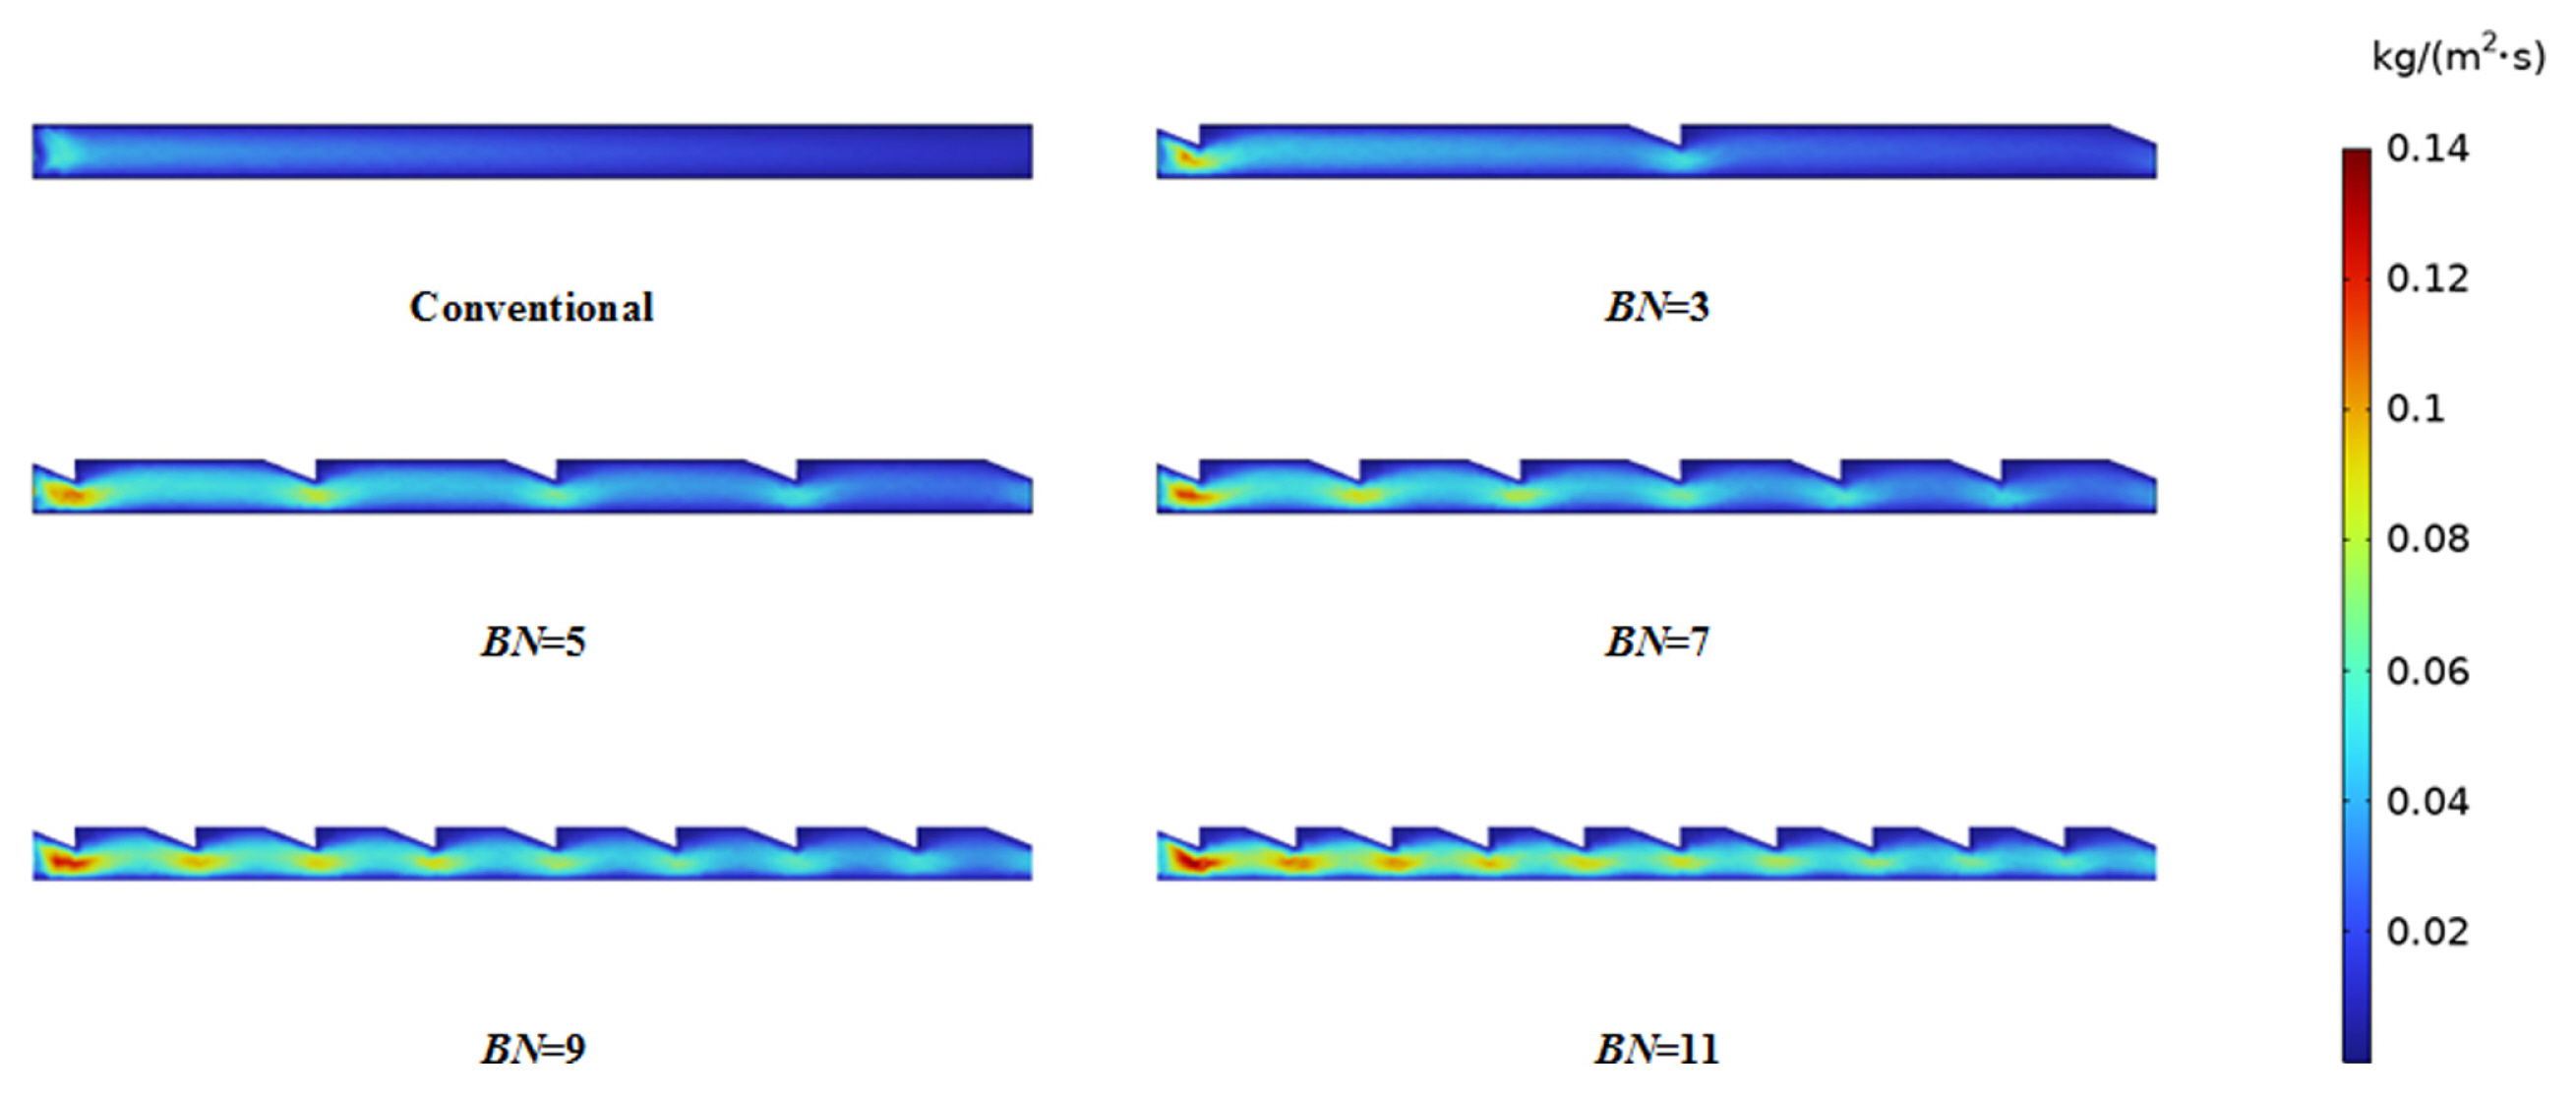
Local oxygen flux in the flow channel.
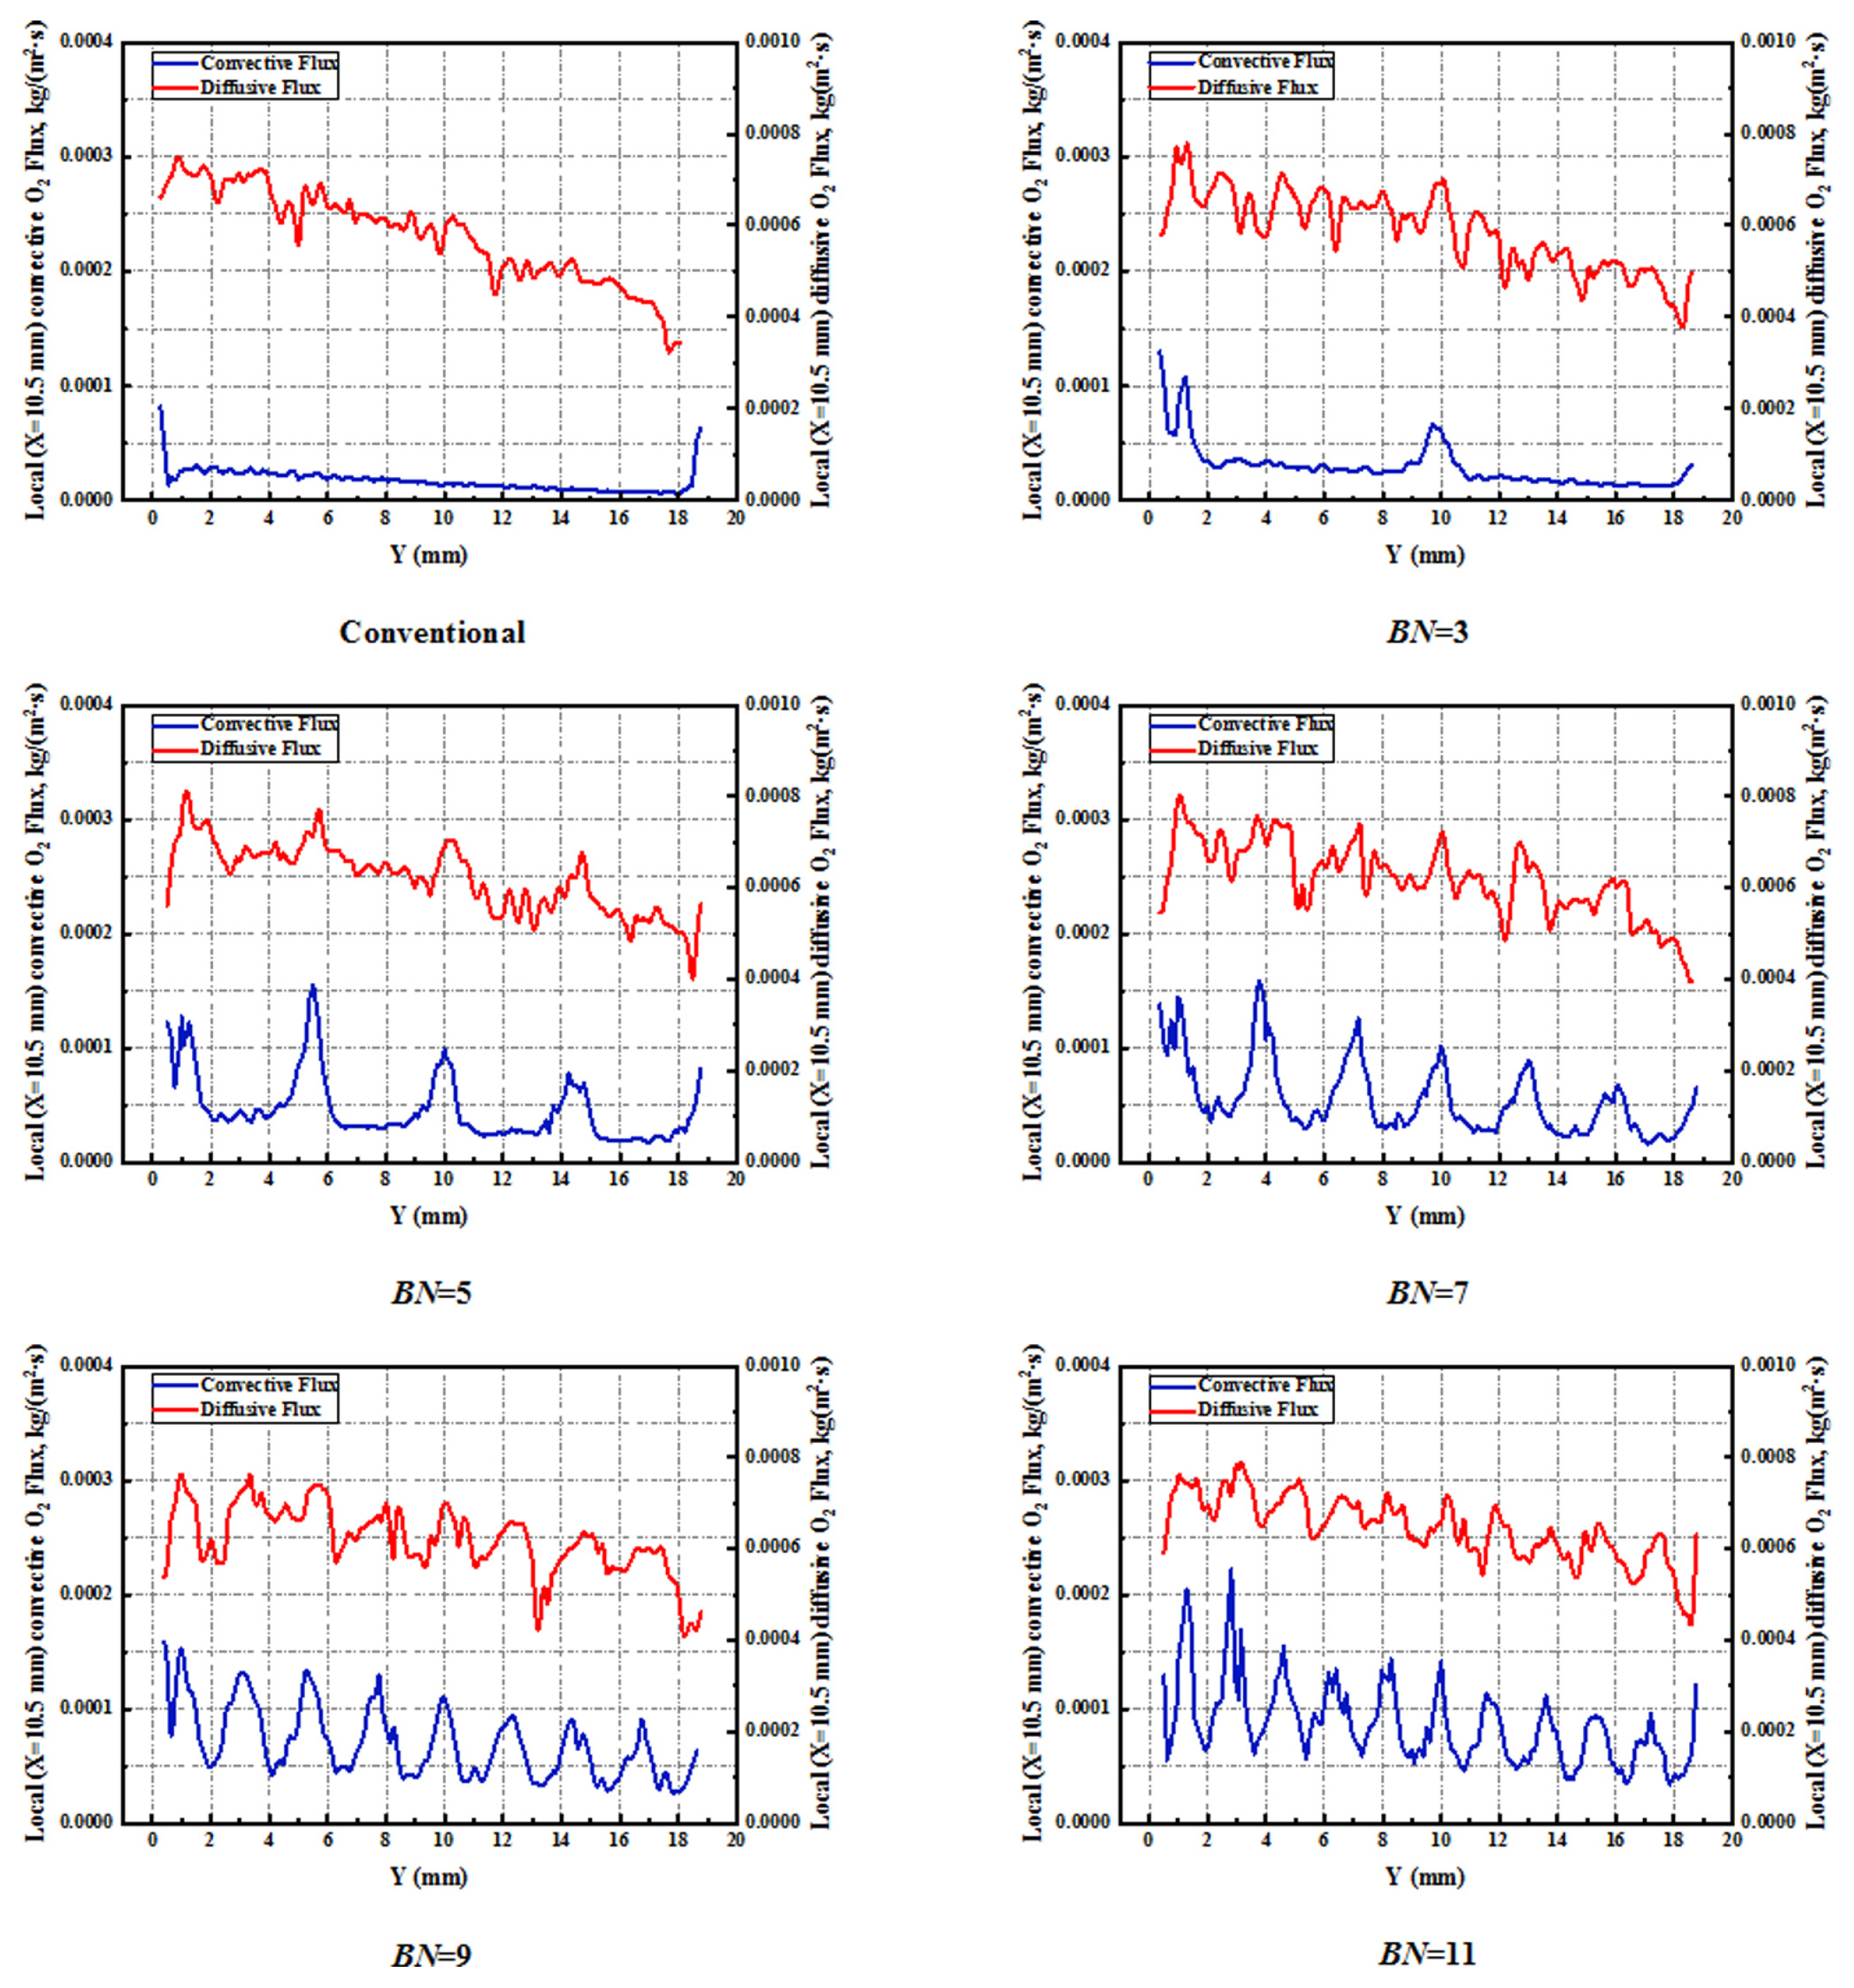
Local (X = 10.5 mm) oxygen convection mass flux and diffusion mass flux along the Y-axis direction at the contact surface between the channel and GDL at 0.6 V.
where QC is the convective mass flux, QD is the diffusive mass flux, dC / dy is the oxygen concentration gradient, and
Fig. 7 is the oxygen mass fraction distribution on the CL/GDL surface. It indicates that in all scenarios, the oxygen mass fraction decreases by degrees toward the gas flow direction due to the continuous electrochemical reaction, which verifies the inevitable trend of gradually decreasing diffusion flux in Fig. 5. In the conventional PFF without the addition of the 3D baffle, there is an obvious low oxygen region on the CL/GDL surface, and the oxygen mass fraction in the region under the rib is more depleted than that in the region covered by the flow channel. This phenomenon is gradually improved with the addition of the 3D baffle. It shows that when BN = 3, the oxygen mass fraction in the non-under-rib region has been improved, and when BN = 9, the oxygen concentration has increased significantly, and the oxygen concentration in the under-rib region has improved significantly contrast to the conventional PFF due to the enhancement of convective mass transfer, which indicates that the addition of baffles makes the oxygen in the FF more well-distributed. When the number of baffles was increased to eleven, although the gas distribution uniformity was improved, the improvement was smaller compared to that for BN = 9. In addition, the average mass fraction of oxygen on the CL/GDL surface at 0.6 V operating conditions was used to characterize the gas distribution uniformity, defined as [31]:
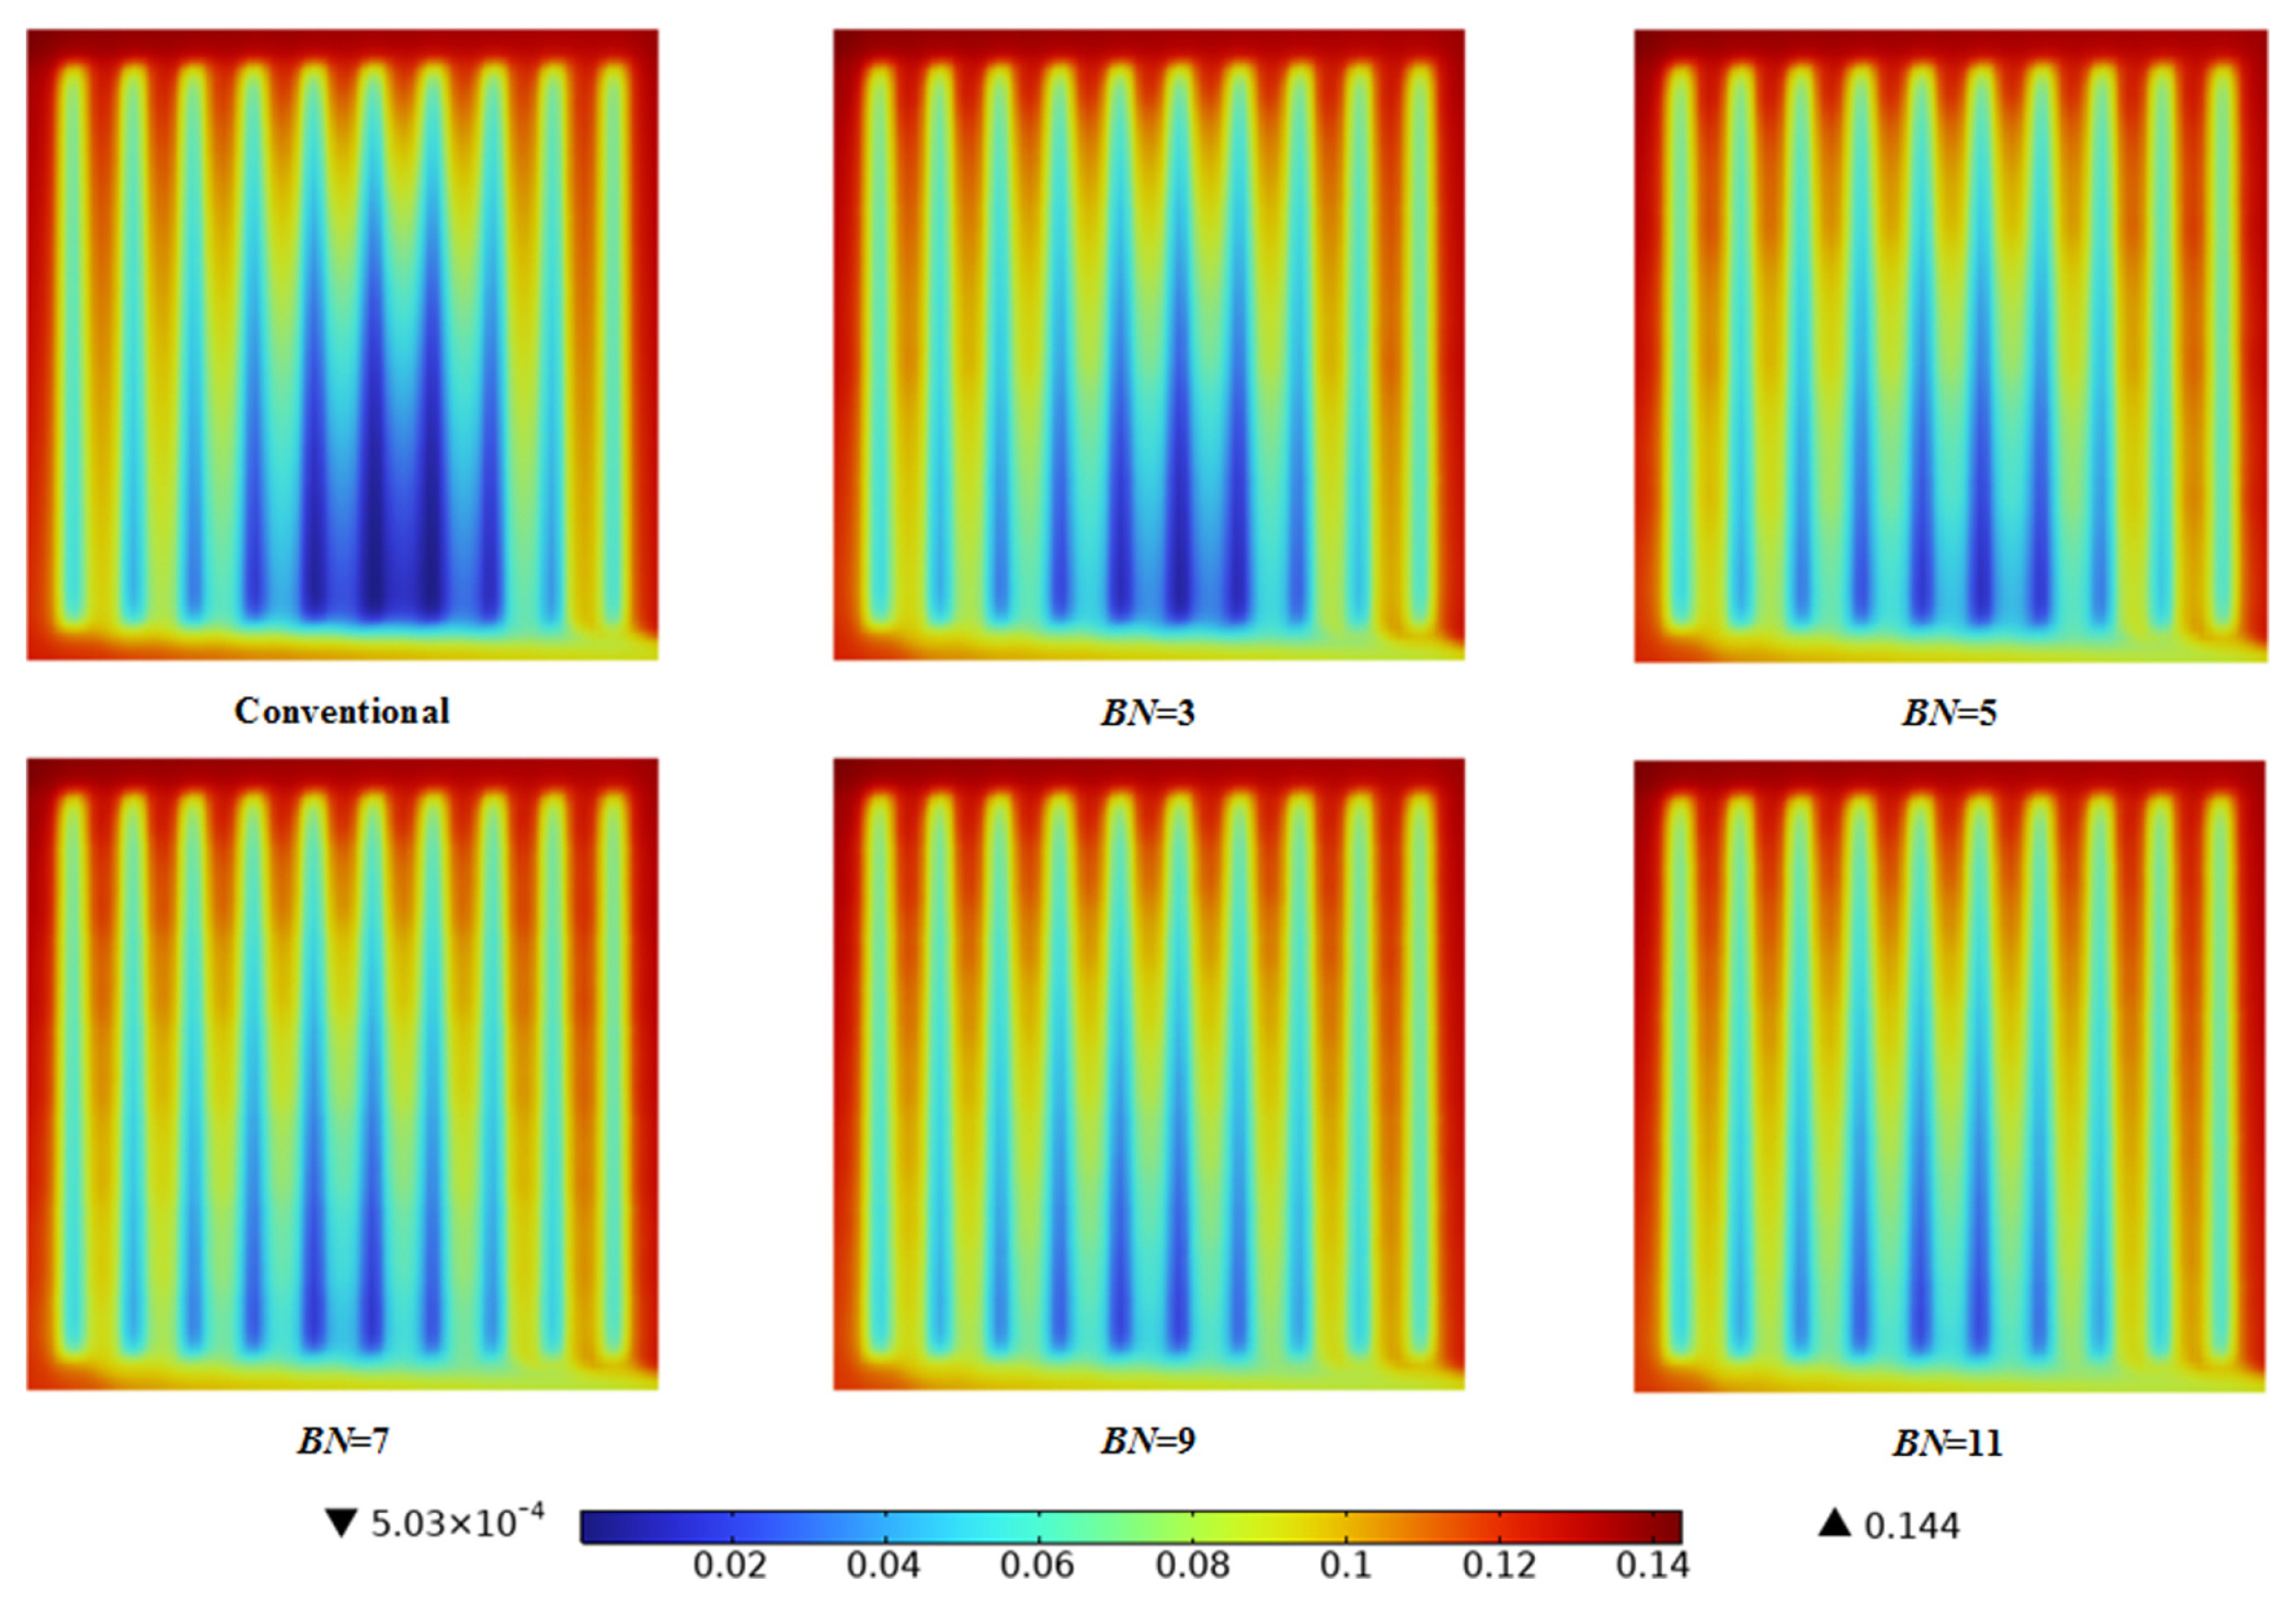
Oxygen mass fraction distribution on the surface of CL/GDL in different flow fields at 0.6 V.
where f denotes the mass fraction of oxygen on the CL/GDL surface. The average mass fraction of oxygen for different schemes is shown in Fig. 8, with values of 0.0766, 0.0807, 0.0831, 0.0844, 0.0857, and 0.0860 for the conventional PFF, BN = 3, BN = 5, BN = 7, BN = 9, and BN = 11, in that order, which are improved by 5.3%, 8.4%, 10.2%, 11.8%, and 12.2%, respectively. As the number of baffles increases, the gas homogeneity keeps improving and reaches the best condition at BN = 11.

Average mass fraction of oxygen at 0.6 V.
Moderate water content can improve the proton conductivity, so the relative humidity of the gases in this paper is set to 100%. And since the electrochemical reaction products in CL contain water, the water that cannot be discharged in time will accumulate in CL and GDL, affecting the mass transfer effect and reducing the fuel cell performance, so the drainage capacity is also a key factor to boost the PEMFC performance. The mass fraction distribution of water on the surface of CL/GDL is illustrated in Fig. 9. It shows that the water content in the conventional PFF is high, and this phenomenon is more obvious, especially in the area under the rib. With the increasing number of baffles, the drainage capacity of the FF also increases, which is due to the geometric structure of the gas flowing through the baffles to promote gas convection and accelerate the discharge of water from the CL and GDL. When the water back into the flow channel can be blown out by the fast-flowing gas, which is also the reason why the water concentration in the area under the rib is higher than in other areas. Equation (3) was used to calculate the CL/GDL surface level average mass fraction to characterize the water distribution uniformity. The average mass fraction of water for different scenarios is illustrated in Fig. 10, with values of 0.4293, 0.4250, 0.4225, 0.4211, 0.4199, and 0.4196 for the six scenarios in order. The addition of baffles reduces the water content and improves the uniformity of water distribution, and the performance improvement (2.25%) already tends to be maximum when BN = 9. The difference between the improvement brought by continuing to increase the number of baffles to eleven and that at BN = 9 is smaller.
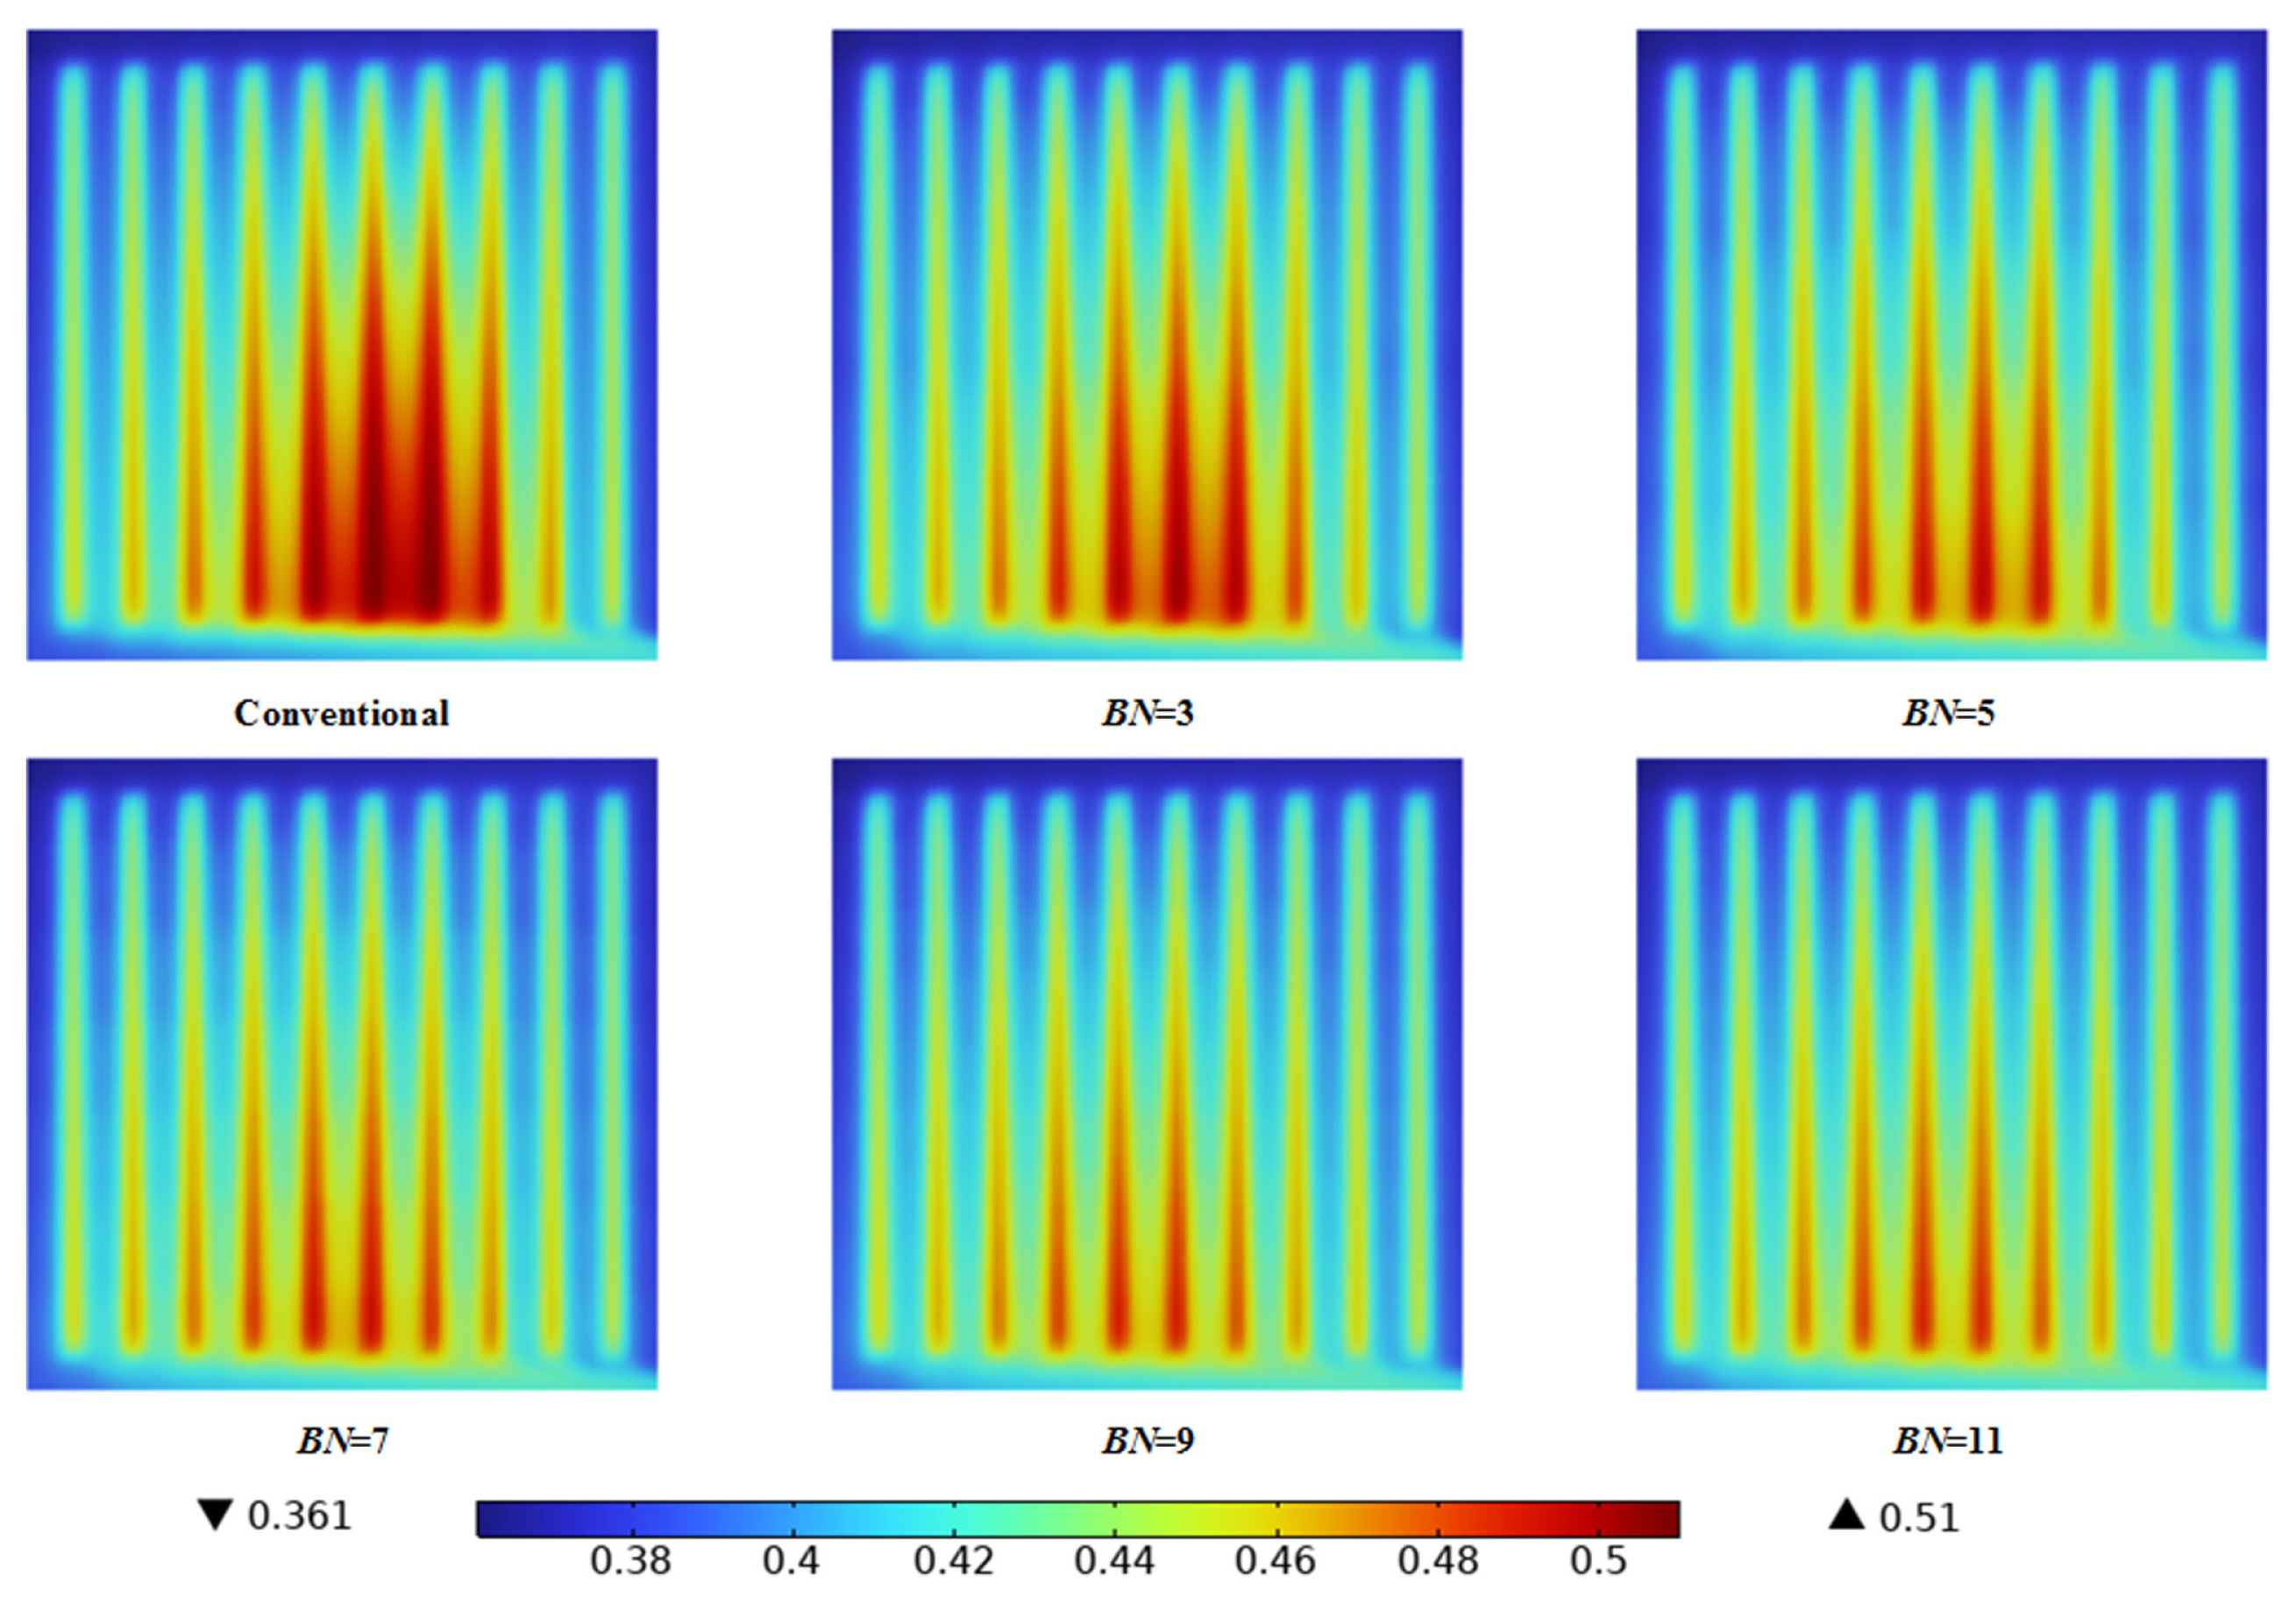
CL/GDL surface water mass fraction distribution at 0.6 V.
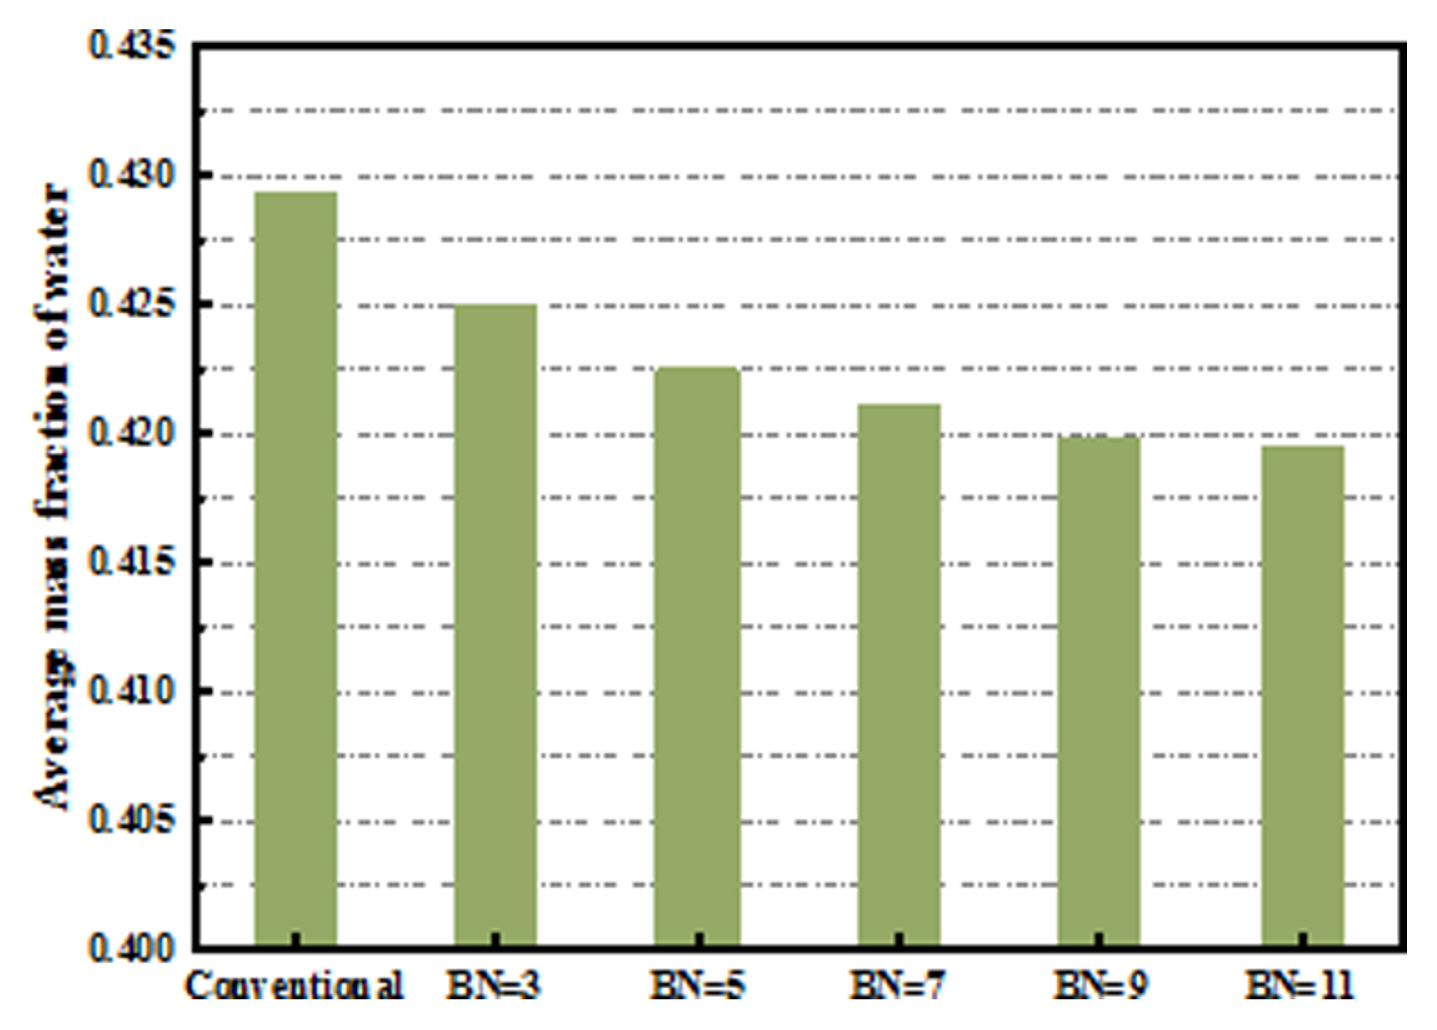
Average mass fraction of water at 0.6 V.
The velocity distribution of oxygen in the flow field is shown in Fig. 11. It can be seen that the velocity distribution in each flow field has a similar pattern, with the velocity in both flow channels being larger and decreasing toward the middle channel, which means that the flow rate in the middle region flow channel is smaller than the flow rate in both flow channels. Although the addition of the baffle can improve the velocity uniformity, the improvement of the problem of insufficient gas supply in the middle channel is limited, and the lower gas flow rate is not conducive to water discharge. This also explains the undersupply of gas and water accumulation in this region, indicating that this flow field structure can lead to this phenomenon. There are two main sources of water in the flow field, besides the inlet input, the other main source is generated by the electrochemical reaction, which consumes oxygen, so the mass fraction of oxygen and water in the flow field is negatively correlated, and as the mass fraction of oxygen gradually decreases, the mass fraction of water gradually increases.
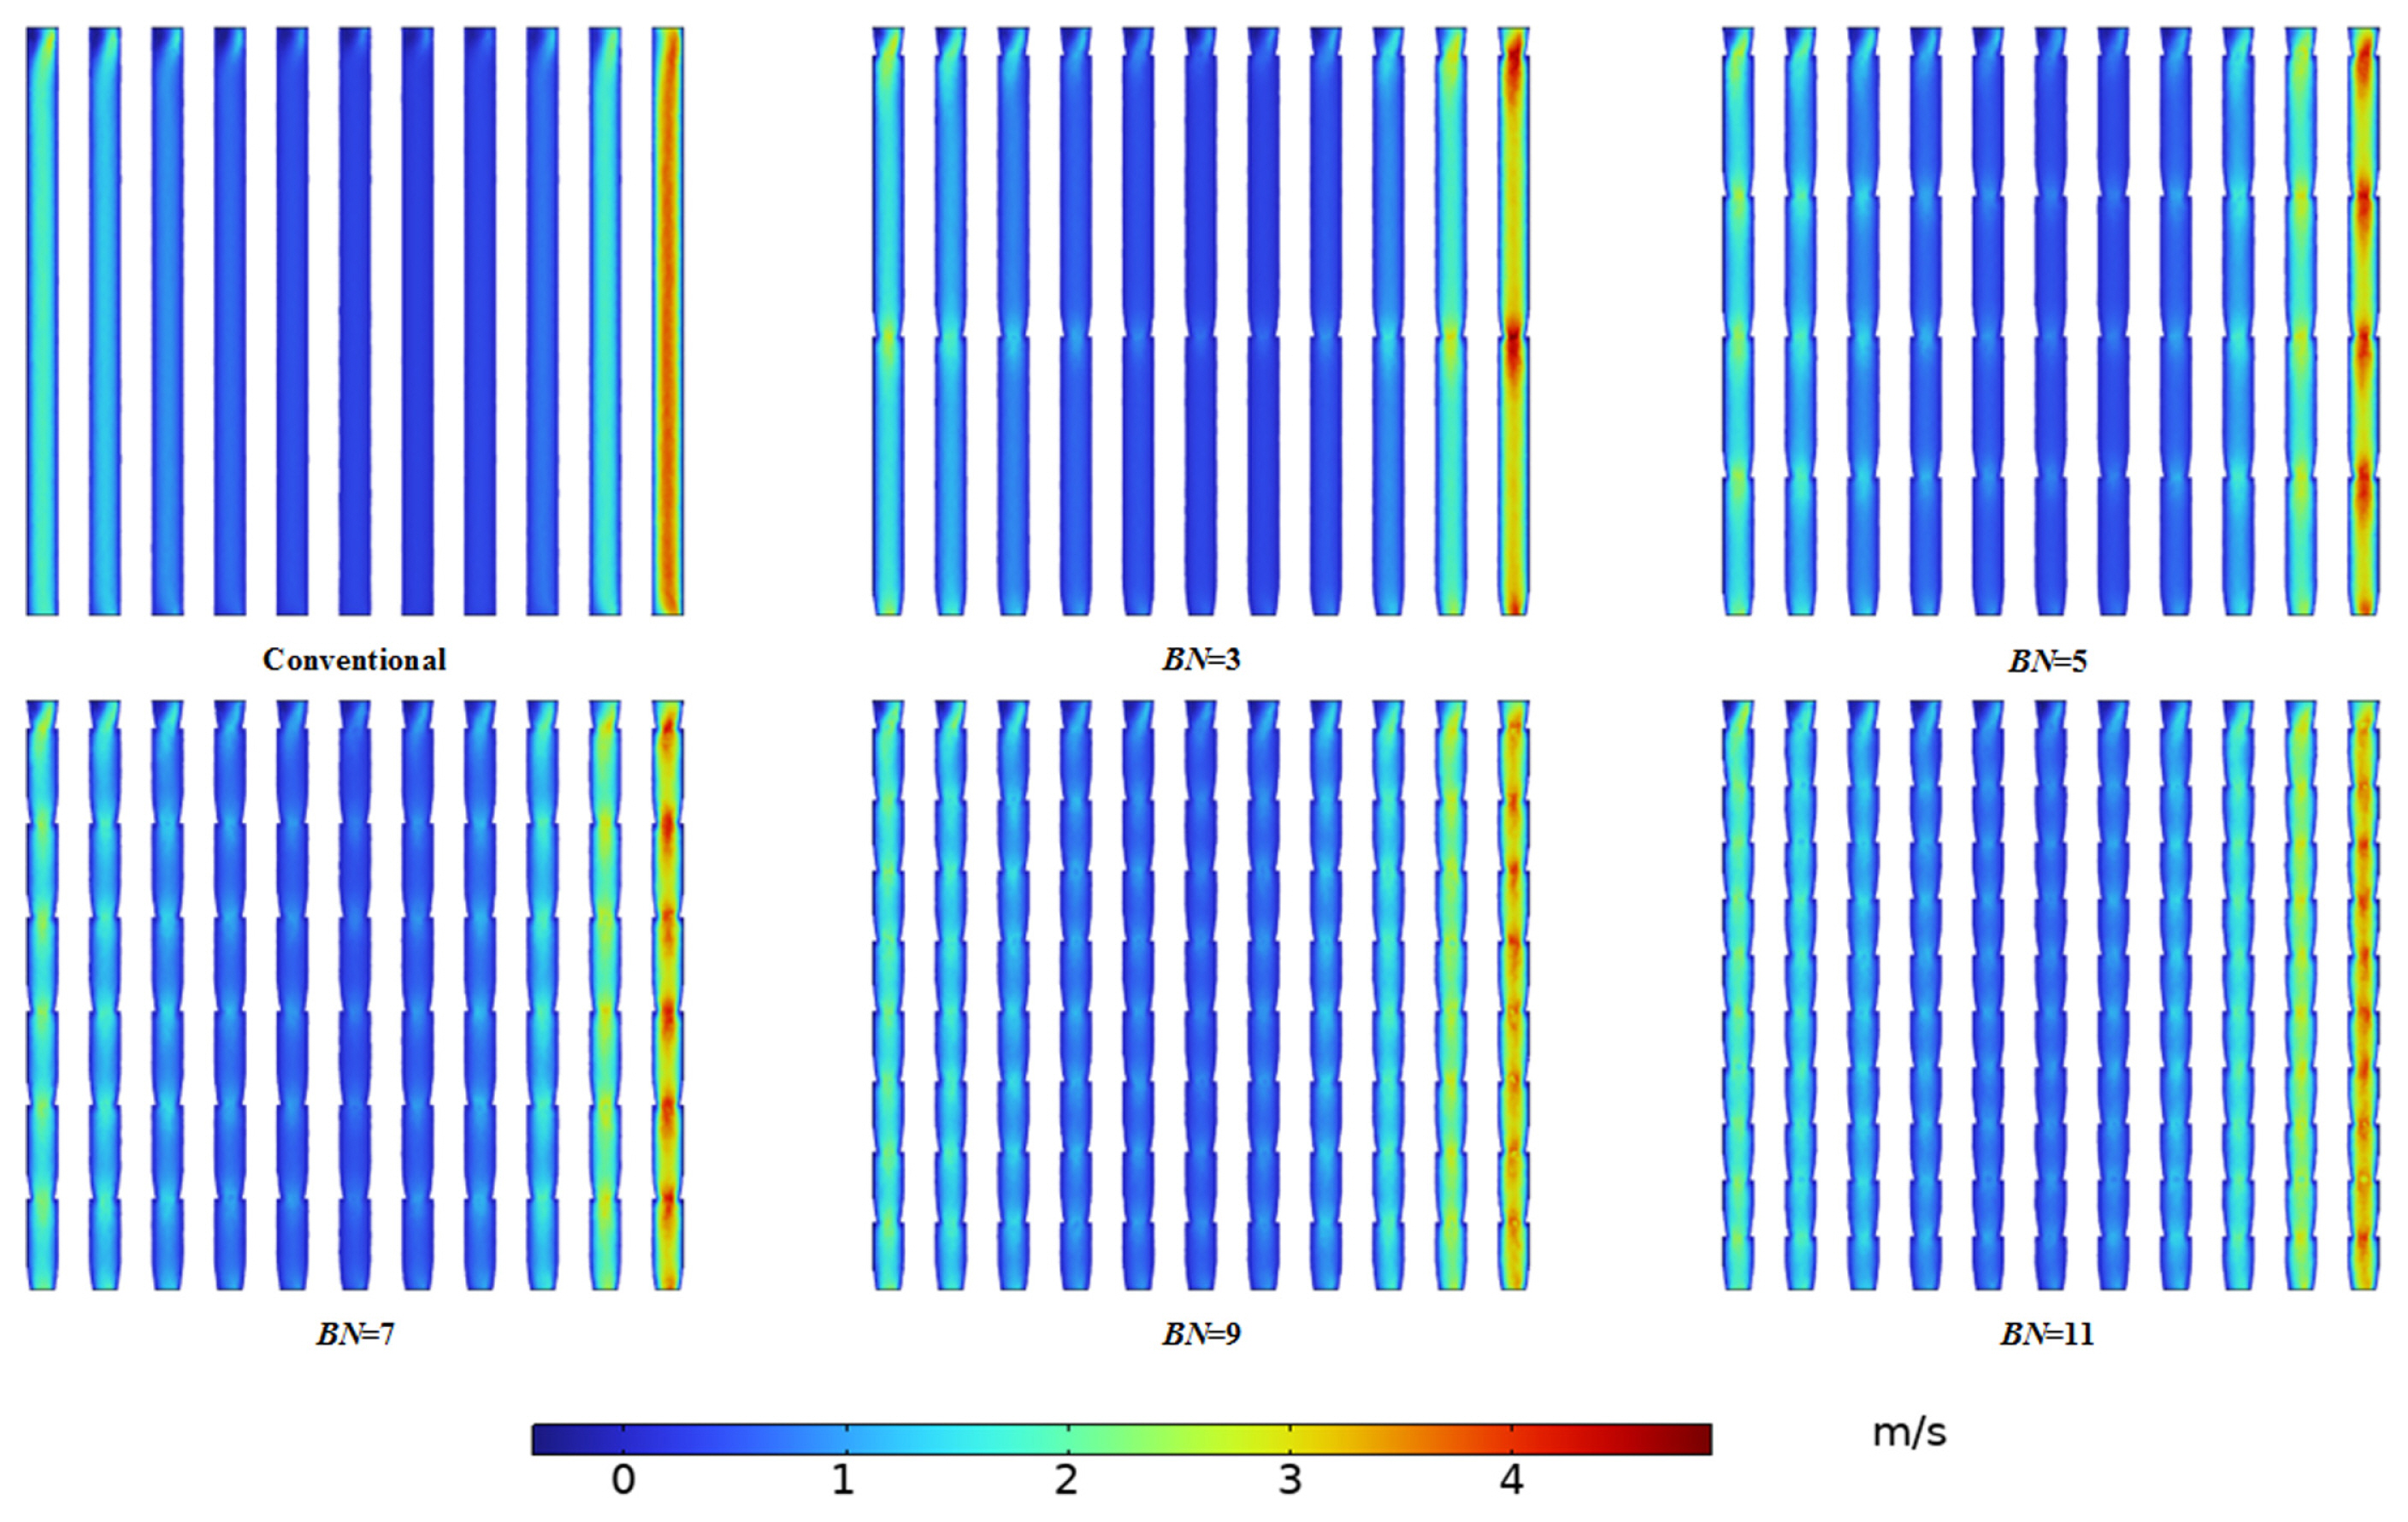
Velocity distribution in different flow fields.
Due to the inclusion of baffles in the flow channel, the resistance to gas flow increases, which inevitably increases the pressure loss. While considering the enhanced mass transfer, the additional pumping power caused by the pressure loss cannot be ignored. To investigate the influence of pressure drop on the power density of fuel cell, these two factors of different FF are given in Fig. 10. It shows that the pressure drop in the FF is positively correlated with the number of baffles, and the pressure loss becomes progressively larger as the number of baffles increases. However, even the scheme with the largest pressure drop is only 24 Pa larger than the conventional parallel flow field, which cannot have a decisive impact on the net power density. As shown in Fig. 12, the variation pattern of net power density is the same as that of peak power density in Fig. 4.
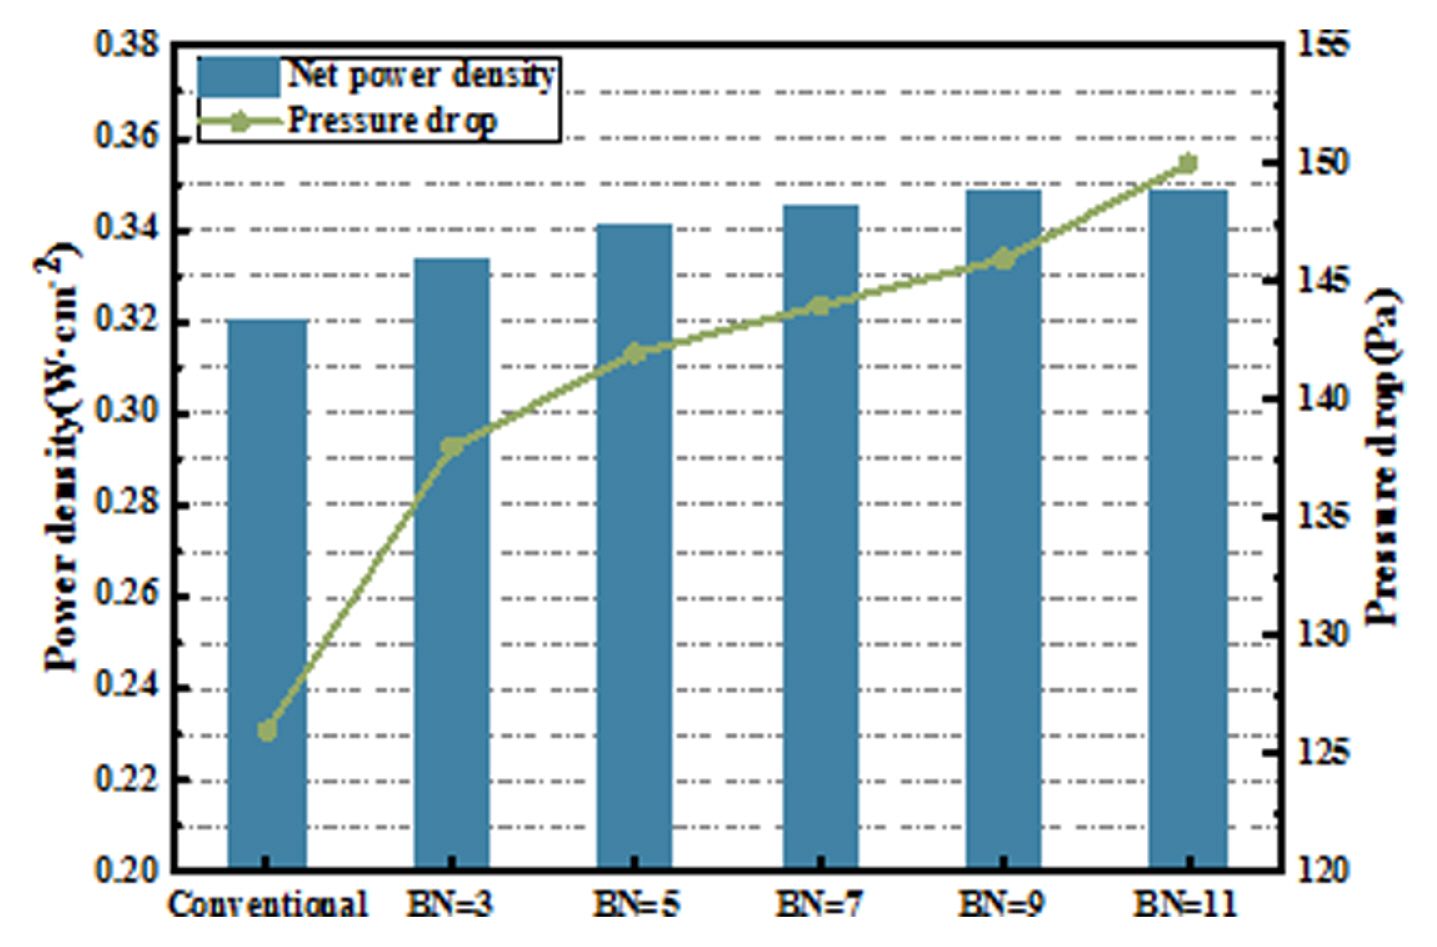
Pressure drop and net power density.
In summary, adding 3D baffles can increase the performance of fuel cells, and the two schemes of BN = 9 and BN = 11 have similar performance improvement, but considering the influence of processing difficulty and pressure drop, the scheme with too many baffles is undesirable, and BN = 9 is a more suitable scheme and deserves further study.
3.2 Effect of the baffle section height
In previous studies, only the influence of baffle number on PEMFC performance increase was explored, while the influence of baffle height on cell output performance was also significant [32]. Therefore, in this subsection, the cross-sectional trapezoidal base angle is taken as the key variable, and the scheme of the number of baffles (BN = 9) with the best output performance in Section 3.1 is followed. Under the premise of ensuring the uniform reduction of the cross section?a total of seven schemes with θ = 86°, θ = 78°, θ = 63°, θ = 58°, θ = 40°, θ = 34°, and θ = 26° were designed and compared with the conventional parallel flow field (θ = 90°) for each index to complete the optimal design of the 3D baffle.
The impact of the height of the baffle cross-section on the polarization curves and power density is depicted in Fig. 13. It shows that in the region of high current density, the difference caused by the value of θ on the two types of curves with different flow fields is significant. With the gradual decrease of θ, the variation pattern presented by the current density curves increases and then decreases, peaking at θ = 58° and then starting to decrease, with the worst effect at θ = 26°. The same effect on the power density indicates that the change in the height of the baffle cross-section not only has a facilitating effect but also a negative one, due to the increase in the channel blockage ratio caused by too low a height, which hinders the gas flow. Among them, the power density (0.355 W/cm2) is the largest for θ = 58°, which is 10.9% higher than the conventional parallel flow field (0.32 W/cm2).
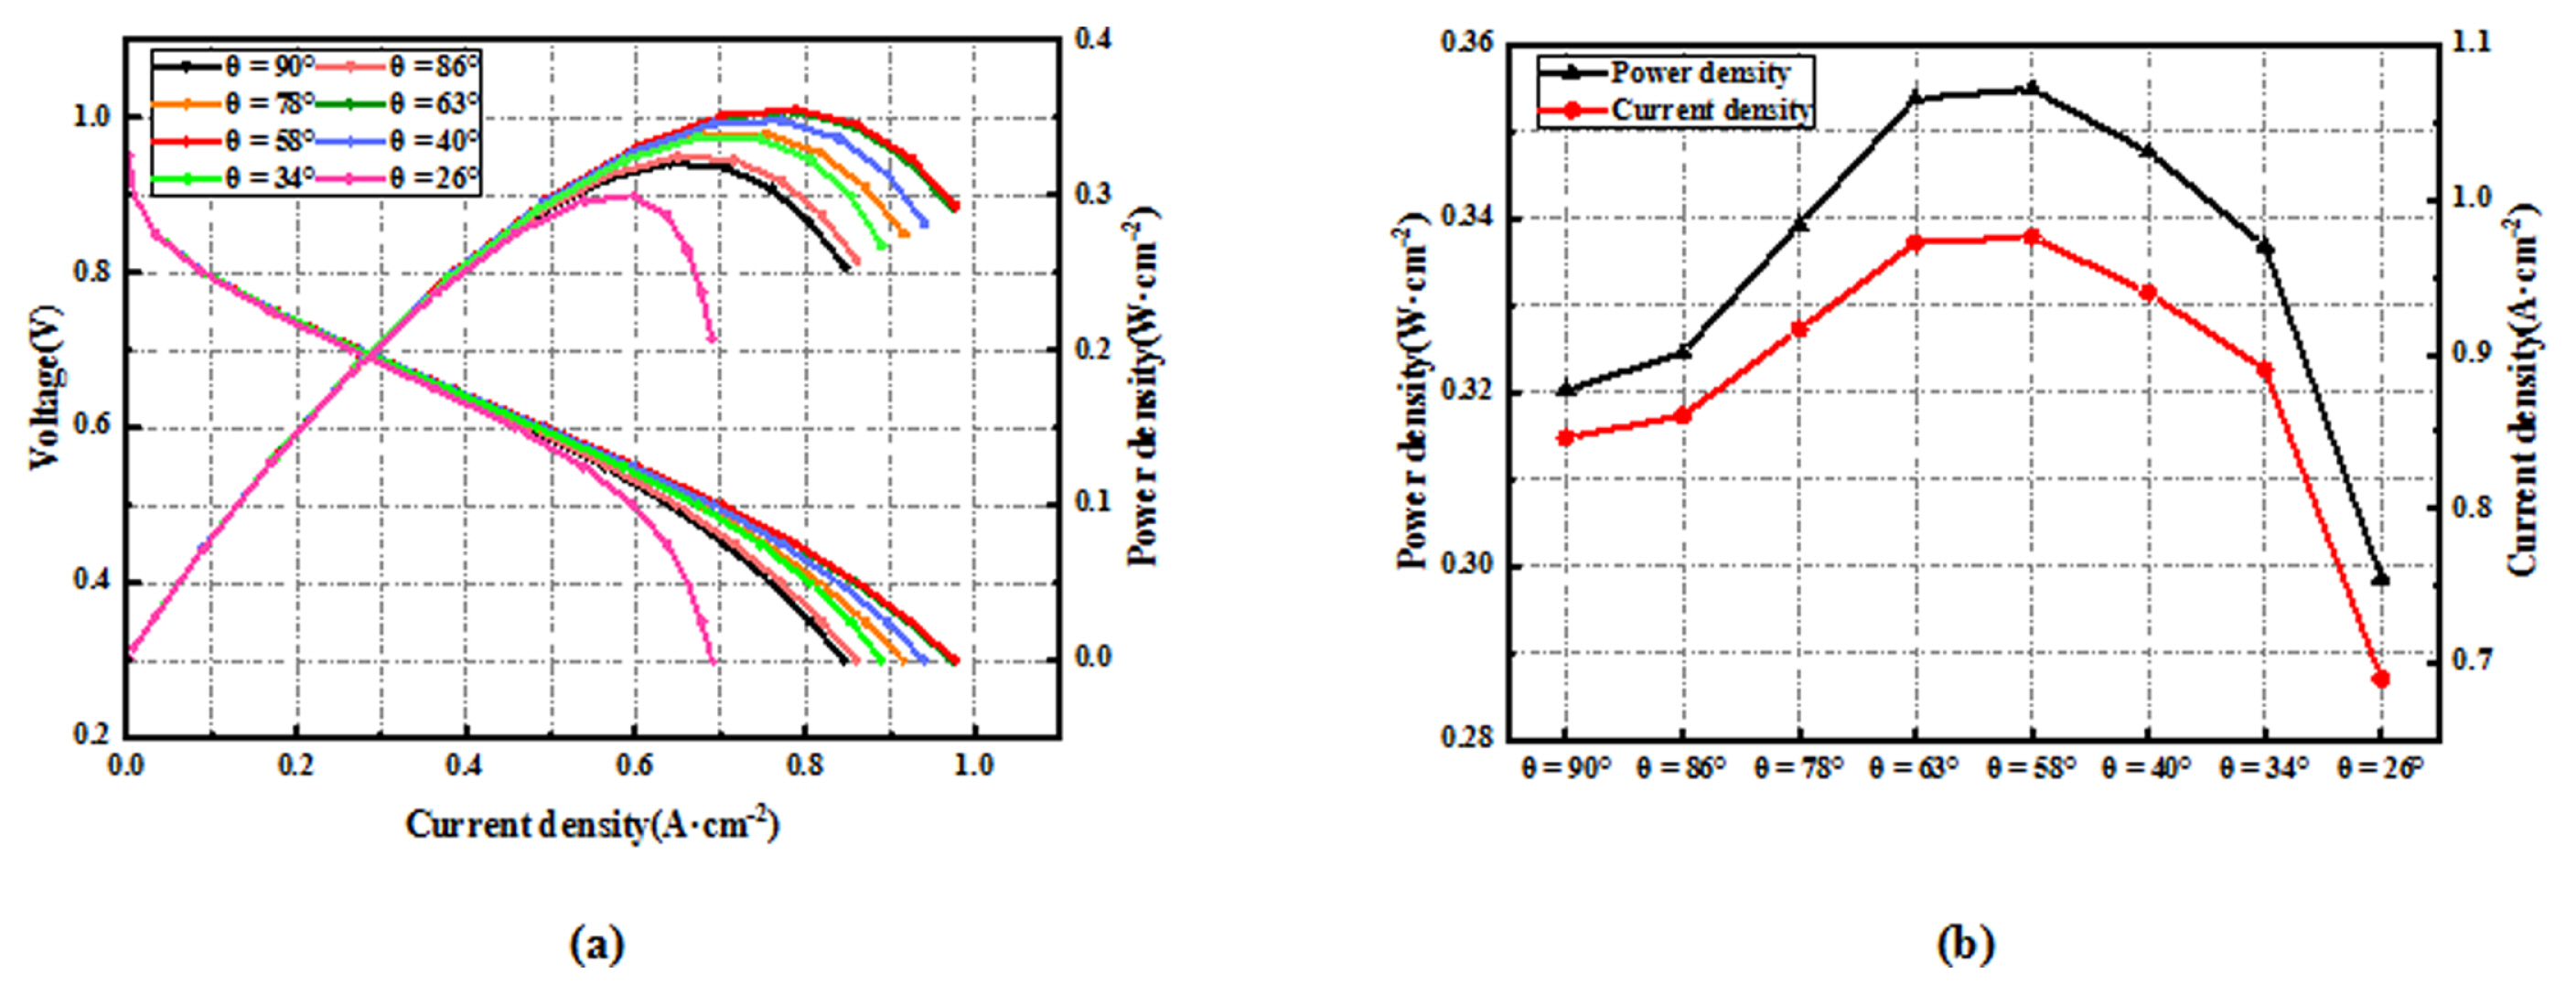
Different flow fields (a) U-I, P-I curves, (b) peak power density and peak current density.
Fig. 14 shows the local (X = 10.5 mm) oxygen convective mass flux and diffusive mass flux along the Y-axis direction for different flow field channels with GDL contact surface. It can be seen that when θ is larger, the cross-sectional area of the channel at the baffle is larger, and the pressure on the gas flowing through the baffle is smaller at the moment, so the velocity component generated in the Z-axis direction is small, and the corresponding convective mass transfer effect is not obvious, and the diffusive flux is larger than the convective flux at this time. With the gradual decrease of θ, the channel cross-section gradually shrinks, and when θ = 34°, the convective flux increases significantly at the baffle position. When θ = 58°, the convective mass transfer continues to increase and is close to the diffusive mass flux in numerical terms. When the angle was reduced, the convective flux increased rapidly and far exceeded the diffusive flux due to the increased contraction of the channel cross-section, and not only that, the diffusive flux also showed significant fluctuations at the baffle position, which was the result of the local oxygen concentration gradient caused by the baffle. Although the mass transfer effect caused by the reduction of base angle continues to be enhanced, Fig. 13 shows that the performance of PEMFC decreases gradually with θ below 40°, which may be related to the overall uniformity of oxygen distribution.
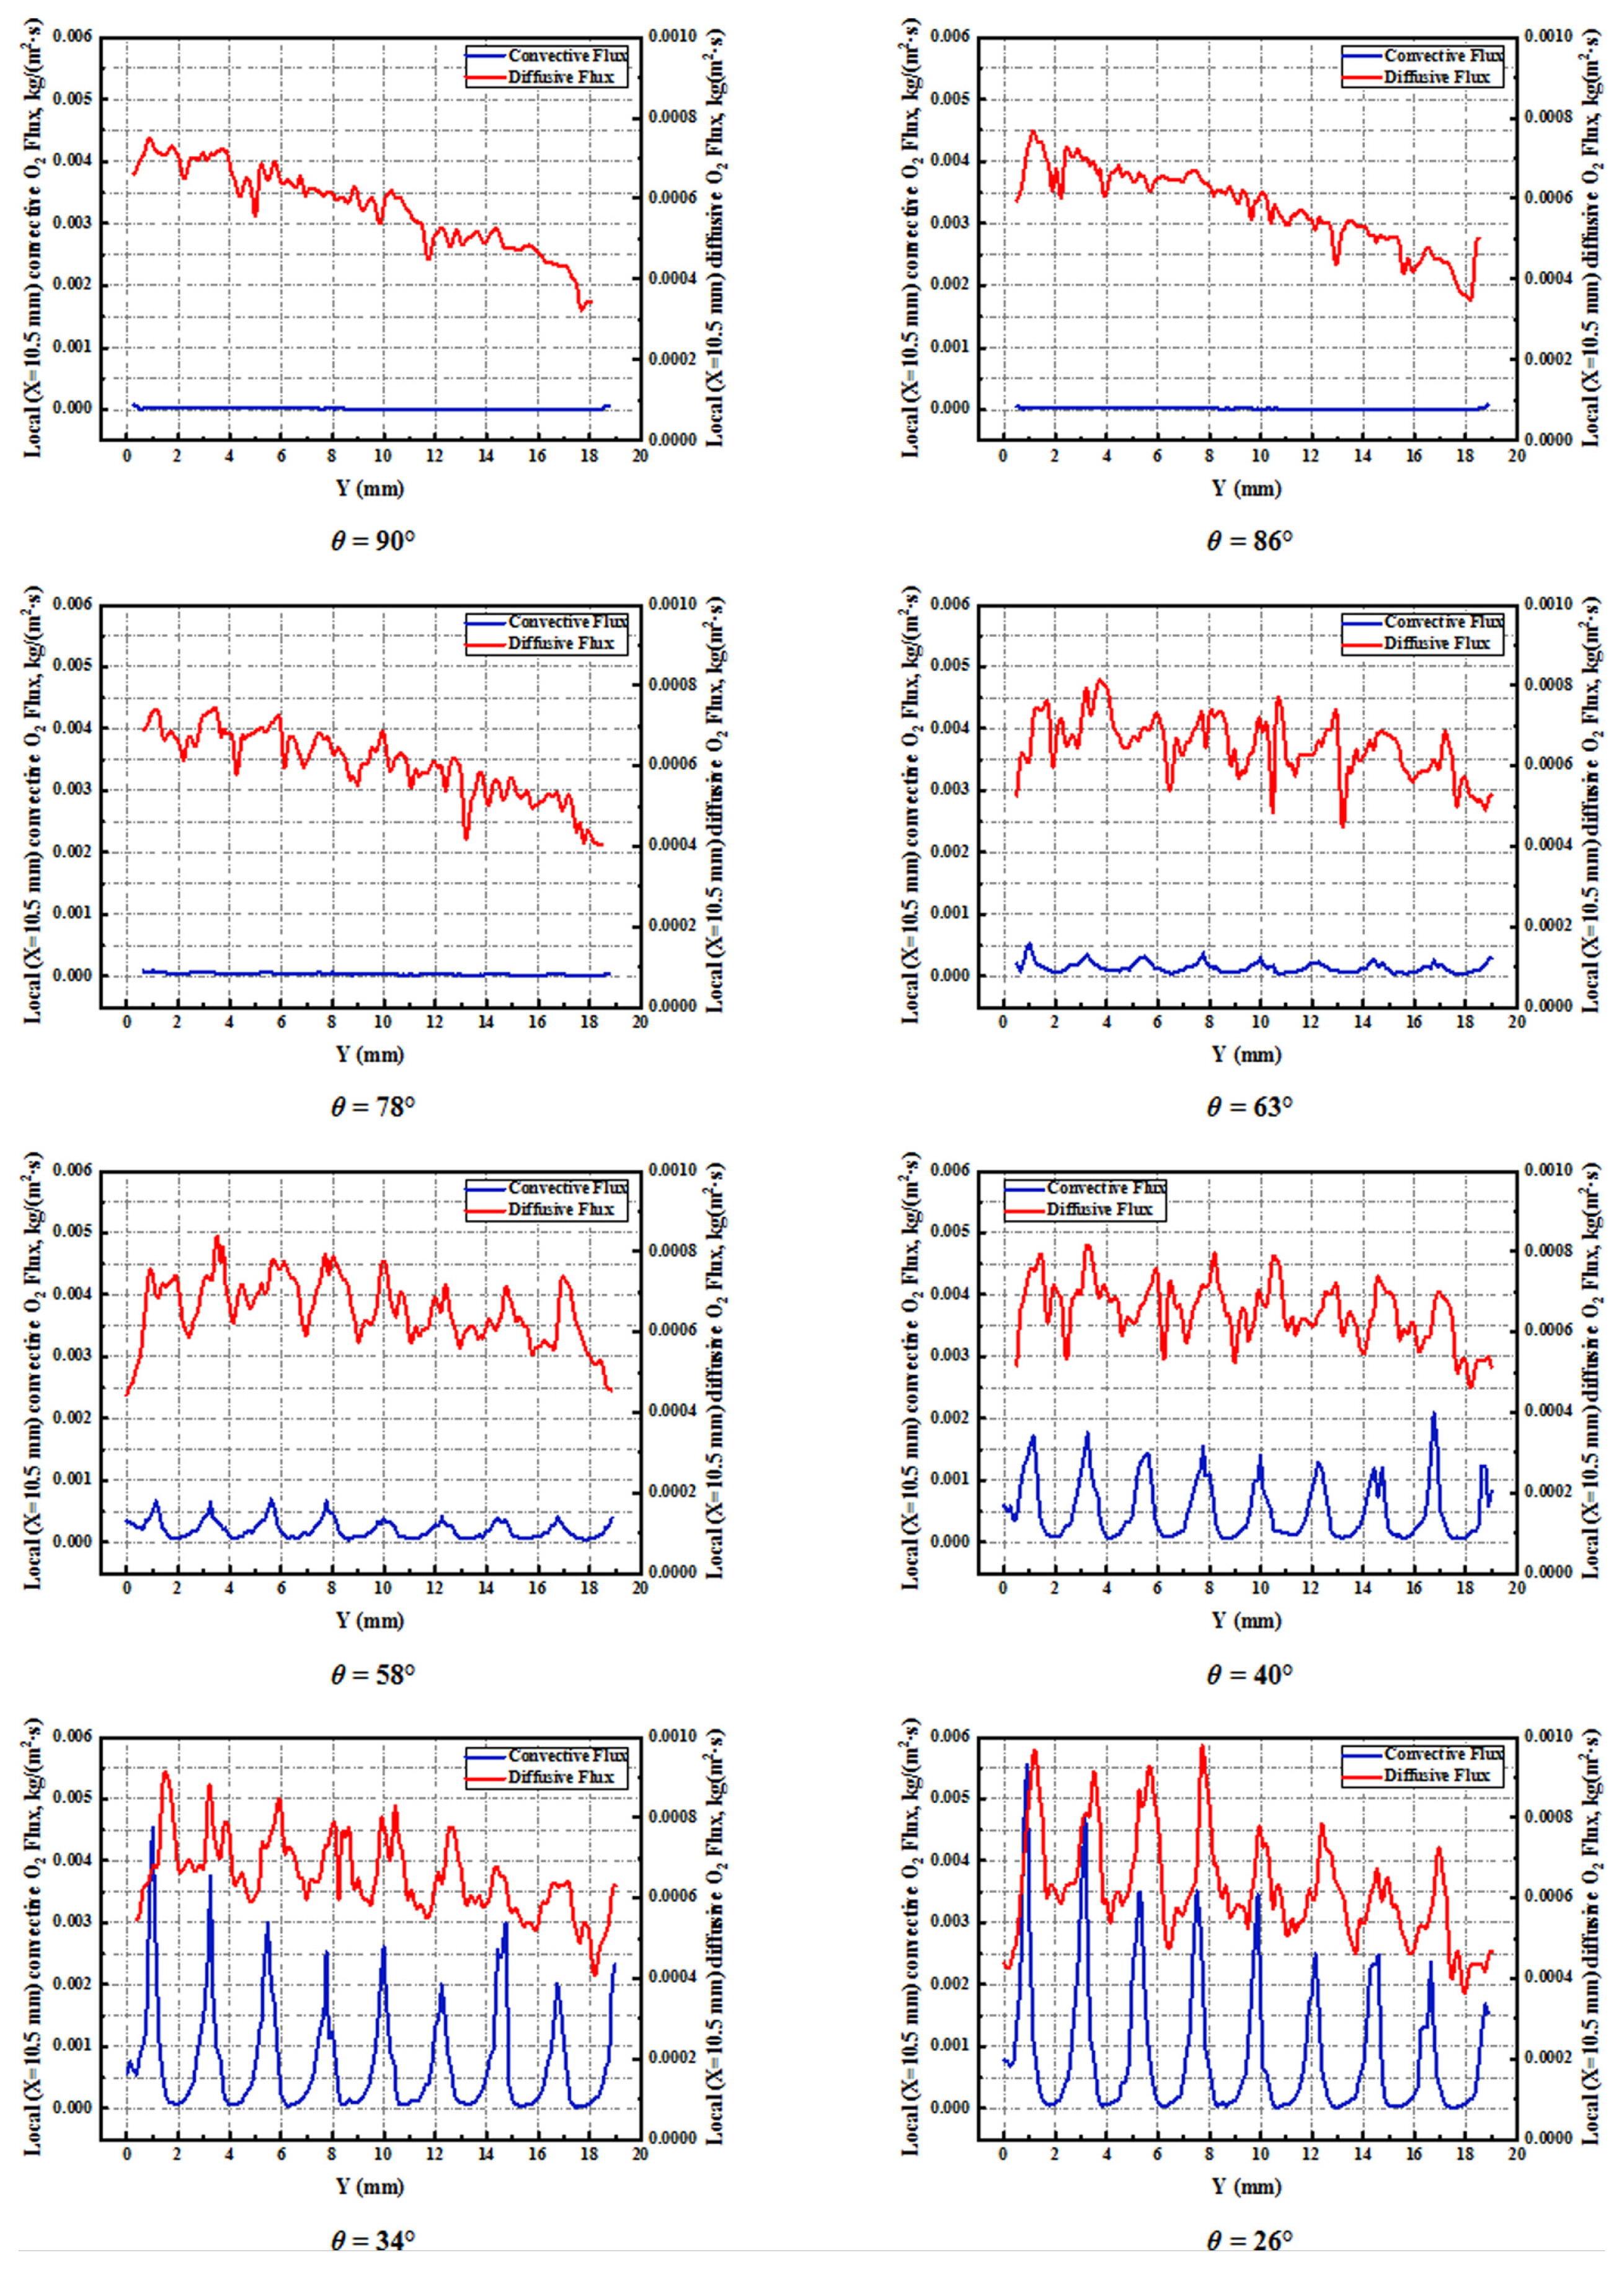
Local (X=10.5 mm) oxygen convection mass flux and diffusion mass flux along the Y-axis direction at the contact surface between the channel and GDL at 0.6 V.
Fig. 15 describes the configuration of oxygen mass fraction in different flow fields. It shows that the problem of low oxygen content in the central region of the PFF is first gradually improved with decreasing cross-sectional trapezoidal base angle, while when the angle is too small, low oxygen content occurs almost throughout the downstream of the flow field, where θ = 34° and θ = 26° are particularly noticeable. In both scenarios, the oxygen mass fraction is significantly enhanced at the upstream baffle of the flow field, revealing the reason for the large fluctuation of the diffusive mass flux above, while the enhanced consumption of the reactants upstream leads to a significant reduction of the downstream oxygen concentration. Combined with the average mass fraction of oxygen shown in Fig. 16, the maximum value is 0.0878 when θ = 58°, indicating that this scheme has the best oxygen distribution uniformity. The value at θ = 26° is only 0.066, which is even 15.4% lower than that of the conventional PFF (θ = 90°). The reduced oxygen uniformity will lead to uneven electrochemical reactions, which will produce local thermal concentration and reduce cell life. Thus, it can be seen that too small angle is undesirable. In summary, although the local mass transfer effect is continuously enhanced by the reduction of angle, the excessive enhancement of the local mass transfer effect will lead to the decrease of the overall oxygen uniformity, which reveals the reason why the PEMFC performance starts to decrease after θ = 58°.
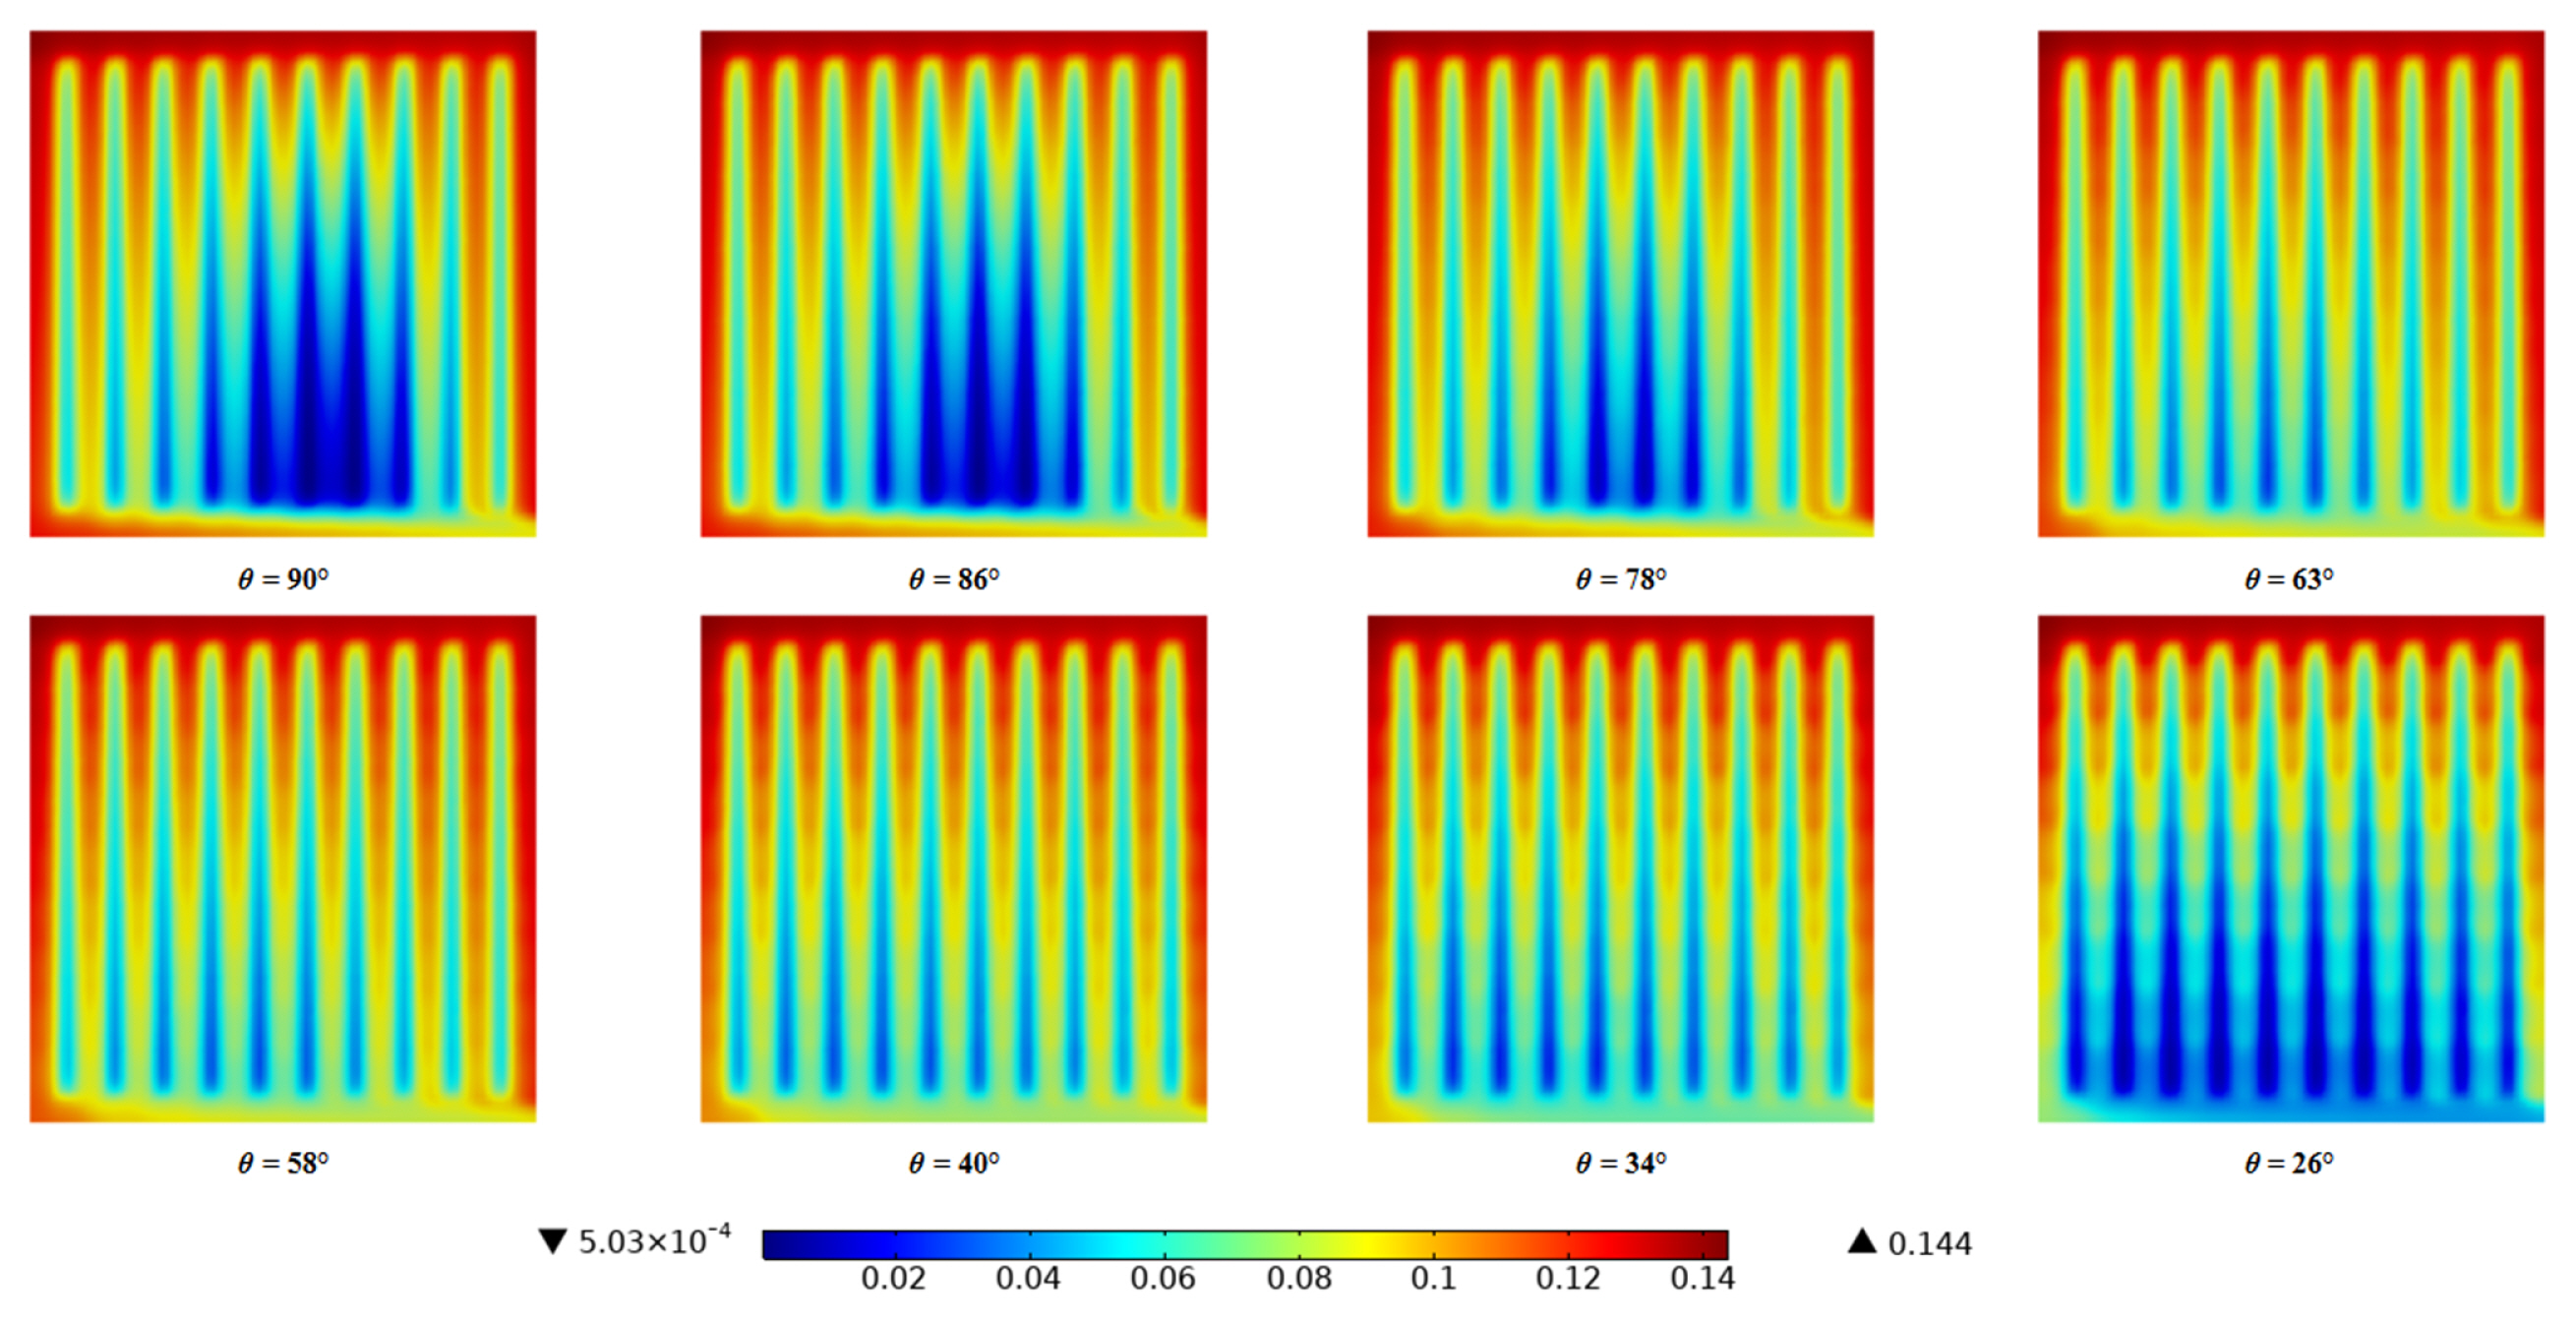
Oxygen mass fraction distribution on the surface of CL/GDL in different flow fields at 0.6 V.
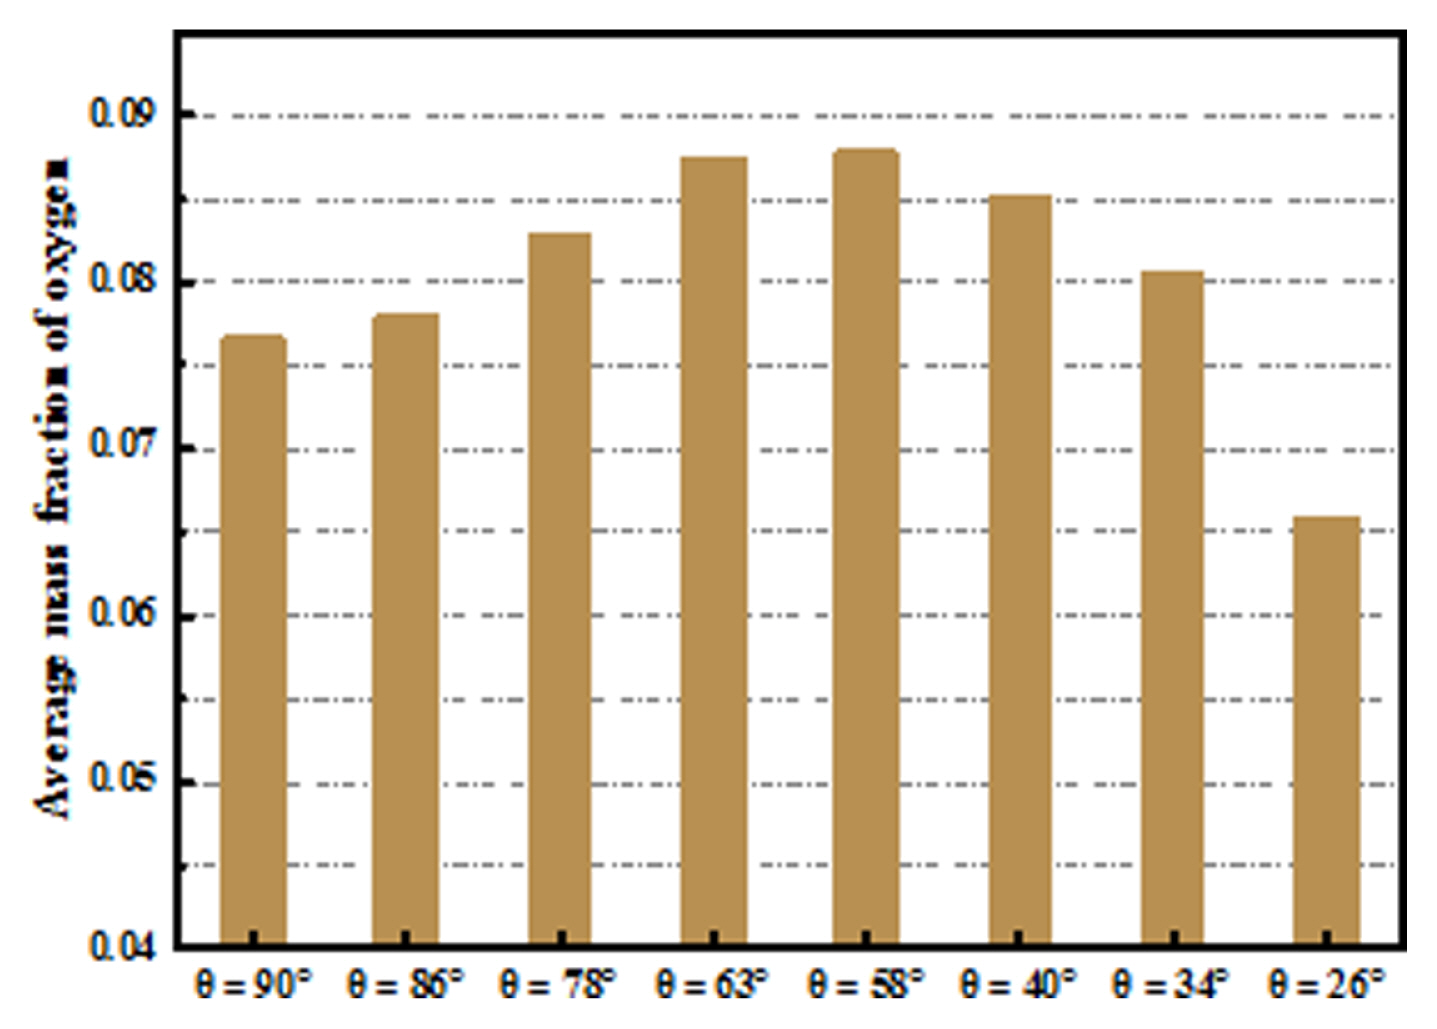
Average mass fraction of oxygen at 0.6 V.
The distribution of water mass fraction in different flow fields is shown in Fig. 17. It can be seen that when θ = 86° and θ = 78°, the perturbation of gas flow by the baffle is small and the drainage performance is not significantly improved. When θ = 63°, θ = 58°, and θ = 40°, the water mass fraction on the surface of CL/GDL is significantly reduced, which is due to the contraction of the channel cross-section caused by the reduction of the baffle height, which not only promotes the convection under the rib but also enhances the purging effect on water, which is beneficial to the transport of reactants in CL and GDL and reduces the concentration polarization at high current density, thus improving the cell performance. When θ = 34° and θ = 26°, the water distribution starts to deteriorate again, which is due to the too-small cross-sectional trapezoidal base angle that makes the channel blockage rate too high and increases the gas flow resistance. The average mass fractions of water in different FF are shown in Fig. 18, with values of 0.429, 0.428, 0.423, 0.418, 0.417, 0.420, 0.425, and 0.44015 for θ = 90° to 26°, respectively. Among them, the lowest average mass fraction is found for θ = 58°, which is 2.8% lower than the conventional parallel flow field (0.429).
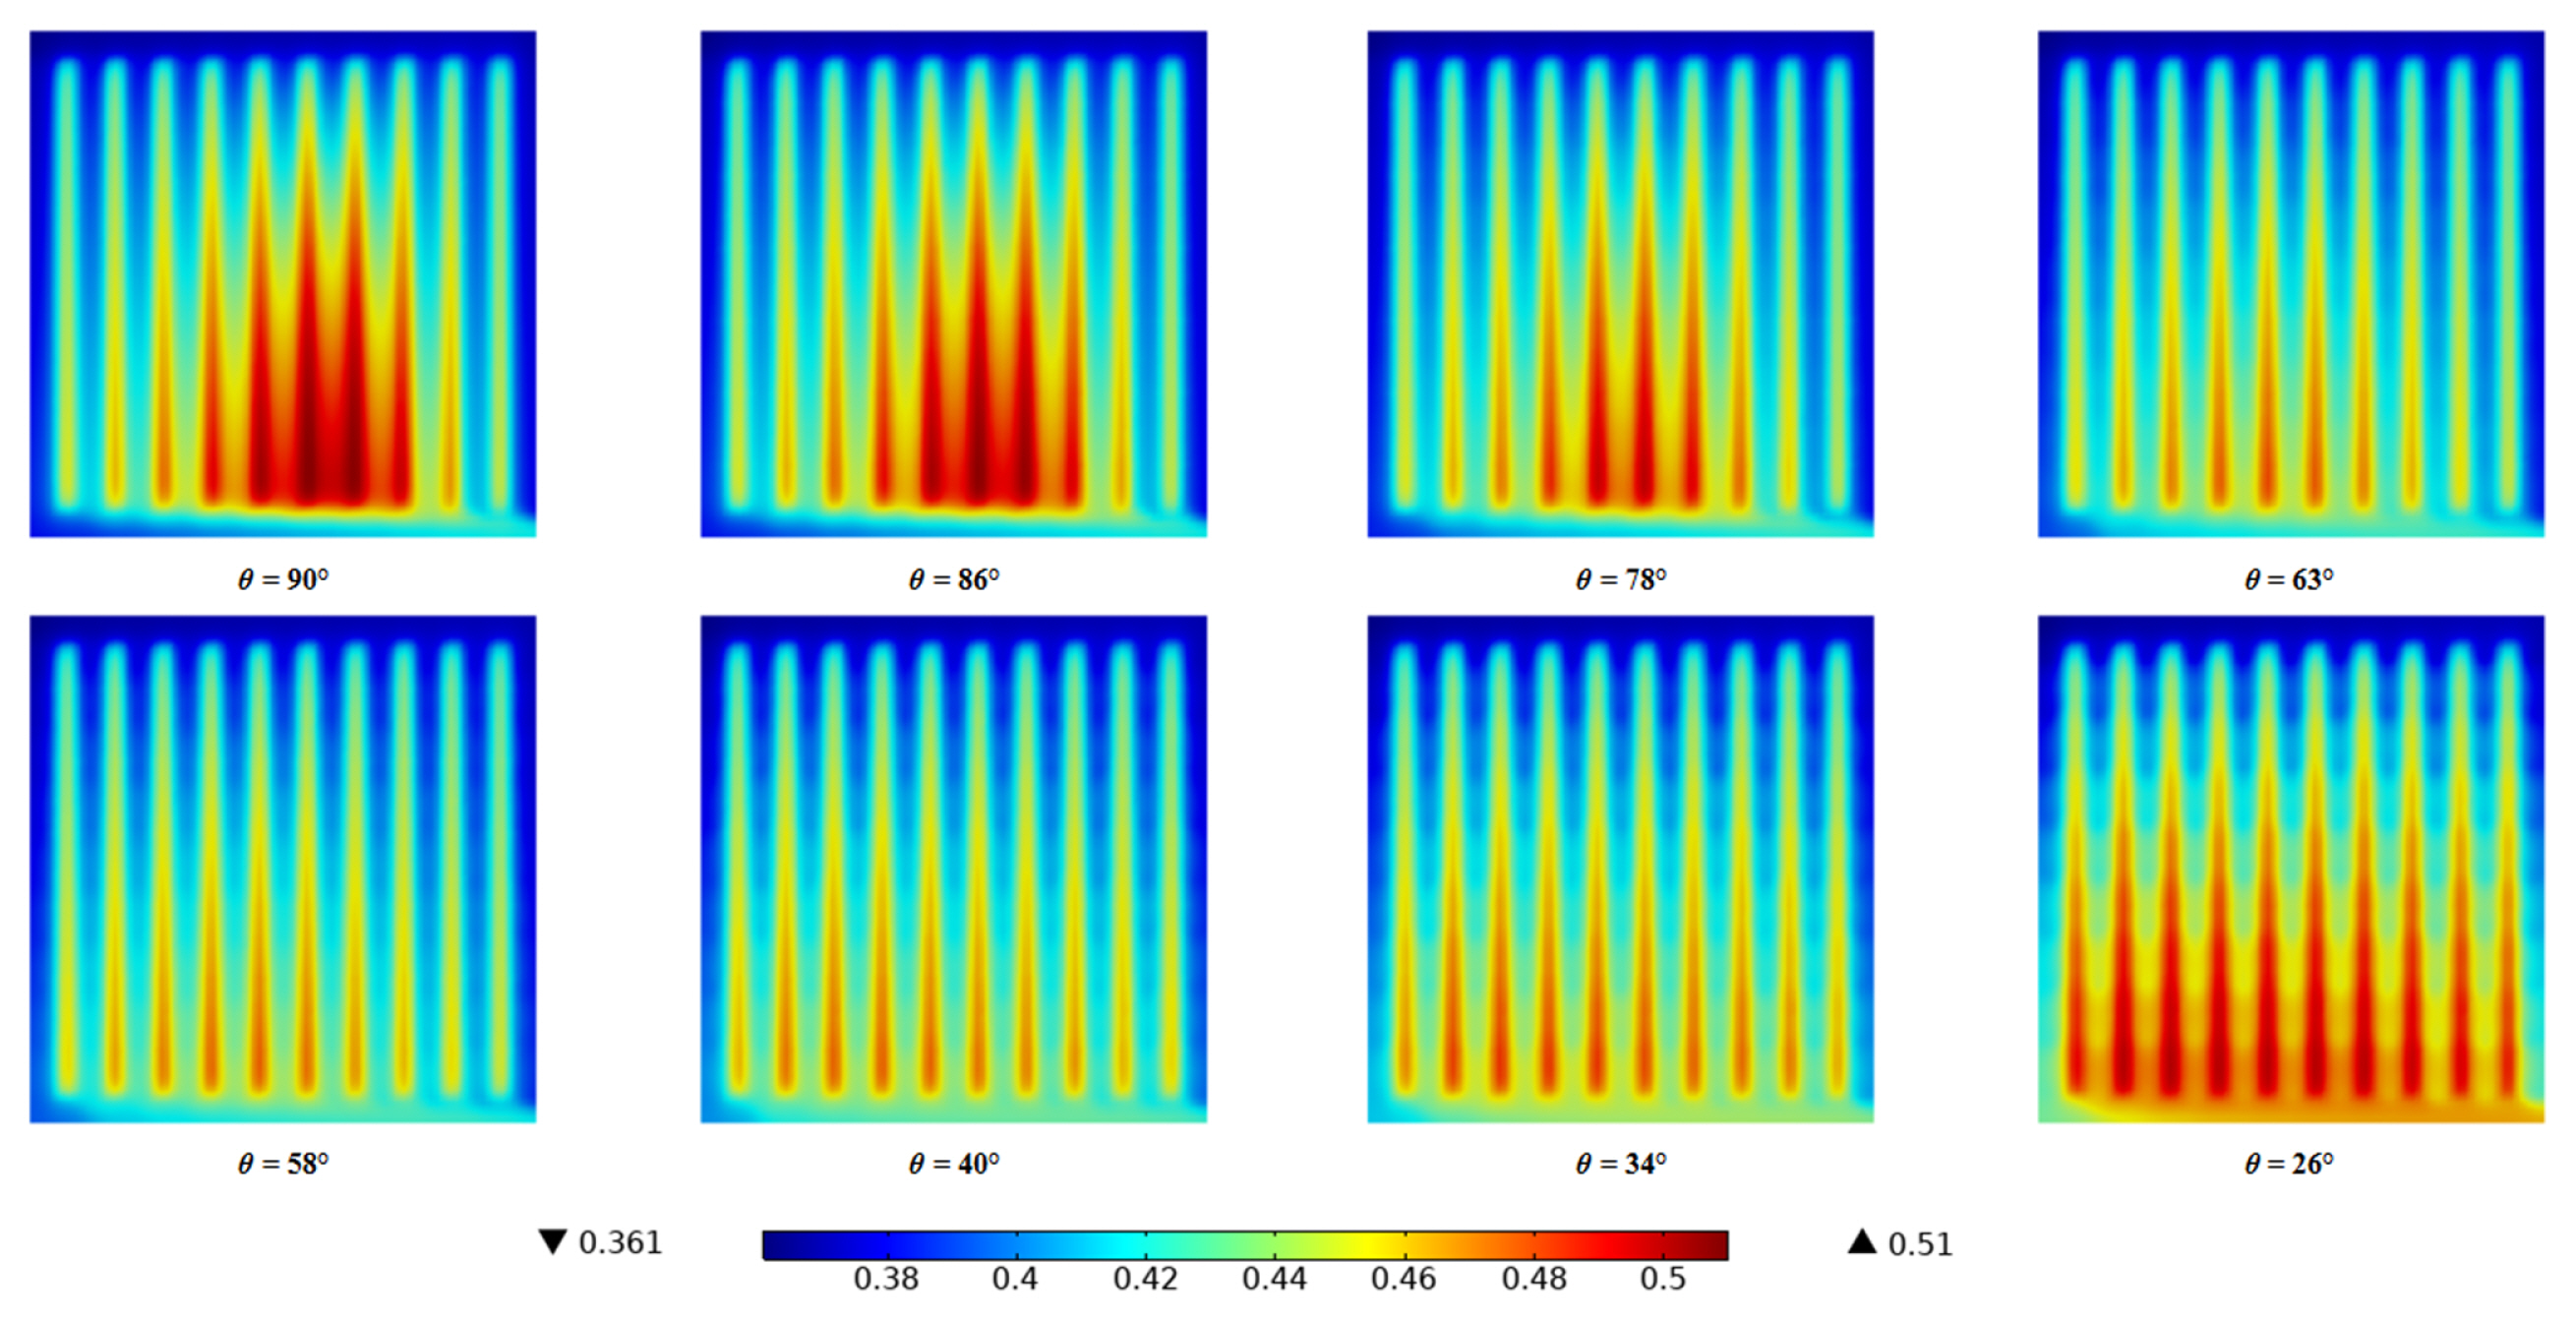
CL/GDL surface water mass fraction distribution at 0.6 V.
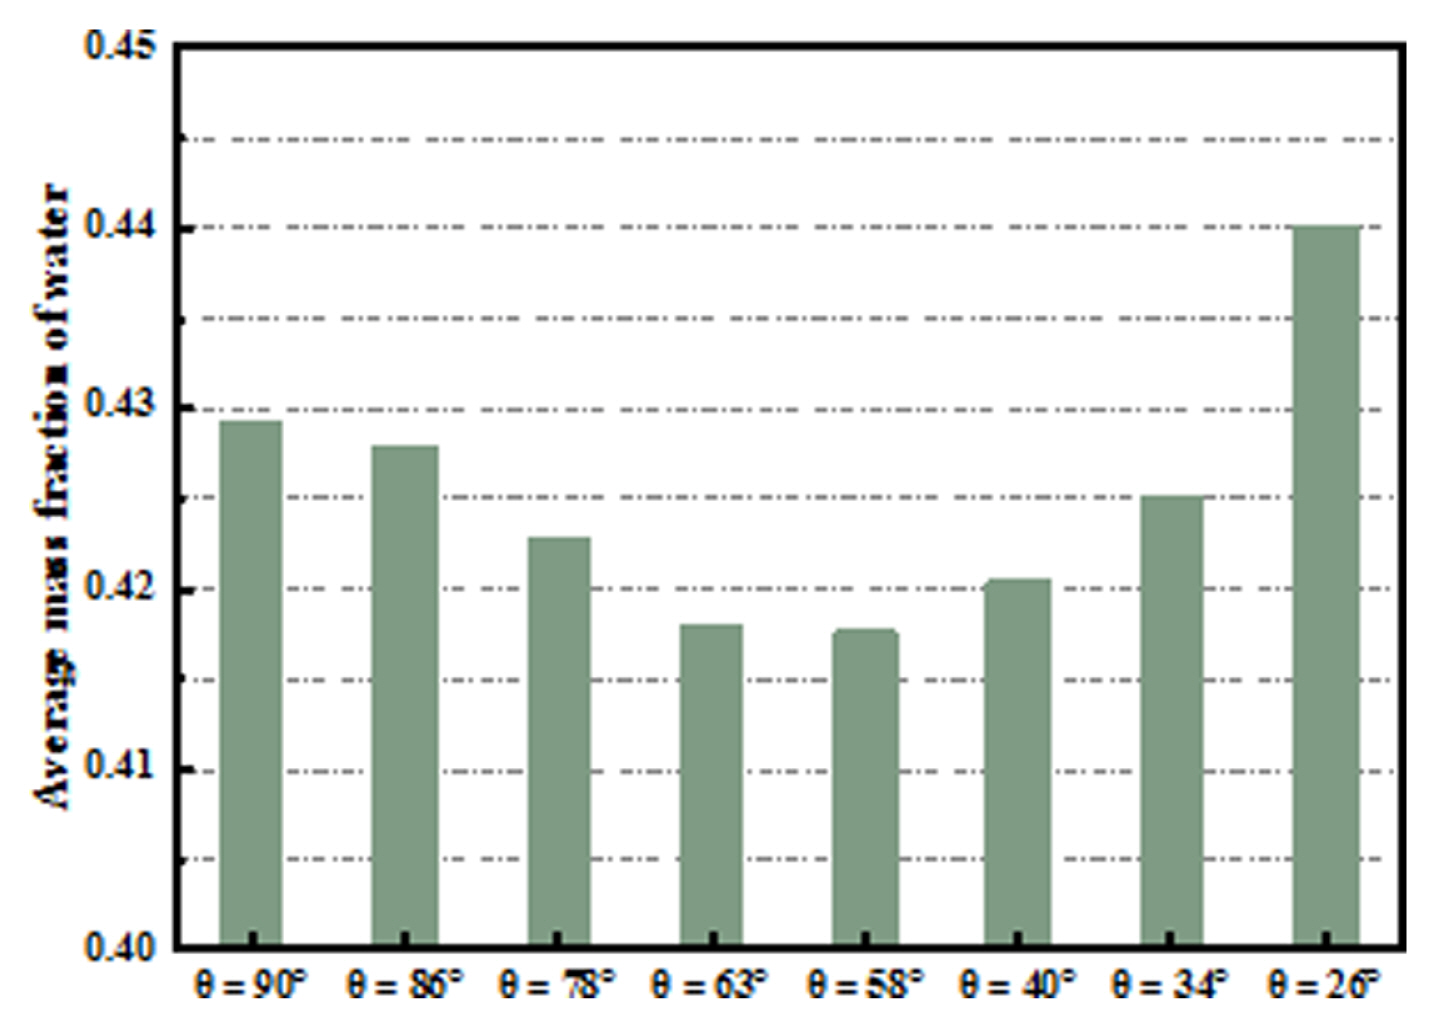
Average mass fraction of water at 0.6 V.
The inlet flow rate is the same for all flow fields in this study. The reduction in the cross-sectional trapezoidal base angle reduces the gas basin volume, increasing the gas pressure in the channel, and further increases the pressure loss because the baffle increases the resistance to gas flow. The larger pressure drop will increase the additional pumping power and reduce the output performance of PEMFC. Fig. 19 shows that the pressure drop in the FF increases linearly as the θ decreases, and the pressure drop at θ = 26° is even twice that of the conventional PFF. After subtracting the additional pumping power, the net power density for θ = 58° is 0.3548 W/cm2 at maximum, which is 10.8% higher than that of the conventional PFF (0.3202 W/cm2).

Pressure drop and net power density.
3.3 Effect of active area and relative humidity
To investigate the effect of area on the PEMFC performance, a model with a larger area (145 mm × 145 mm) is developed in this paper for comparison with the above model. As shown in Fig. 20, the peak current density and ultimate power density of the cell decreased significantly when the pole plate area increased. In addition, the oxygen distribution uniformity and drainage performance of the large active area in Table 3 is worse than those in smaller areas due to the increased number and length of channels by enlarging the pole plate area. The increase in the number of channels deteriorates the gas distribution and the gas flow uniformity; the extension of the channels increases the distance of water diffusion in the flow field and makes the drainage more difficult, and the accumulation of water also hinders the gas transfer, forming a vicious circle, and the increase of the gas transfer distance enhances the pressure drop significantly. Therefore, the enlargement of the pole plate area will also enlarge the disadvantages of the flow field, reducing the performance of the PEMFC.
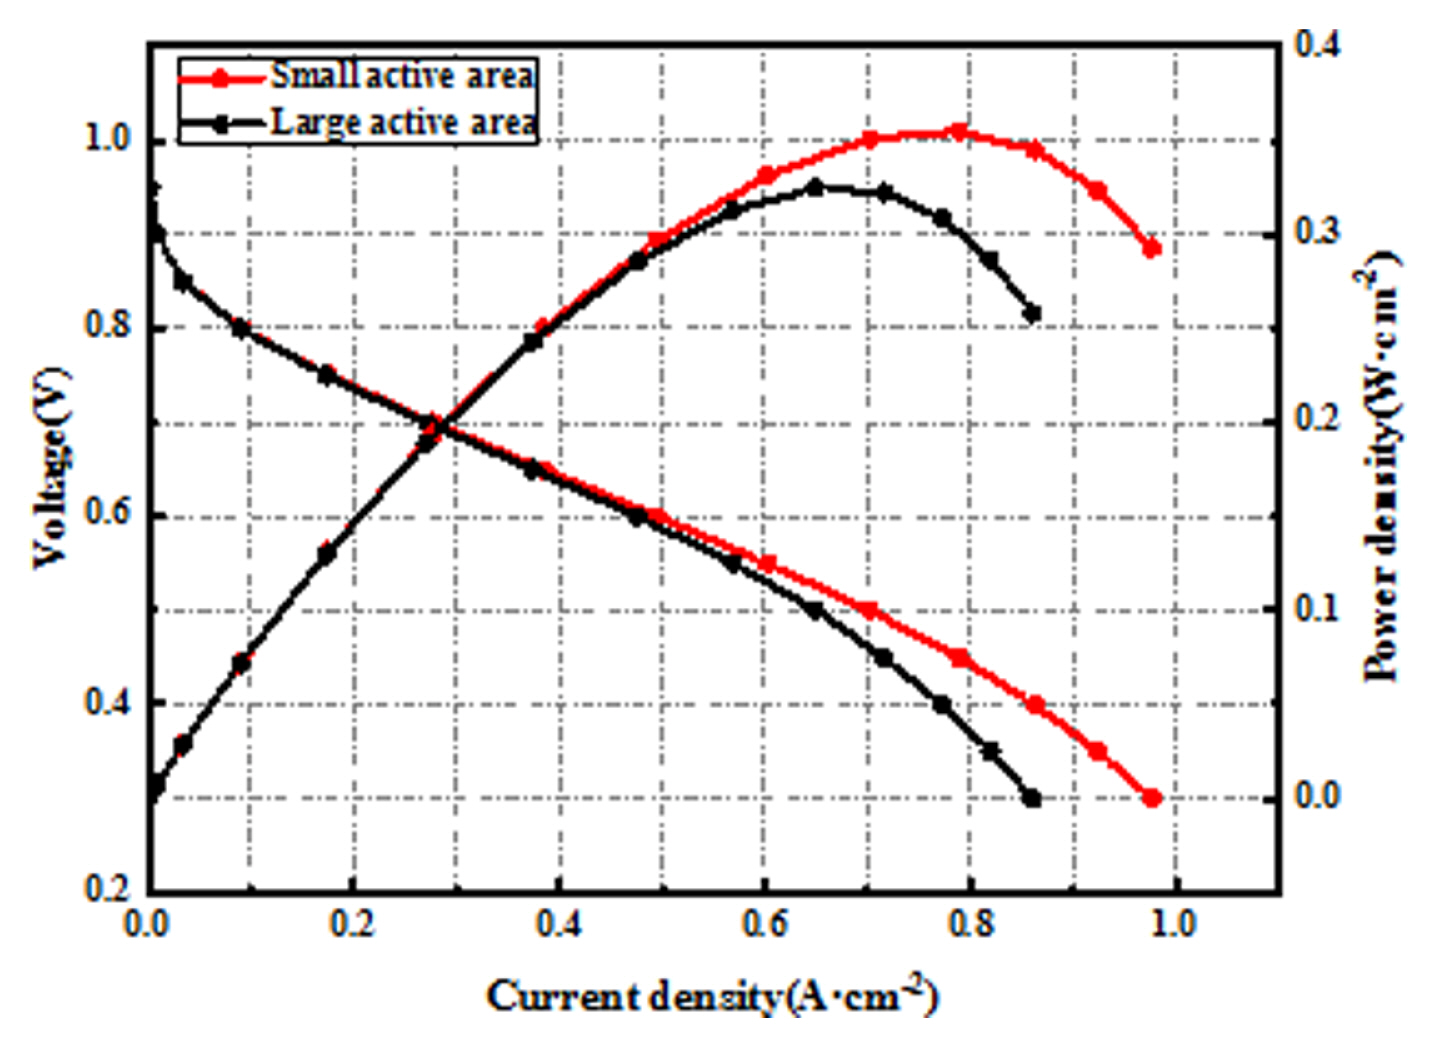
Comparison of the performance of different active areas.
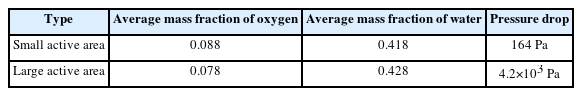
Performance differences by active area at 0.6 V
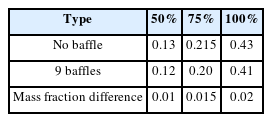
Relative humidity is also an important factor affecting the performance of the PEMFC, because as the relative humidity decreases, the conductivity of the protons decreases, leading to increased ohmic polarization [33,34]. As shown in Fig. 21, at low relative humidity, lower proton conductivity makes the ohmic polarization more pronounced, leading to a decrease in current density, indicating that high relative humidity is beneficial for improving the performance of the PEMFC. Due to the lower mass fraction of water in the gas composition passed into the flow field at low humidity, it can be seen from Fig. 22 that the mass fraction of water on the surface of the fuel cell GDL/CL at lower humidity is lower than that at high humidity conditions. Table 4 shows the difference between the mass fraction of water in the conventional and 3D baffle flow fields at three different humidity levels. It can be seen that more water can be promoted to be discharged out of the flow field in the 3D baffle flow field at high humidity, while it is weakened at low humidity. Flooding is more severe at high humidity and the drainage effect of the 3D baffle is more significant.
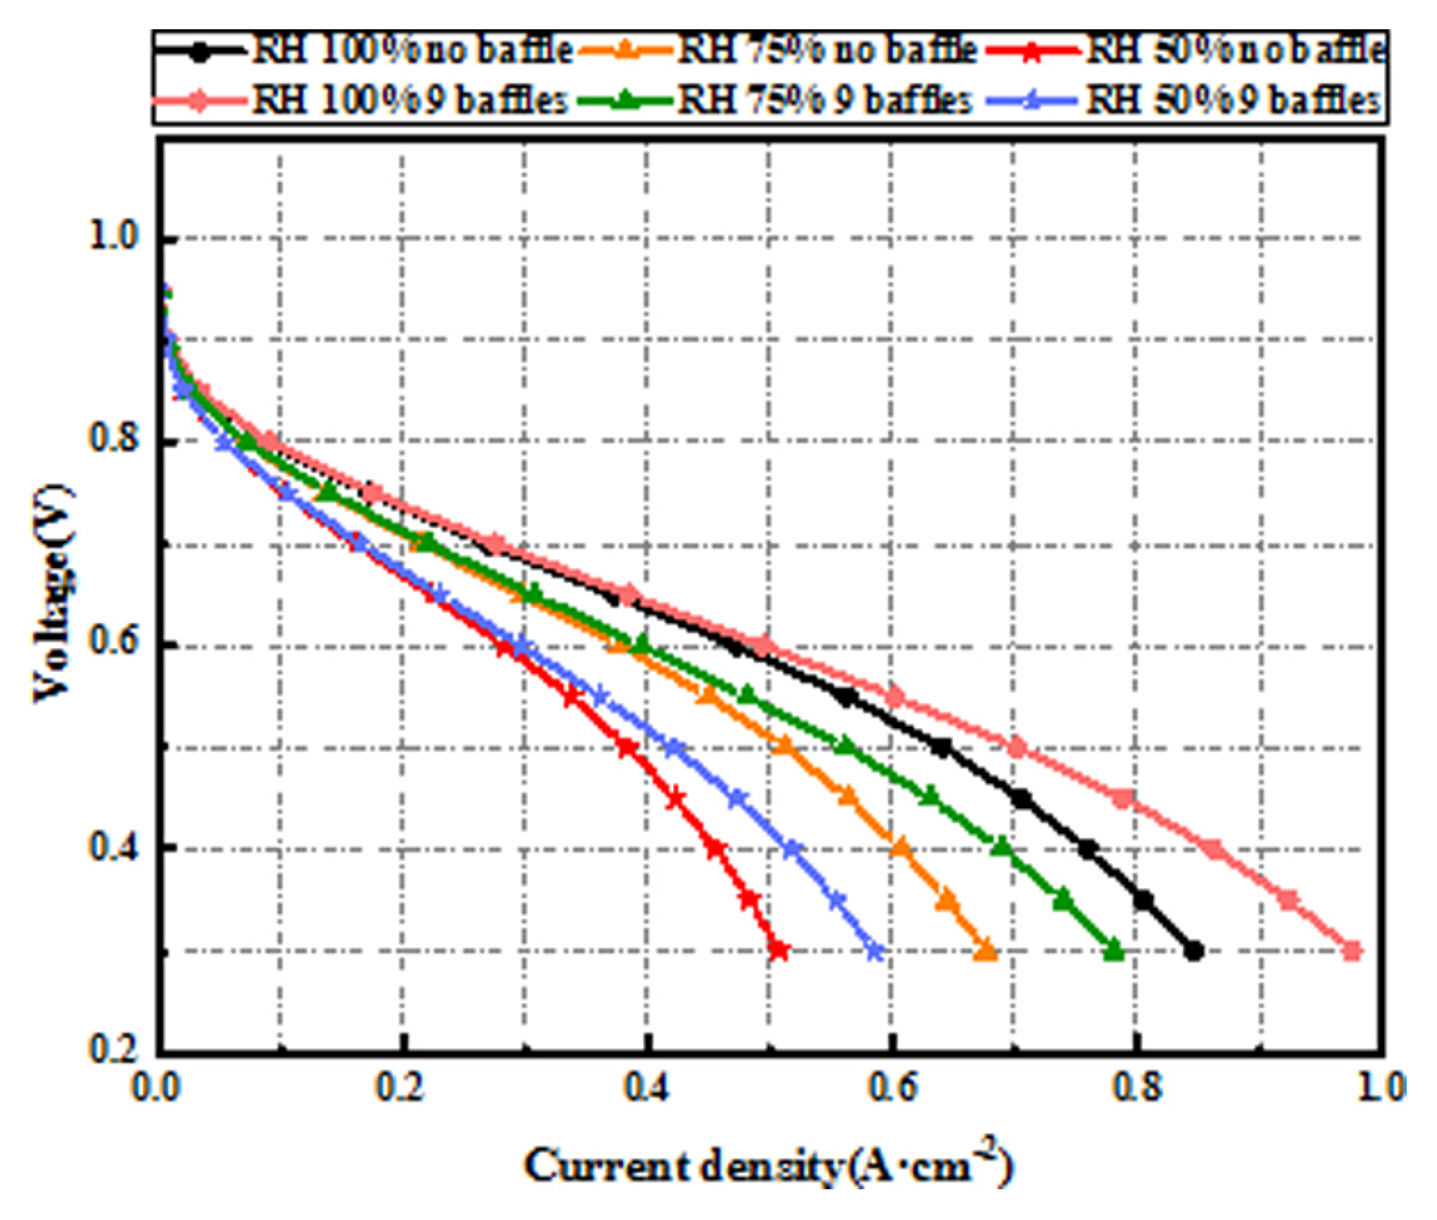
Comparison of flow field performance with and without baffles at three different humidity levels.

Water distribution in the flow field at different humidity levels at 0.6V.
Average mass fraction of water with different humidity at 0.6 V
4. Conclusions
In this study, a new 3D baffle is designed and combined with the PFF, the number of baffles (BN) and cross-sectional trapezoidal base angle (θ) are optimized for the study, and the influence of baffles on the mass transfer characteristics of the parallel flow field is analyzed by numerical simulation, aiming to find the solution with the greatest improvement on the performance, the main conclusions are as follows:
The increase of baffles can increase the performance of fuel cell, and the improvement gradually tends to level off with the increase of the number of baffles, considering the influence of processing difficulty, the optimal number of baffles in this study is 9, and the peak power density is improved by 9.1%, and the oxygen uniformity and drainage capacity are improved by 11.8% and 2.25%, respectively. The effect of cross-sectional trapezoidal base angle is even more significant, as PEMFC performance first increases with decreasing angle, and then the channel blockage rate becomes too large due to small angle, which not only increases the pressure drop substantially but also weakens the PEMFC performance. The best performance is achieved when BN = 9 and θ = 58°, with a net output power improvement of 10.8%.
Both increasing the number of baffles and decreasing the cross-section angle can enhance convective mass transfer, especially when θ is small the oxygen convective mass flux at the baffle is greatly enhanced, and the local oxygen concentration gradient is also enhanced to promote diffusive mass transfer. However, the excessive enhancement of the local mass transfer effect will lead to a decrease in overall oxygen uniformity and reduce cell performance.
Increasing the area of the pole plate reduces the cell performance to some extent because the number and length of flow channels increase with the increase in area, which can lead to insufficient local channel supply and reduce the uniformity of oxygen distribution. The baffle plate is more effective in promoting drainage under high humidity conditions.
Notes
The authors declare no competing interests.
Fund
This study was supported by the major scientific and technological innovation project of Shandong Province (2018cxgc0803).