Activated Carbon-Embedded Reduced Graphene Oxide Electrodes for Capacitive Desalination
Article information
Abstract
Capacitive deionization of saline water is one of the most promising water purification technologies due to its high energy efficiency and cost-effectiveness. This study synthesizes porous carbon composites composed of reduced graphene oxide (rGO) and activated carbon (AC) with various rGO/AC ratios using a facile chemical method. Surface characterization of the rGO/AC composites shows a successful chemical reduction of GO to rGO and incorporation of AC into rGO. The optimized rGO/AC composite electrode exhibits a specific capacitance of ~243 F g−1 in a 1 M NaCl solution. The galvanostatic charging-discharging test shows excellent reversible cycles, with a slight shortening in the cycle time from the ~260th to the 530th cycle. Various monovalent sodium salts (NaF, NaCl, NaBr, and NaI) and chloride salts (LiCl, NaCl, KCl, and CsCl) are deionized with the rGO/AC electrode pairs at a cell voltage of 1.3 V. Among them, NaI shows the highest specific adsorption capacity of ~22.2 mg g−1. Detailed surface characterization and electrochemical analyses are conducted.
1. Introduction
The water demand is increasing globally with the rising world population and urbanization, as water is the core of socioeconomic development. Freshwater comprises only 2.5% of the total water distribution on Earth, while 96.5% of the water supply is seawater and brackish water [1,2]. The United Nations estimates that water shortage affects one-third of the global population [3]. Intensive research and development of processes for brackish water and seawater extraction and treatment are ongoing. Among them, electrodialysis [4], multi-stage flash [5], multi-effect distillation [6], and reverse osmosis [7] are methods generally used for ion removal from seawater and brine water. Renewable energy-coupled hybrid desalination has been reported to be efficient for the desalination of brackish water and seawater [8–10]. Reverse osmosis has been tested for large-scale applications [11] but suffers from high costs and large amounts of energy consumption. Other desalination technologies are limited because of the complex and expensive infrastructure required for high energy consumption and maintenance [12].
Capacitive deionization (CDI) is a promising desalination technique due to its low energy consumption, simple operation, low cost, and facile infrastructure [13,14]. Its operation mechanism is based on the electrical double-layer capacitance, where the ions of the solution are adsorbed on the electrode surface after applying a voltage (generally lower than 2 V), and vice versa for regeneration [15]. Therefore, the synthesis of high-efficiency electrodes for adsorption-desorption capability is critical. Theories and experimental results prove that porous carbonaceous materials are promising CDI electrodes as they have large surface areas and excellent capacitive behaviors [16]. There are many carbon-based materials such as activated carbon [17], carbon aerogel [18], mesoporous carbons [19], carbon nanotubes [20,21], and graphene materials [22].
Among them, activated carbon (AC) has been most widely used particularly due to its large surface area, low cost, and easy synthesis. Nevertheless, it suffers from hydrophobic surface and low electrical conductivity [16]. To overcome these challenges, the AC surface is modified with oxidizing agents or combined with other materials to produce hybrid or composite electrodes with high performance [23]. Reduced graphene oxide (rGO) with layers of graphene sheets has also been considered as an alternative CDI electrode [24,25], as it possesses unique properties, such as significant stability and high electrical conductivity [26]. However, graphene sheets easily aggregate during the reduction process, which increases hydrophobicity [27] and reduces the surface area [28].
The insertion of activated carbon as a spacer material onto the rGO surface can be effective in increasing the interlayer distance. This should partly address the aforementioned problems while increasing the surface area and conductivity of the electrodes. In this work, we propose a series of rGO/AC composites as CDI materials. The electrochemical properties of the commercial AC and the synthesized rGO/AC composites were analyzed by cyclic voltammetry and galvanostatic charge-discharge measurements. In addition, the electrosorption performance was examined for desalination applications, and their desalination capacities were compared. The insertion of AC into rGO provides better performance than pristine rGO and AC.
2. Experimental
2.1 Synthesis and characterization of materials
Hummer’s method [29] was slightly modified to synthesize rGO. Various amounts of graphite powder (1.5 g, 95%, Sigma-Aldrich) were added to a mixture of concentrated H2SO4 (99.999%, Sigma-Aldrich) and H3PO4 (85%, Daejung) in a 9:1 ratio under gentle stirring at room temperature. KMnO4 (9 g, 99.0%, Sigma-Aldrich) was then added carefully to the mixture and stirred for 30 min. The mixture was refluxed at 60°C for 12 h. After cooling the mixture to room temperature, ice and concentrated H2O2 (30–36%, Junsei) were sequentially added to the solution. The as-obtained yellow product was centrifuged and the supernatant was decanted. The solid material was then washed in succession with deionized water (18 MΩ cm) once, HCl (35–37%, Junsei) once, deionized water several times, and ethanol (99.9%, Junsei) once. The final product (GO) was dried in a vacuum at 60°C for 24 h. The GO powder was ground in a mortar [30]. For the synthesis of the rGO/AC composites, appropriate amounts of GO and AC were separately dispersed in deionized water. The two dispersed solutions were then mixed, and suitable amounts of hydrazine (98%, Sigma-Aldrich) were added to the solution. The mixture was stirred at 80°C for 24 h. The solution was then centrifuged at 8,000 rpm for 10 min and washed several times with deionized water. Finally, the separated powder of the composite was dried in an oven at 60°C for 24 h. Scheme 1 illustrates the simplified synthesis procedure. The as-synthesized rGO/AC composite was mixed with carbon black (Sigma-Aldrich) and polytetrafluoroethylene (PTFE, Sigma-Aldrich) at a weight ratio of 8:1:1. The slurry was coated onto graphite paper and dried in an oven for 24 h.
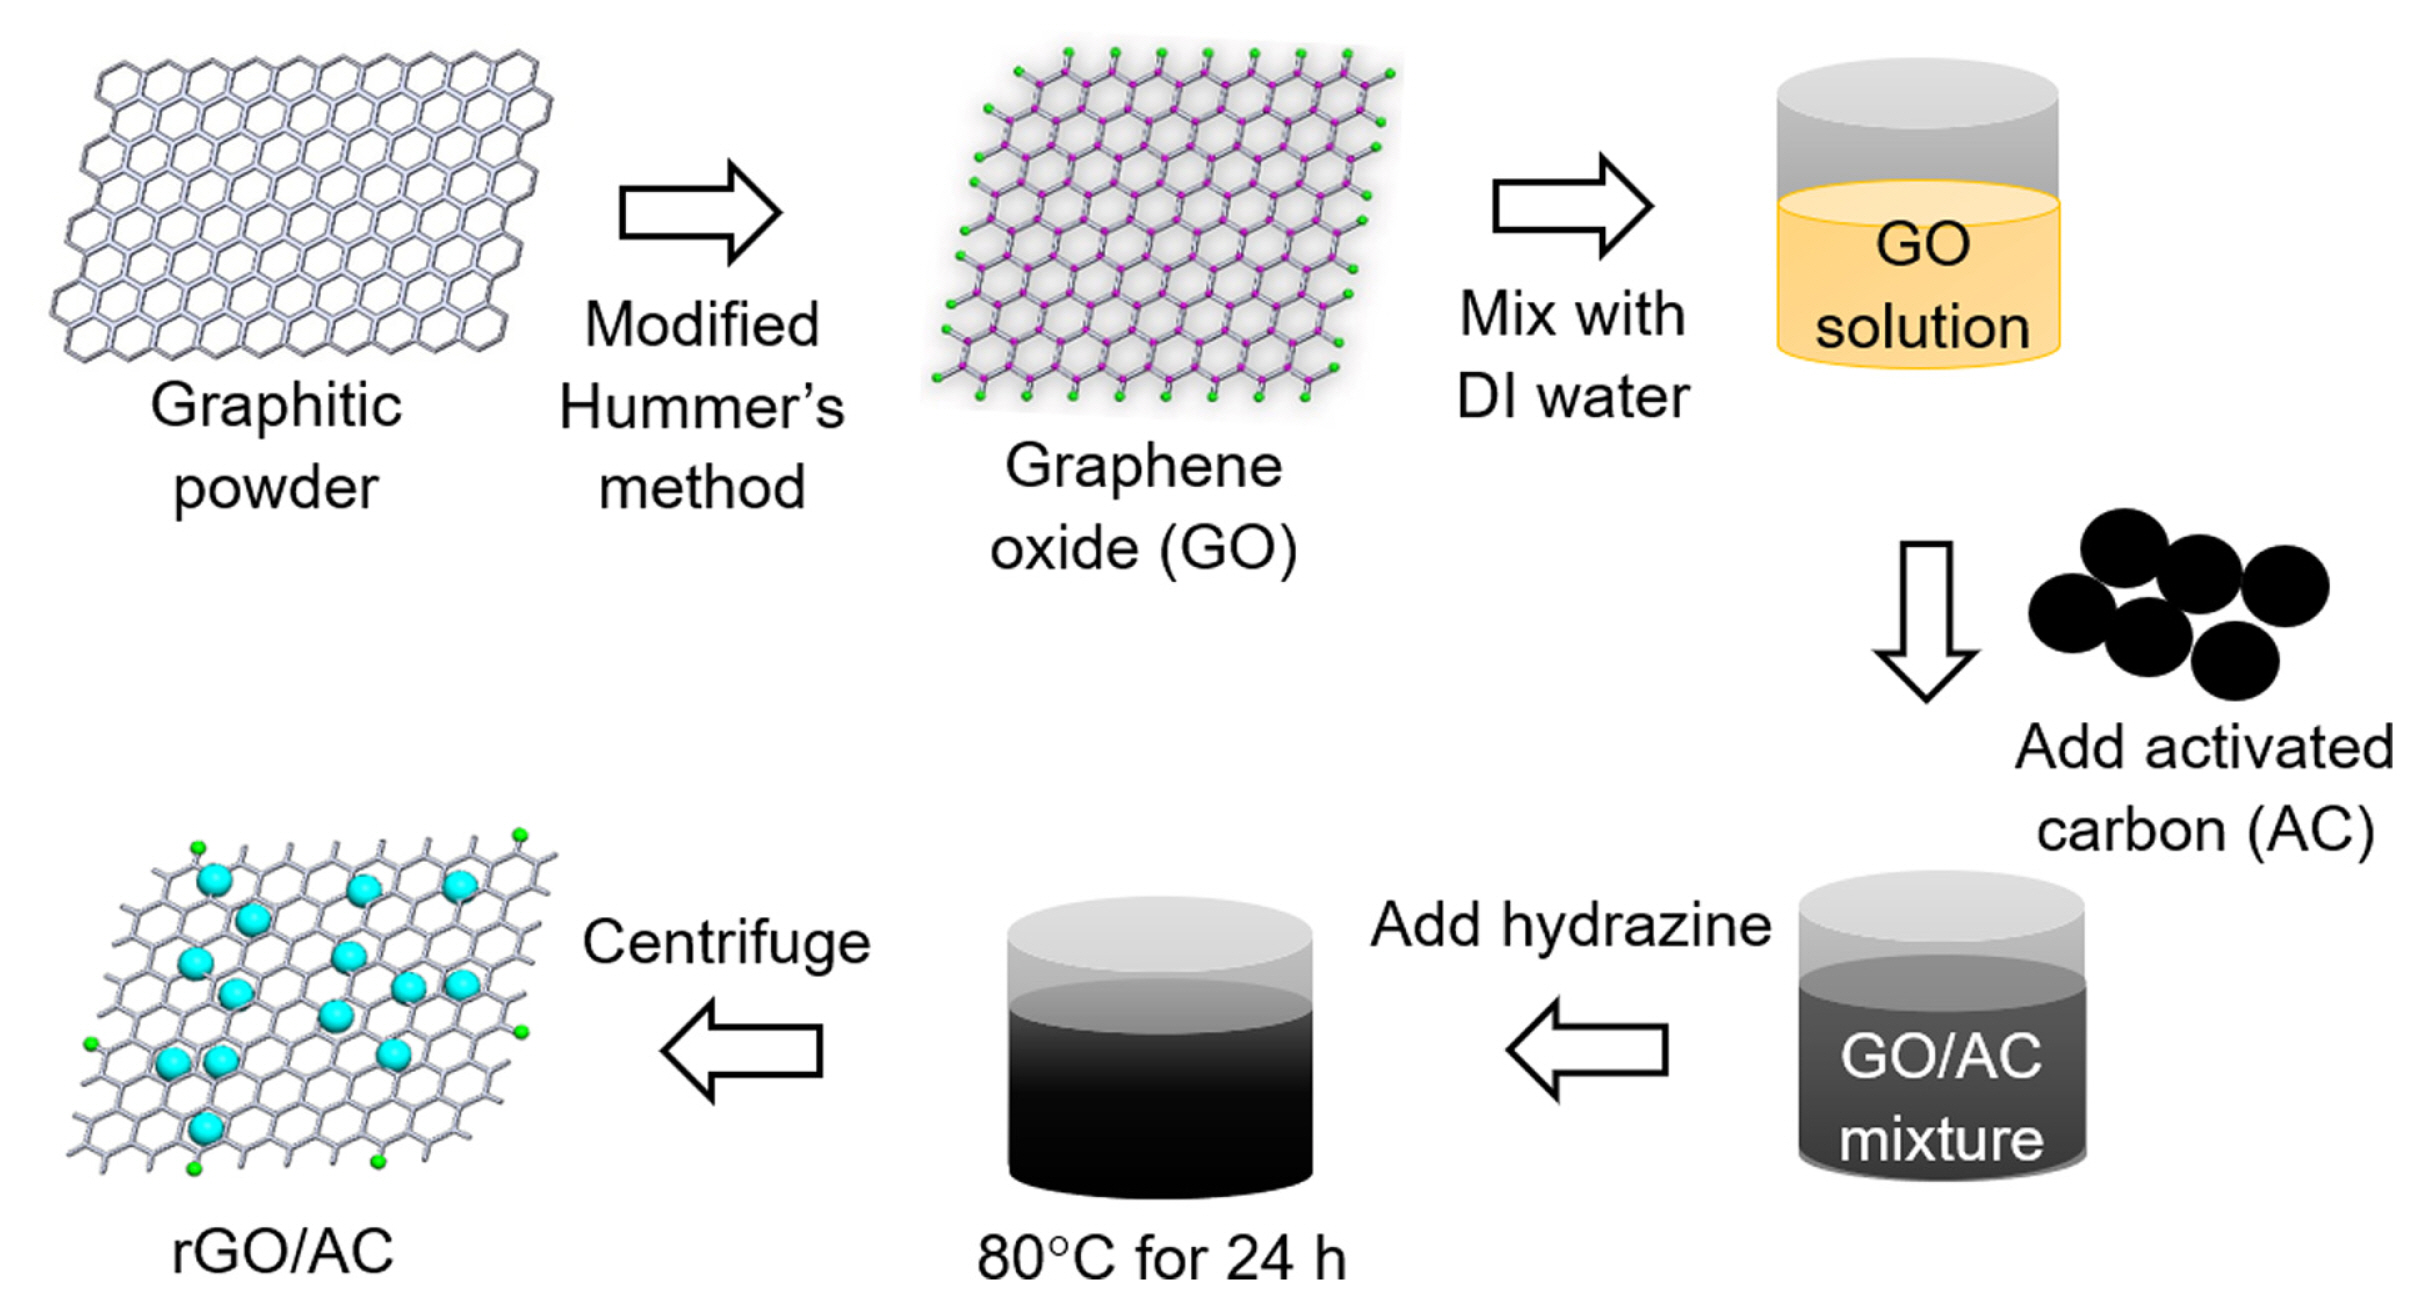
A synthetic process of rGO/AC composites.
The morphologies of the samples were analyzed using field-emission scanning electron microscopy (FE-SEM; Hitachi SU8230). The Brunauer-Emmett-Teller (BET) specific surface area and porosity of the samples were evaluated based on nitrogen adsorption isotherms using Quantachrome (Quadrasorb evo). X-ray photoelectron spectroscopy (XPS, Thermo Fisher Scientific) with Al-kα radiation was employed to evaluate the binding states of the component elements. Raman spectroscopy (Renishaw, inVia reflex) was also performed using a 532 nm-excitation laser.
2.2 Electrochemical analysis
Cyclic voltammetry was conducted using a three-electrode system in aqueous NaCl solutions (0.1–1 M) at different scan rates with the as-synthesized electrodes (working electrode), saturated calomel electrode (SCE, reference electrode), and Pt wire (counter electrode) at an operating potential window from −1.0 to 0 V vs. SCE using a potentiostat (Ivium). The specific capacitance (Cs) was estimated from the cyclic voltammograms by the following equation:
where A is the integrated area in the cyclic voltammograms, v is the scan rate (mV s−1), ΔV is the potential range of the voltammograms (V), and m is the total mass of the active material (g). The galvanostatic charge/discharge tests were performed in 1 M NaCl (58.44 g L−1) solution, using the same electrode pair system in a voltage range of 0 to 1.0 V with specific currents (Is) of 0.1 to 0.5 A g−1. CDI tests were performed by setting up a conical cell with the same electrode pairs. The active materials were attached to current collectors (Cu plates), which were connected to a potentiostat. The electrode size was 3 × 2.5 cm and the feed solution (18 mL) was NaCl at 200 and 500 mg L−1 (approximately 3.42 and 8.56 mM, respectively). The deionization behavior of NaCl was further compared with that of other chloride salts with different cations (LiCl, KCl, and CsCl) and sodium salts with different anions (NaF, NaBr, and NaI) at 500 mg L−1. To monitor the time-profiled changes in ionic conductivity, a conductivity meter (Mettler Toledo) was inserted into the cell, and the conductivity values were converted to salt concentrations using calibration curves. The deionization proceeded at a constant cell voltage (Ecell of 1.1 or 1.3 V) for 40 min and stopped for desorption. The salt adsorption capacity (SAC) was estimated using the following equation:
where Ci and Cf are the initial and final concentrations (mg L−1), respectively, V is the volume of the NaCl solution (mL), and m is the total mass (g) of the loaded carbon materials. The salt adsorption rate (SAR) was obtained by dividing SAC by desalination time.
3. Results and Discussion
3.1 Surface morphology and structure characterization
SEM analyses of the commercial AC and as-synthesized GO, rGO, and rGO/AC samples were conducted to examine their surface morphologies (Fig. 1). AC displayed an irregular solid structure, and GO exhibited a randomly aggregated but well-interconnected structure. The rGO sample had a wrinkled surface with a uniform shape, due to the removal of oxygen-containing functional groups from GO. In contrast, the rGO/AC composite displayed a dense morphology with a sandwich structure, where AC appeared to be inserted into the graphene sheets. Such a configuration can create extra spaces and contribute to the accommodation of ions during electrosorption.
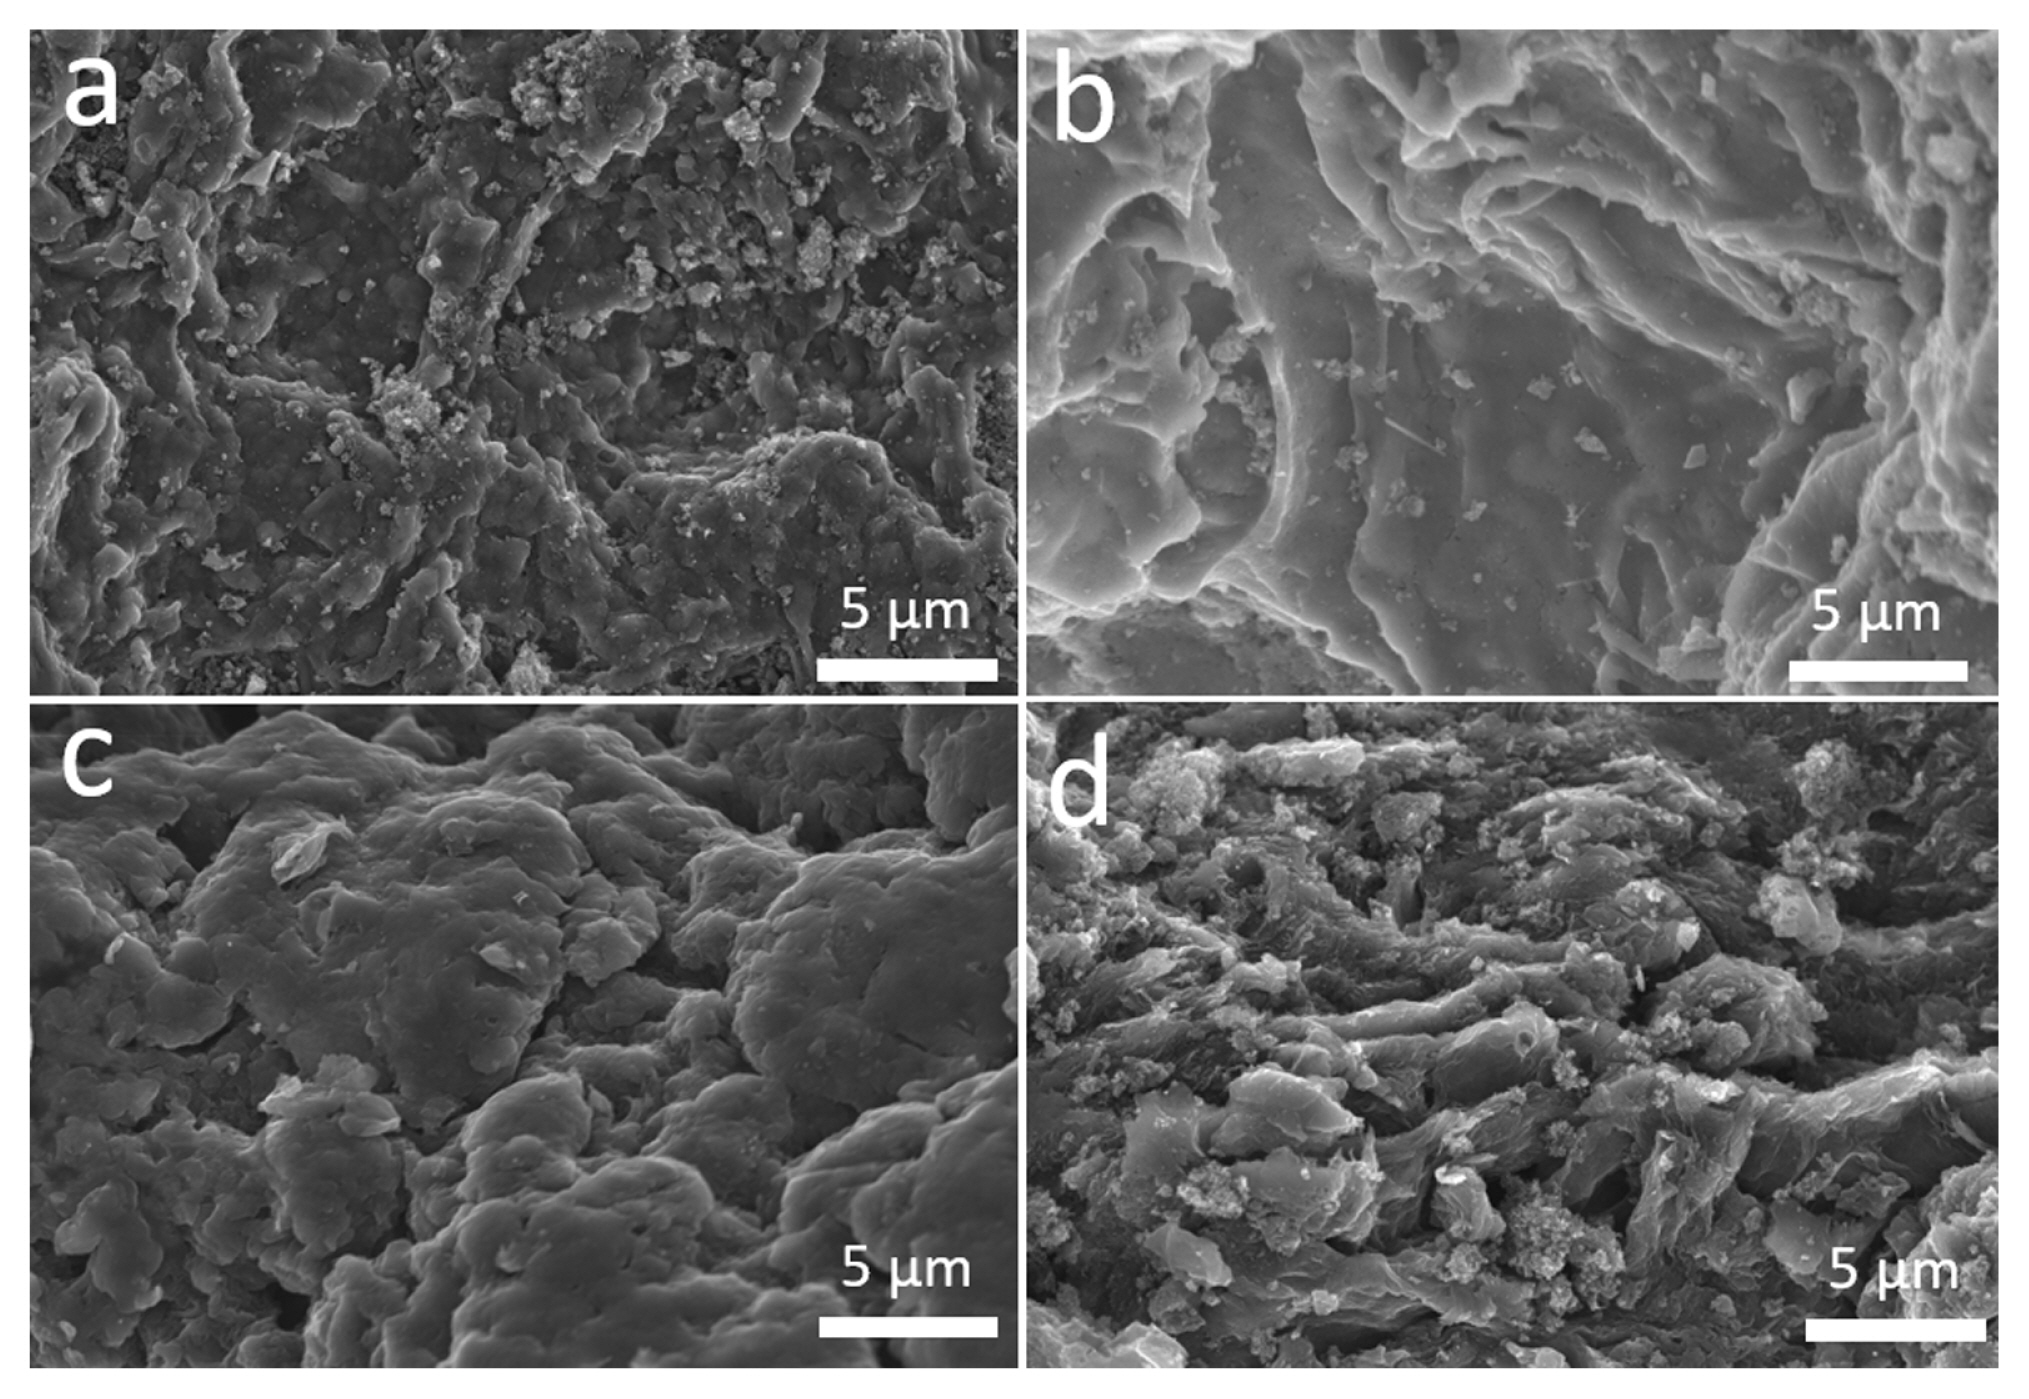
SEM images of (a) AC, (b) GO, (c) rGO, and (d) rGO/AC.
Typical N2 adsorption-desorption measurements were performed to examine the pore structures and BET surface areas of samples [31]. All samples showed typical IV-type isotherm adsorption-desorption behavior with hysteresis loops in the relative pressure range of 0.4 to 0.9 (Fig. 2a). This indicated the presence of mixed mesopore and macropore structures. Mesoporous structures affiliated with macropores are usually beneficial for enhancing adsorption-desorption cyclability because they enhance electrolyte diffusion and alleviate volume changes in the charge-discharge cycle [32]. The BET surface area of AC (986 m2 g−1) was the highest among all samples. Notably, rGO (643 m2 g−1) showed a higher surface area than GO (580 m2 g−1) owing to an increase in the d-spacing [33]. The surface area of rGO/AC at a mass ratio of 9:1 was 690 m2 g−1, which was the same as the calculated value based on the mass ratio.
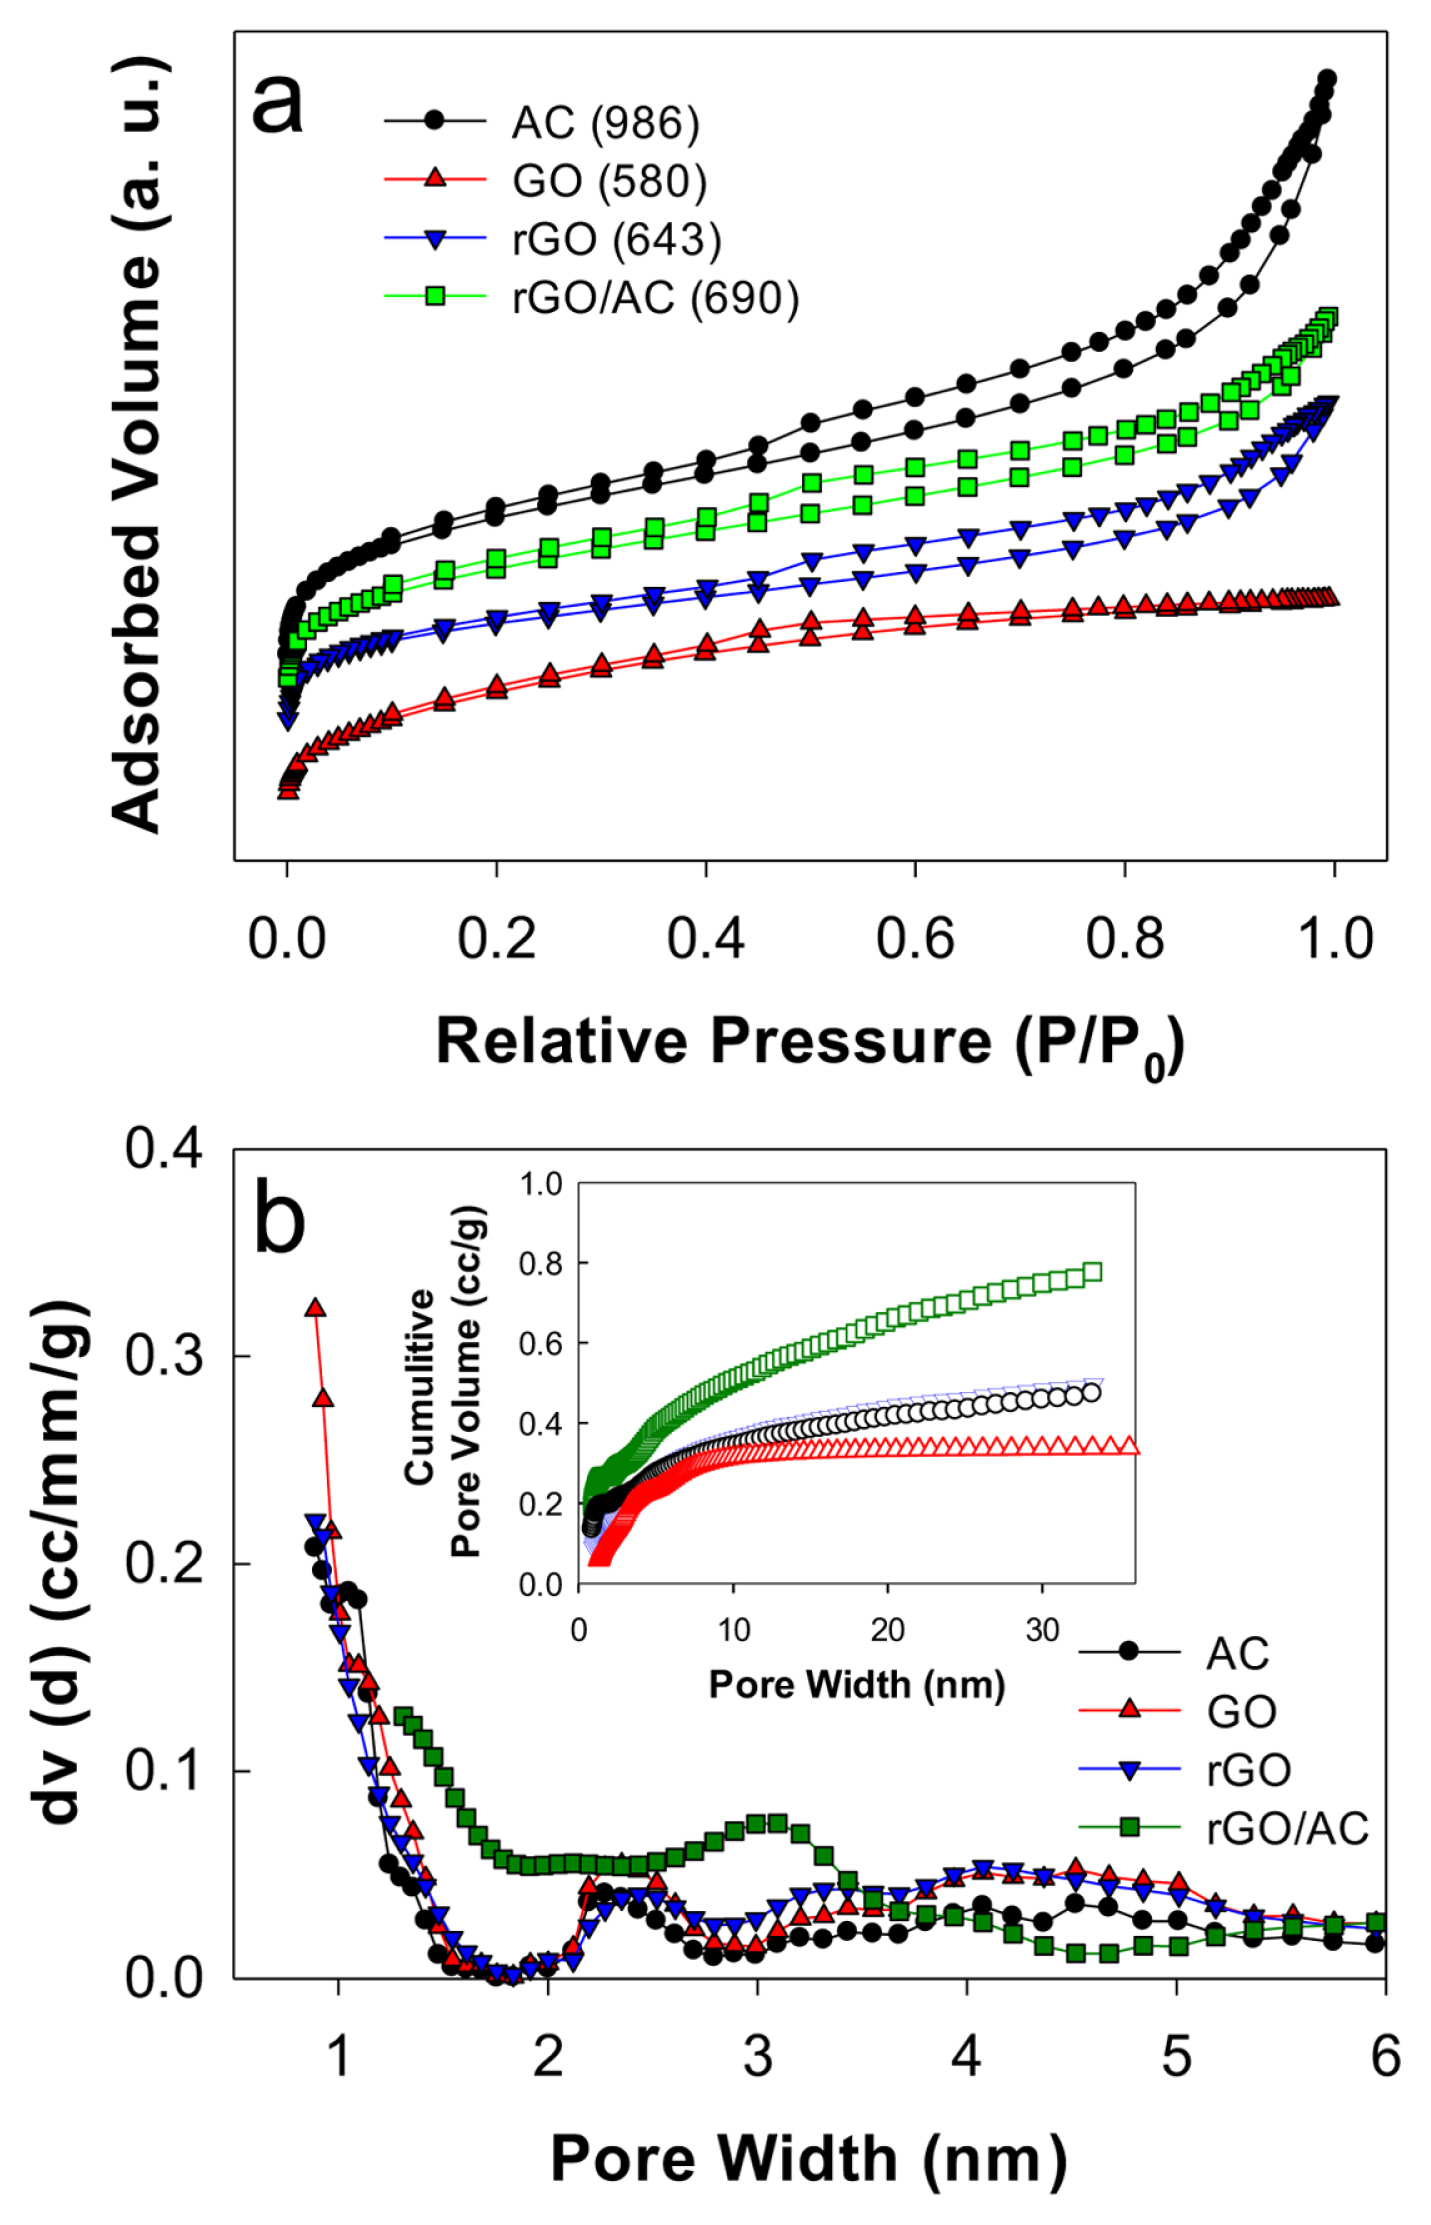
(a) N2 adsorption-desorption isotherms and (b) pore size distribution (inset: cumulative pore volume) with AC, GO, rGO, and rGO/AC samples. Numbers in the legend parentheses of Fig. 2a are BET surface area values (m2 g−1).
For all samples, two primary mesopore structures with diameters of ~2.5 and 5 nm were found (Fig. 2b), with average pore diameters of 2.8–3.6 nm. The cumulative pore volume with rGO (0.49 cc g−1) was greater than that with GO (0.34 cc g−1). The commercial AC sample exhibited the cumulative pore volume (0.47 cc g1), leading to the highest cumulative pore volume with rGO/AC (0.77 cc g−1). Regardless of sample type, the mesopore structures typically contributed to ~66% of the total pore volume. Therefore, the rGO/AC composite should display enhanced adsorption behavior by extruding the overlapping effect caused by micropores.
The C1s XPS spectra of the samples were recorded (Fig. 3a and S1). All spectra exhibited the C1s-characteristic peaks at a binding energy of ~284.5 eV. Deconvolution of the C1s peaks produced five subpeaks attributed to C-C (284.4 eV), C-O (286.0 eV), C=O (287.2 eV), O-C=O (288.1 eV), and π-π interaction (291.3 eV). The peak intensities of the oxygen-containing groups with rGO and rGO/AC were relatively low because of chemical reduction. The π-π interaction further indicated the presence of a graphitic network. Raman spectra of the samples were also obtained (Fig. 3b). The samples displayed two characteristic peaks at 1,355 cm−1 and 1,598 cm−1, corresponding to disordered-induced amorphous carbon (D band) and graphitic carbon (G band), respectively [21,34–36]. The intensity ratios of D and G bands (ID/G) were estimated to be 1.14 with AC, 1.0 with GO, 1.13 with rGO, and 1.11 with rGO/AC. Compared to GO, the higher ID/G value with rGO was attributed to the restored sp2 carbon, whose domains became small [37]. Notably, the ID/G value with rGO/AC was lower than those with rGO and AC. This suggests that the incorporation of AC into rGO increases the relative content of sp3 defects through which many electron transfer channels are created [38].

(a) XPS C1s spectrum with rGO/AC. Numbers in the legend parentheses refer to relative fractions. (b) Raman spectra with samples. Numbers in the legend parentheses refer to ID/IG ratios.
3.2 Electrochemical capacitive behavior
Fig. 4a shows the cyclic voltammograms with AC, rGO, and rGO/AC electrodes in the potential range between −1 and 0 V vs. SCE at a scan rate of 5 mV s−1 in aqueous NaCl solutions. The mass fraction of rGO in the rGO/AC composites varied between 0.5 and 0.9. The voltammograms exhibited quasi-rectangular curves with non-Faradaic reactions involving the adsorption and desorption of Na+ and Cl−. The rGO/AC exhibited a significantly larger non-Faradaic region than each rGO and AC, while a mass fraction of rGO at 0.9 (rGO/AC-0.9) induced the largest region among rGO/AC composites. The effect of the scan rate (5–100 mV s−1) on the voltammogram shape was further examined to estimate the specific capacitance (Cs) (Fig. 4b). Regardless of the sample type, a decrease in the scan rate led to a gradual rectangular shape in the voltammogram (Fig. S2), and as a result, Cs increased. This scan rate effect was attributed to slow ion diffusion at the solid/solution interface, which was compromised by acquiring a sufficient adsorption-desorption time at a low scan rate.
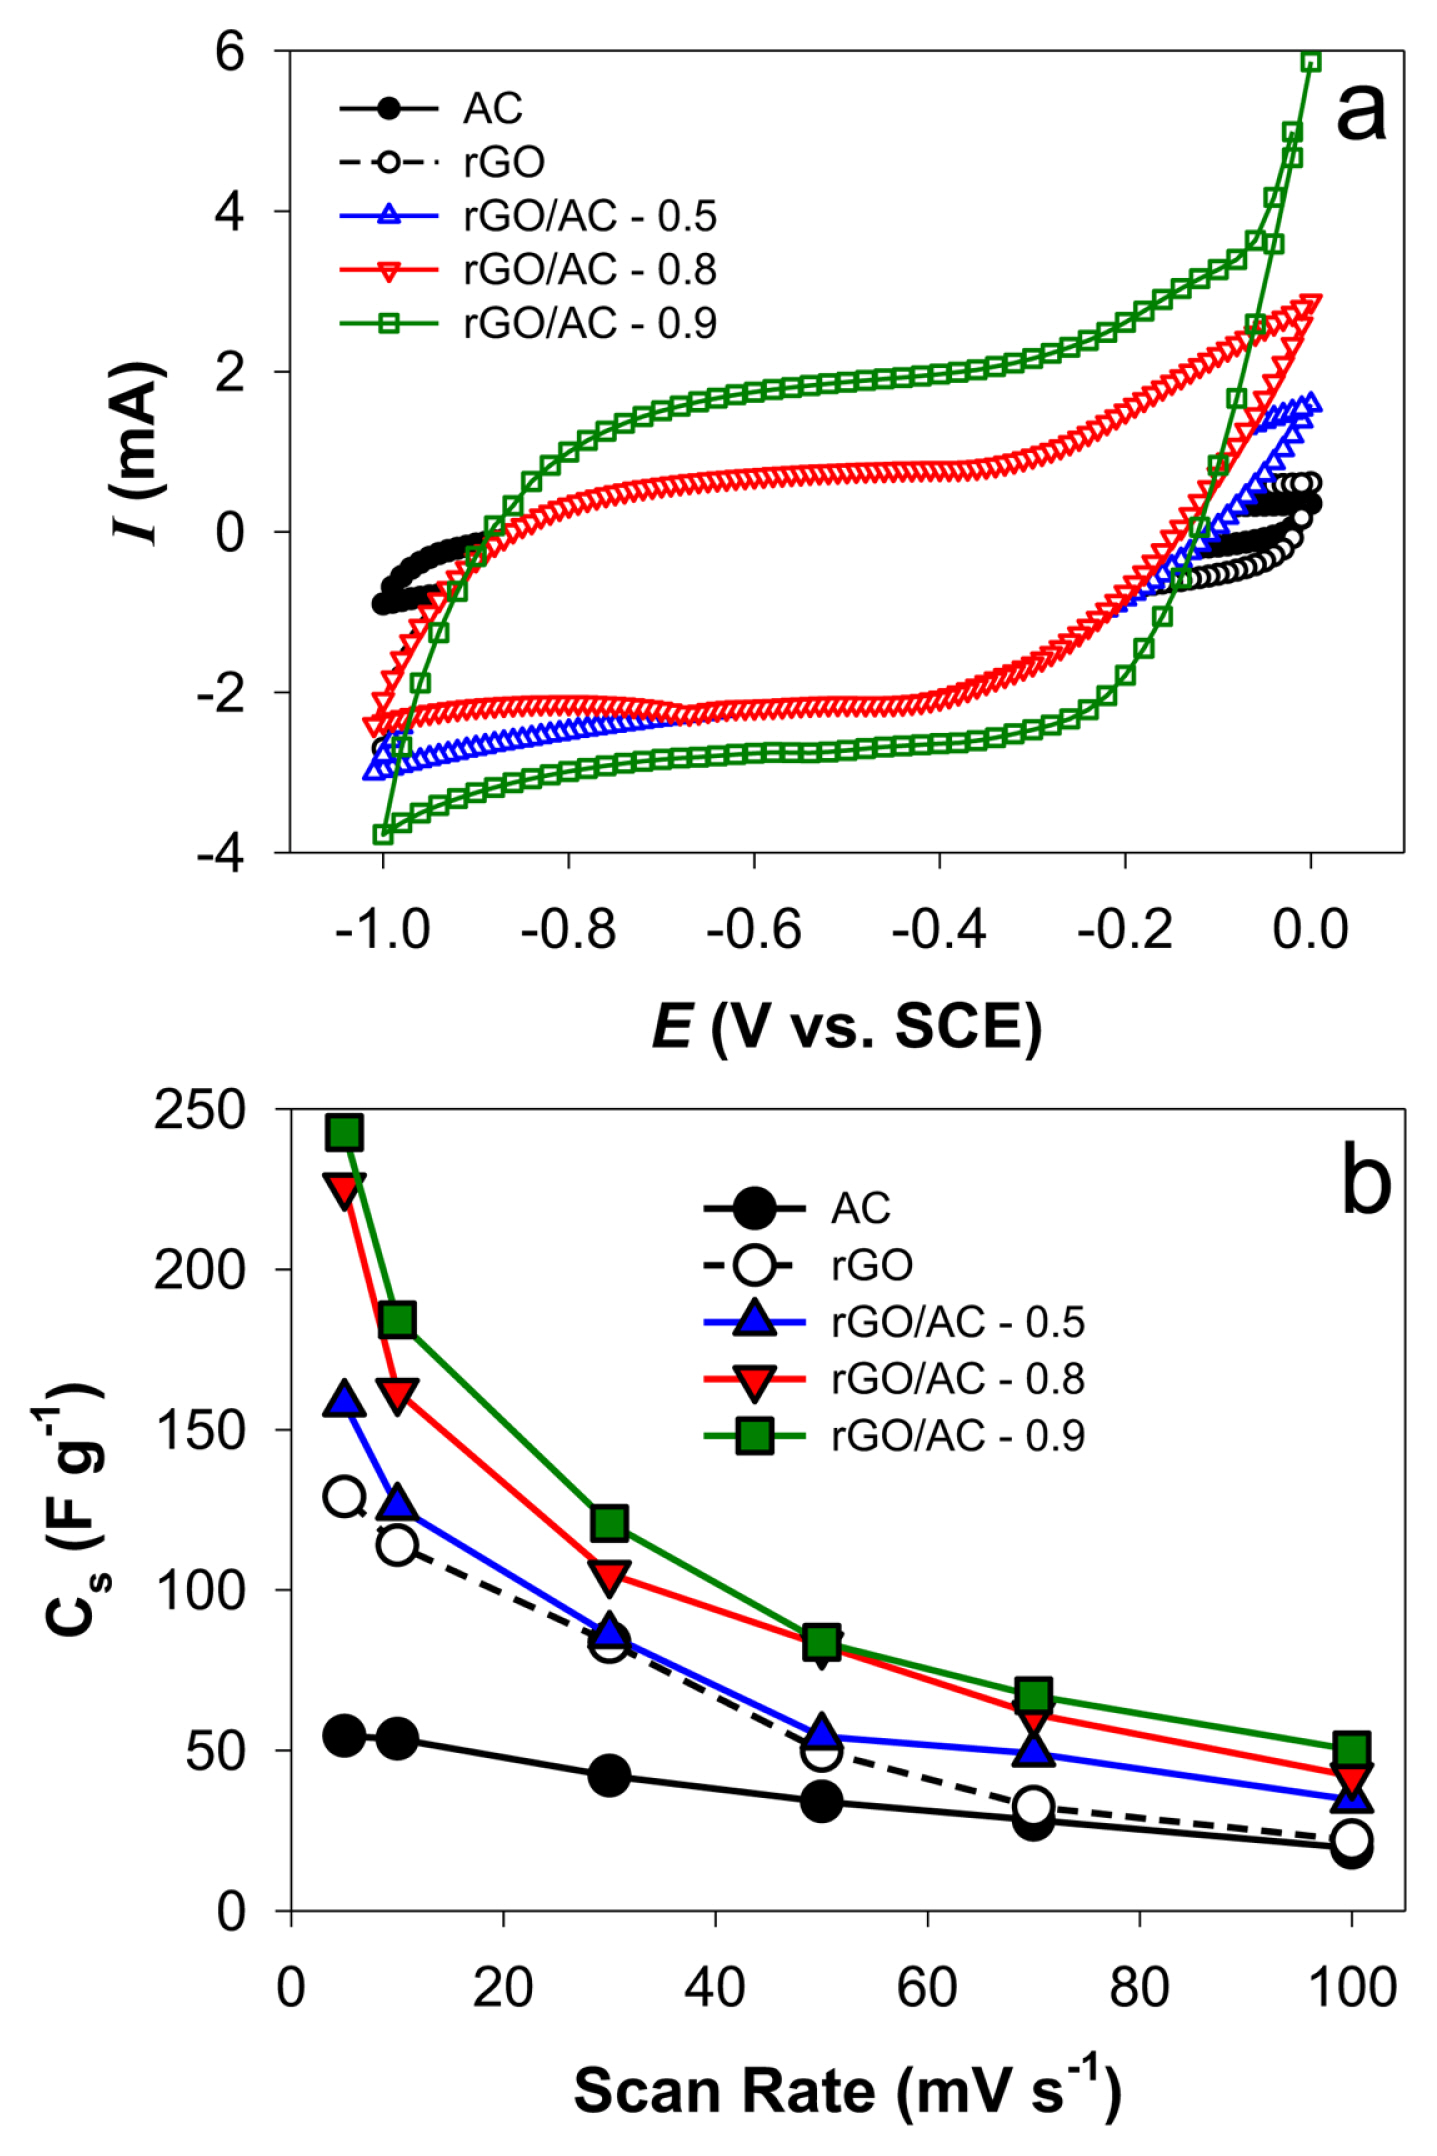
(a) Cyclic voltammograms (scan rate: 5 mV s−1) and (b) effect of scan rate on Cs with AC, rGO, and rGO/AC electrodes in aqueous 1 M NaCl solutions. The mass fraction (x) of rGO in the rGO/AC composites varied from 0.5 to 0.9 (rGO/AC-x).
Cs values with rGO were greater than those with AC at all scan rates, while rGO/AC-0.9 and rGO/AC-0.8 showed high Cs values (242.7 and 225.9 F g−1, respectively, at a scan rate of 5 mV s−1). It appears that the intercalation of AC into rGO layers exposes adsorption sites with rGO, enhancing ion transportation kinetics. As the NaCl concentration increased to 0.1 and 0.5 M, Cs values with rGO/AC-0.9 increased to 159.3 and 170.5 F g−1, respectively, at a scan rate of 10 mV s−1 (Fig. S3). This was partly attributed to the many adsorbed ions and the weak overlap effect of the electrical double layer in the concentrated NaCl solutions [39].
Galvanostatic cyclic charging-discharging tests were performed in the cell voltage (Ecell) range between 0 and 1 V in 1 M NaCl solution to examine the reversibility and stability of the same electrode pairs (Fig. 5a). At a specific current (Is) of 0.1 A g−1, Ecell increased linearly with time in the initial state and gradually leveled off towards 1 V during the charging period. During the discharging period, Ecell decreased linearly from 1 to 0 V over time. No significant voltage-tailing behavior was observed, indicating good reversibility. Among the electrodes, rGO/AC-0.9 electrodes required the longest charging and discharging times (~32 and 46 min, respectively). This was partly attributed to the highest Cs for the composition. With increasing Is (0.1 to 0.5 A g−1), discharging times with the rGO/AC-0.9 pairs gradually shortened (Fig. 5b). The other electrode pairs exhibited the same tendency (Fig. S4). This behavior is typically observed in highly porous carbon materials. The charging-discharging cycles with rGO/AC 0.9 were further repeated (up to 530 cycles) between 0 and 1 V at a specific current of 0.2 A g−1 (Fig. 6). All curves were symmetrically triangular up to the 256th cycle, with charging and discharging times of ~12 and ~18 min, respectively. This indicated that the electrodes were highly reversible and stable. Although the charging-discharging times decreased slightly (~4 min) from the 257th cycle, the original triangular shape was maintained up to the 530th cycle.
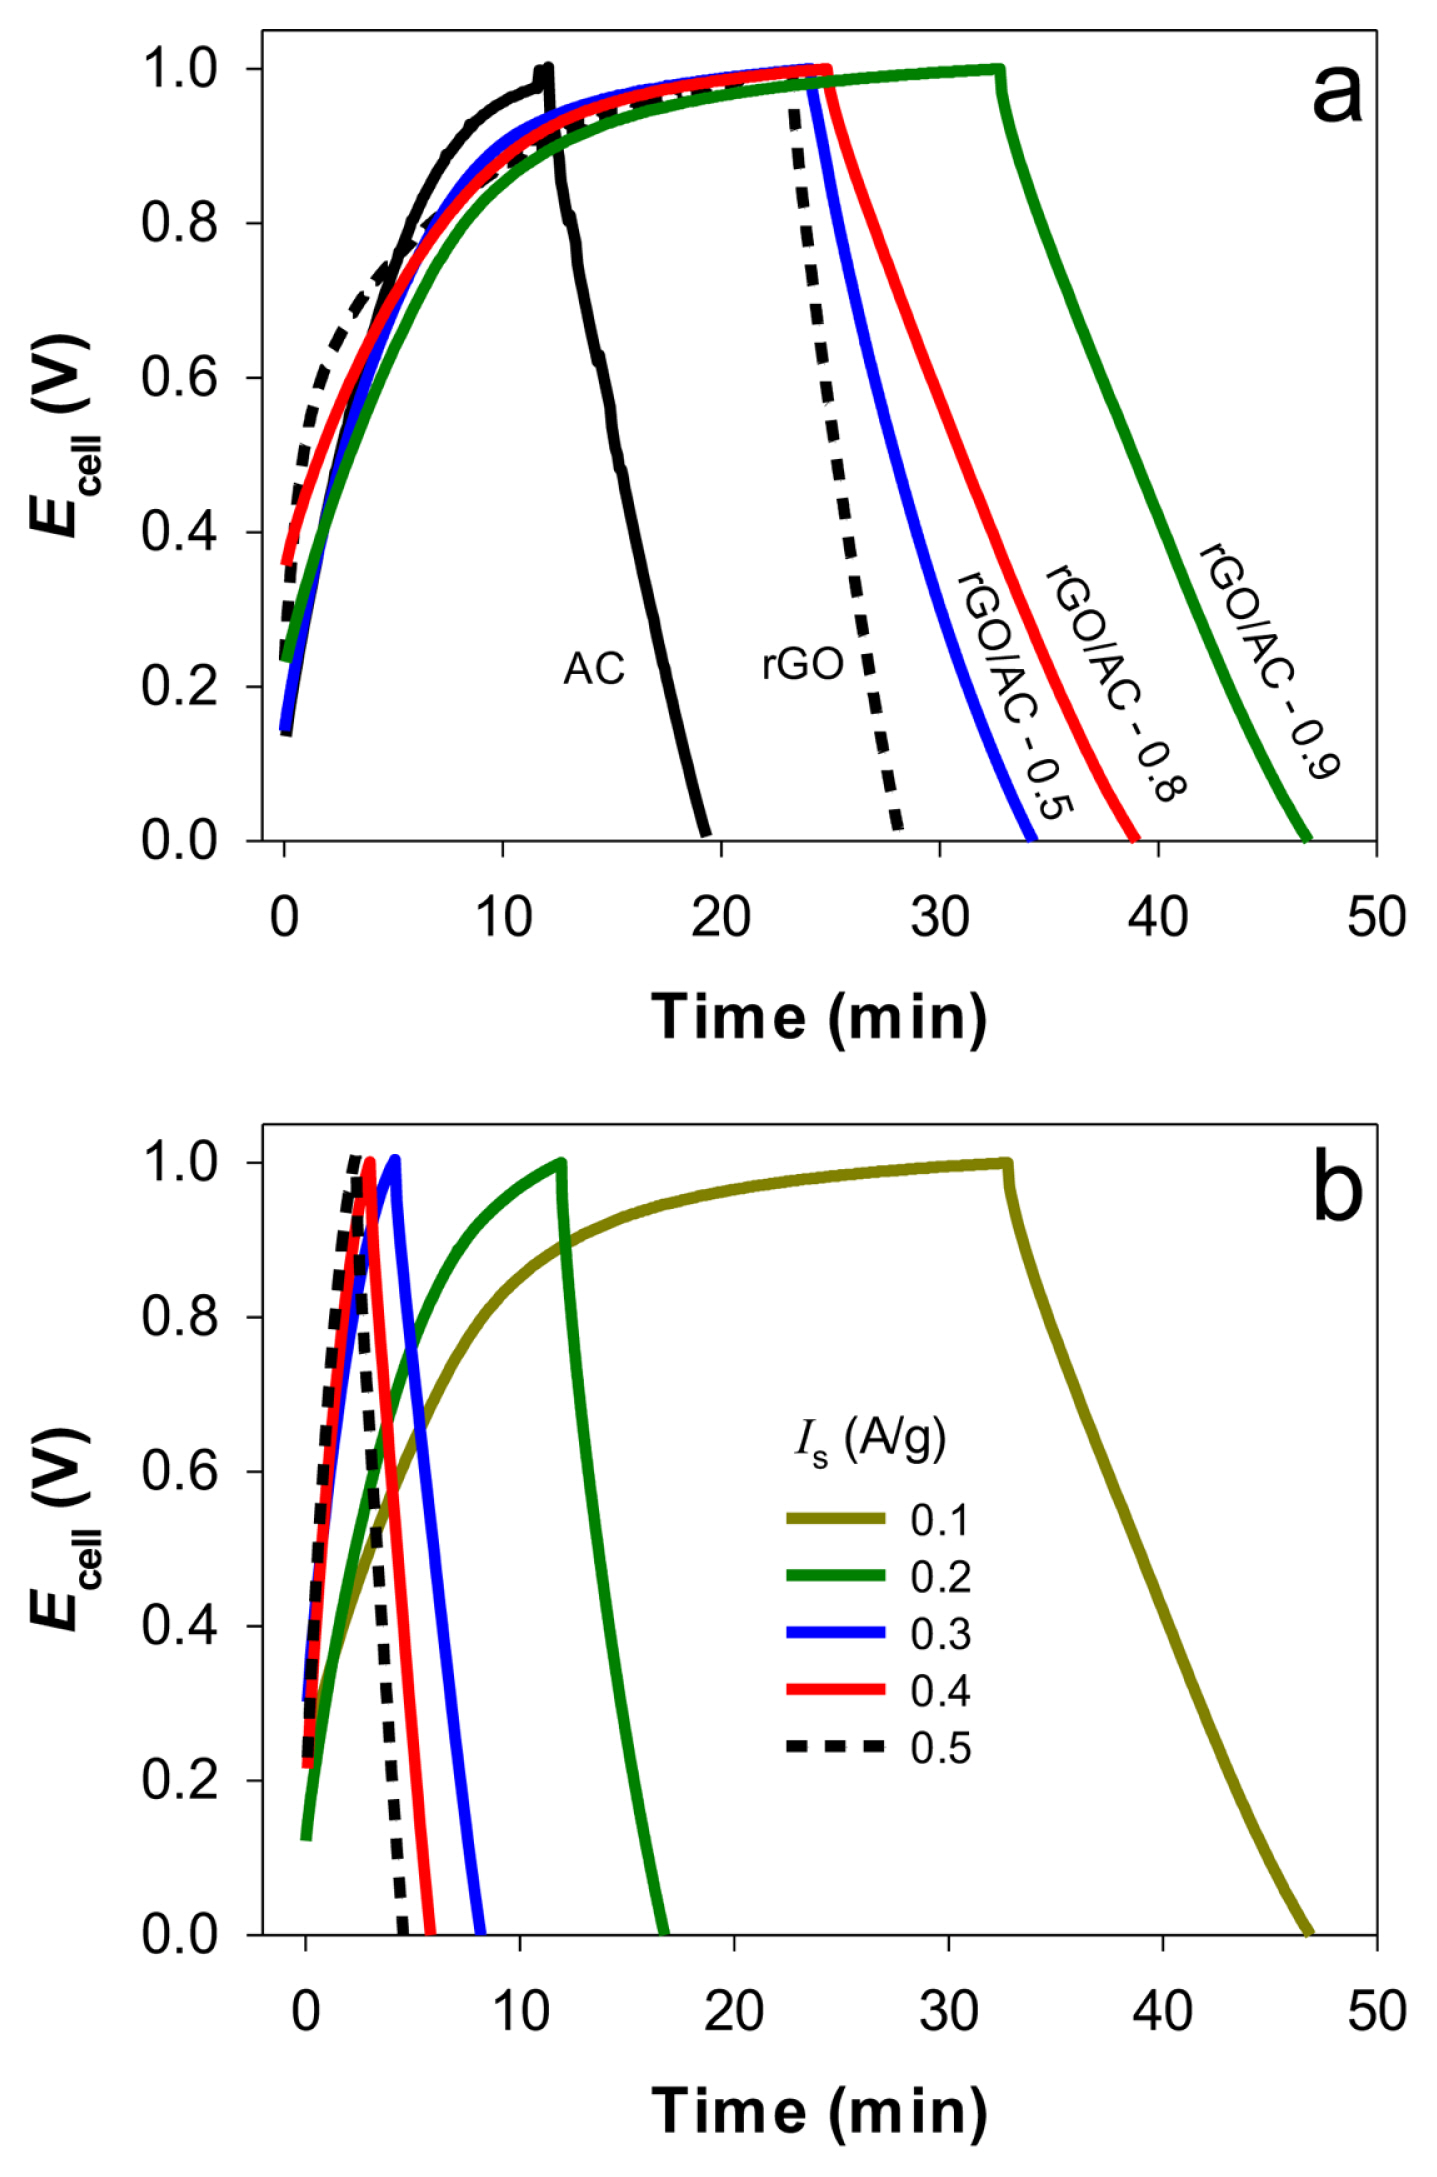
Galvanostatic charging-discharging cycles between Ecells of 0 and 1 V in 1 M NaCl solutions with (a) the as-synthesized electrodes at a specific current (Is) of 0.1 A g−1, (b) rGO/AC-0.9 at various Is values (0.1–0.5 A g−1).

Galvanostatic charging-discharging cycles between Ecells of 0 and 1 V in 1 M NaCl solutions with rGO/AC-0.9 electrode pair at Is of 0.2 A g−1.
3.3 Desalination performance
Potentiostatic desalination tests were performed to evaluate the desalination capacity of carbon electrode (twin) pairs at Ecell of 1.3 V in an aqueous NaCl solution at 0.5 g L−1 (~8.55 mM) (Fig. 7a). With the AC pair, the NaCl concentration gradually decreased to ~0.46 g L−1 in 40 min (hence Δ[NaCl] = ~40 mg L−1). The rGO pair exhibited the same tendency. Notably, Δ[NaCl] reached >70 mg L1 with the rGO/AC composites. Among these, rGO/AC-0.9 demonstrated the best performance with Δ[NaCl] of ~90 mg L−1 and SAC of ~13.9 mg g−1 in desalination under the same conditions (Fig. 7a inset). However, Δ[NaCl] decreased to ~50 mg L−1 when the Ecell of the rGO/AC-0.9 pair was reduced to 1.1 V at 0.5 g L−1 (Fig. S5). A low voltage typically induces a weak electrostatic force, thereby decreasing the desalination capacity. For an initial NaCl concentration at 0.2 g L−1, Δ[NaCl] was ~50 mg L−1 with the rGO/AC-0.9 pair at Ecell of 1.3 V. When the salt concentration is high, the electrochemical double layer is more compact, producing more electrostatic force and accelerating the ionic strength. This ultimately increases desalination capacity by adsorbing more ions on the electrode surface.

(a) NaCl concentration changes with carbon electrode pairs at Ecell of 1.3 V in 0.5 g L−1 (~8.55mM) NaCl solutions. Inset compares specific adsorption capacity values estimated in 40 min under different Ecells and NaCl concentrations (1.3 V in 0.5 g L−1, 1.1 V in 0.5 g L−1, and 1.3 V in 0.2 g L−1, for red, blue, and green bars, respectively). (b) SAR with respect to SAC for various desalination conditions.
The as-observed desalination activities were further compared in terms of SAR vs. SAC plots (Fig. 7b). Regardless of the electrode type and desalination conditions, SAR gradually decreased with increasing SAC in the initial stage, and abruptly dropped when SAC values were at their maximum. This behavior was attributed to fast ion adsorption on many ion-free surface adsorption sites, which blocked the access of free ions to the pre-occupied adsorption sites. The rGO/AC-0.9 composite showed the highest SAC and SAR values (~13.9 mg g−1 and 0.6 mg g−1 min−1, respectively). This high desalination performance of the rGO/AC composite may result from the proper incorporation of AC particles into rGO. The as-obtained SAC value is quite comparable to those in literature (Table S1).
Furthermore, rGO had a more accessible surface area with ion transportation channels. After the incorporation of AC, the rGO surface exhibited a more conductive architecture with high porosity, which facilitated ion accessibility and enhanced mass transportation. Although AC exhibits the highest specific surface area, the presence of micropores restrains the inner pores from accessing the ions [28], leading to poor desalination capacity. A comparison of the desalination performance of the rGO/AC composite revealed that a large fraction of AC incorporation can be an obstacle to ion pathways and fast ion adsorption.
Fig. 8 compares desalination capacities of rGO/AC-0.9 pairs at Ecell = 1.3 V for various sodium salts (NaX; X = F, Cl, Br, and I) and chloride salts (YCl; Y = Li, Na, K, and Cs) at 0.5 g L−1. For sodium salts, the desalination capacity was highest with I− (22.24 mg g−l), followed by Br− (18.27 mg g−l), Cl− (13.92 mg g−l), and F− (8.48 mg g−l) (Fig. 8a). The SAC value for NaI was also greatest at 22.24 mg g1. For chloride salts, the desalination capacity was highest for Cs+ with a SAC value of 18.5 mg g−l, followed by K+ (16.7 mg g−l), Na+ (13.9 mg g−l), and Li+ (9.7 mg g−l). Typically, ions with the same charge and small, hydrated radii can be easily removed because of the strong electrochemical double-layer overlapping phenomenon and reduction in the effective surface area for ion adsorption [40–42]. The hydrated ionic radii of F−, Cl−, Br−, and I−, are 3.52 Å, 3.32 Å, 3.30 Å, and 3.31 Å, respectively; the radii of Li+, Na+, K+, and Cs+ are 3.82 Å, 3.58 Å, 3.31 Å, and 3.29 Å, respectively [43]. Consistent with the order of ionic radius, small ions for the same counter ion were more effectively removed (e.g., NaI and CsCl). Notably, F is significantly larger than the other halides and exhibited the lowest removal capacity. The other three halides have similar hydrated ionic radii, whereas SAC with iodide has the highest ionic radius. Iodide has a higher partial charge-transfer coefficient than chloride and bromide, leading to a higher adsorption capacity [44].

Concentration changes in (a) sodium salts (NaX; X = F, Cl, Br, and I) and chloride salts (YCl; Y = Li, Na, K, and Cs) with rGO/AC-0.9 electrode pairs at Ecell of 1.3 V. Initial salt concentrations were 0.5 g L−1. Numbers in parentheses are SAC values.
4. Conclusions
In summary, rGO/AC composites were synthesized in a facile, environmentally friendly, and straightforward manner without any pre-treatment. GO oxide was successfully reduced to rGO, and AC particles were incorporated onto rGO. The as-synthesized composites displayed a three-dimensional porous morphology with a high capacitive behavior. Among all samples, the rGO/AC-0.9 composite demonstrated the best performance with a remarkable electrosorption capacity of 13.9 mg g−1 for NaCl solution in a single cycle at Ecell of 1.3 V for 40 min. In addition, it required the longest charging and discharging times, partly attributed to its highest specific capacitance. This indicates that the incorporation of AC into rGO was beneficial for improving the capacitive behavior and charging-discharging cyclability. The desalination capacity for the monovalent cations and anions showed the following orders: Cs > K > Na > Li and I > Br > Cl > F, respectively.
Supporting Information
Acknowledgments
This research was supported by the National Research Foundation of Korea (2018R1A6A1A03024 962 and 2019R1A2C2002602) and the Ministry of Trade, Industry, and Energy (MOTIE), Korea (2021-20015633). In addition, this publication was made possible by a grant from the Qatar National Research Fund under its National Priorities Research Program (NPRP 13S-0202-200228).