1. Introduction
In recent years, disastrous environmental problems are caused by the intensification of urbanization, industrial and agricultural activities. Soil salinization is becoming one of the harmful environmental threats that are damaging severely the natural environment, agricultural crops, human health, building, facilities and water supply systems [1–3]; Salt affected soils are developing gradually in many areas of the world, especially in arid and semi-arid regions. Recent studies have reported that over one billion hectares of land are affected by soil salinization [4–7] with a porftential of 10 to 16% increase/year [8–10]. In the next 30 years, the percentage of the total irrigated land affected by soil salinization could be extended to 50% if left unattended [7,11]. Soil salinization represents the major cause for crop yield reduction and soil deterioration [3,5]. The excessive admission of fertilizer and water in vegetable production boosts the amount of salts in soil and therefore, induces damages to plants. Moreover, the presence of salt can generate many damages on civil engineering infrastructures. The interaction between soluble salts in the soil solution and the exchange phase induces soil modifications, engendering soil strength diminution, swelling and dispersion, soil erosion and permeability reduction [10,12]. Since investigating the electrical response of soils is considered as a non destructive approach allowing precious information of soil [13–16], large uses have been employed for electrical measurements in many areas of scientific and engineering investigations, such as environmental, geotechnical, groundwater and underground fields. Specifically, electrical resistivity has been developed in geotechnical engineering, agriculture and geology since it is considered as a quick and non invasive method [17–20]. Soil resistivity values less than 100 Ωm reveals that soil nutrients are abundant in this area; however, sites with soil resistivity greater than 600 Ωm are reported as poor in soil nutrients [21]. Other investigations show that yields of crops are damaged by salinity when the electrical conductivity value (inverse of resistivity) is in the range of 2 to 8 dS/m [3,22]. Furthermore, electrical resistivity has been used to assess other soil properties that affect significantly civil engineering structures.
Previous researches highlighted that electrical resistivity represents an important tool for determining soil characteristics, including water content, plasticity index, soil strength and clay content. Archie [23] developed an empirical law using electrical resistivity to assess soil porosity was developed [23]. However, the application of Archie’s law is limited to a fully saturated sandy soil and rocks. Moreover, Archie’s law presumes that the soil matrix is non-conductive. For clayey minerals, this assumption is no suitable, in view of the clay’s structure and cation exchange capacity.
Kolay et al. [24] investigated the relationship between electrical resistivity and water content of Kaolinite clay mixed with various percentages of sand. The results show that at lower moisture content, the electrical resistivity for kaolinite and kaolinite–sand mixture changes significantly. Gingine et al. [25] presented an experimental study in which the electrical resistivity was measured in different specimens of white kaolin compacted with different voids ratio. In this study, resistivity charts found using theoretical concepts and drawn using experimental data were compared. Hassan and Toll [26] reported an inversely proportion exponential relation between the resistivity and degree of saturation. Mostafa et al. [27] carried out laboratory tests on calcareous soil samples for determining their electrical resistivity after compaction. Relationships were developed for soil in the studied site between electrical resistivity and compaction index. Nevertheless, it could be observed that the derived relations are appropriated for local soils controlled by the geological constitution of the site environment and reveal limitations for their application to different soil classes. In addition, most of these studies are not applicable to salt affected soil. Moreover, generalization of the relationships involving soil resistivity and salt concentration of fine grained soil mixed with different saline solutions have yet to be derived.
There is a considerable scope for developing correlations for soil salinity and electrical resistivity. The purpose of this study is to characterize the electrical resistivity of salt affected soil in term of soil parameters namely water content, degree of saturation and salt concentration. It appears from this study that the electrical method is a very useful geophysical technique. The determination of these geotechnical parameters allowed us to track the salinity of the soil and consequently improve efficiently its mechanical properties.
2. Electrical resistivity of soil
The electrical resistivity is defined as the physical parameter that indicates the ability of a material to oppose the passage of an injected current. In soil science, the major advantages of electrical resistivity are its speed of acquisition of measurements and its non-destructive aspect. The principle of electrical resistivity is based on Ohm’s law according to the following formula:
Where R expresses the resistance, I is the electrical current and V the potential drop.
The current density J represents the amount of current flowing through a cross-sectional area A of a material as follows:
Electrical resistivity symbolized by r is namely proportional to the cross-sectional area A, and conversely corresponding to the length L as expressed in the following equation:
The majority of granular materials are poor conductors, however conduction within a soil matrix is principally electrolytic in view of the presence of water inside pores. It is obvious that the nature of the fluid plays an important role; when the salt concentration of water increases, the fluid becomes more conductive [21]. Since an electrical potential is applied between two electrodes, the electric charges move away from their equilibrium position inducing conduction phenomena. Furthermore, the presence of surface charges in fine grained soil minerals caused by isomorphous substitution within the crystal structure yields more complex the electrical conduction phenomena as double layers involve restrictions on ion displacements engendered by electrostatic attraction and repulsion [22] as depicted in Fig. 1.
The electrical resistivity of soil is a function of its geotechnical characteristics. Several researchers have attempted to study the relation between electrical resistivity and soil parameters, such as porosity, mineralogy, water content and temperature [13,30–33]. It has been shown that electrical resistivity is greatly influenced by the composition of pore fluid as well as the nature of soil minerals. The aspect of electrically conductive soil particles made them able to keep and release water and particle atoms on the surface of soil minerals via a particle trade process [16,33].
Although various investigations have previously formulated correlations between the electrical resistivity and soil characteristics [13,20,30–33], nevertheless, most of them are not applicable to salt affected soils. Furthermore, it is well known that salinization represents essential criteria that affect soil resistivity.
3. Experimental
3.1 Study area
The laboratory experiments were carried out on soil samples collected from the basin of Mostaganem, situated in the North West region of Algeria. The localization of the study area is depicted in Fig. 2. The climate of this region is defined as semi-arid according to the Köppen-Ceiger classification. July and August are the driest months, whereas January and February are the wettest ones. During six months of the year, the evapotranspiration surpasses 80 mm. The climate of this region is described as warm-dry in summer and cold-dry in winter. Over the last decades, it was characterized by a rainfall deficit with average annual precipitation that did not exceed 35 mm. The average temperature was 18.1°C. The soil samples were collected on 23 March 2021 which was characterized by an average temperature of 16°C.
The soil samples were extracted by drilling at four points at depths of 0.5 to 1 m. There were sealed in plastic bags, marked and transported to the laboratory where they were ground to a fine powder after drying them in an oven at 105°C as suggested by the ASTM (1991) [34]. Experimental tests were carried out in order to identify the physical and chemical characteristics of soil specimens. The obtained results of physico-chemical parameters such as soil texture, optimal water content, Atterberg limits, pH and initial ions concentrations are summarized in Table 1.
3.2 Saline samples preparation
Soil salinization implies the existence of dissolved salts in aqueous soil samples. The major mineral ions found in soil solution are sodium (Na+), calcium (Ca2+), chloride (Cl−), potassium (K+) and magnesium (Mg2+). Conventionally, concentration of soluble salts is used to assess soil salinity. This study is based on artificial salinization of soil specimens with the three following types of chloride salts NaCl, KCl and MgCl2 which are predominant in collected soil specimens. Saline solutions were prepared by weighing and diluting salt ions in distilled water using an electric stirrer. Subsequently, soil samples were well mixed with the obtained solutions and left for about 24 hours to ensure the homogeneous dispersion of salt ions in the soil. During the laboratory experiment, different electrolyte solutions with various concentrations were prepared and mixed to soil specimens in order to reproduce and stimulate the concentrations of natural saline soils. After that, the soil samples were placed in the bench-scale and compacted in three equal layers using a laboratory rammer with 25 blows for each layer. The void space enclosed by particle grains and fissures resulting when putting the soil in the experimental cell, were removed during this experimental phase.
3.3 Test procedure
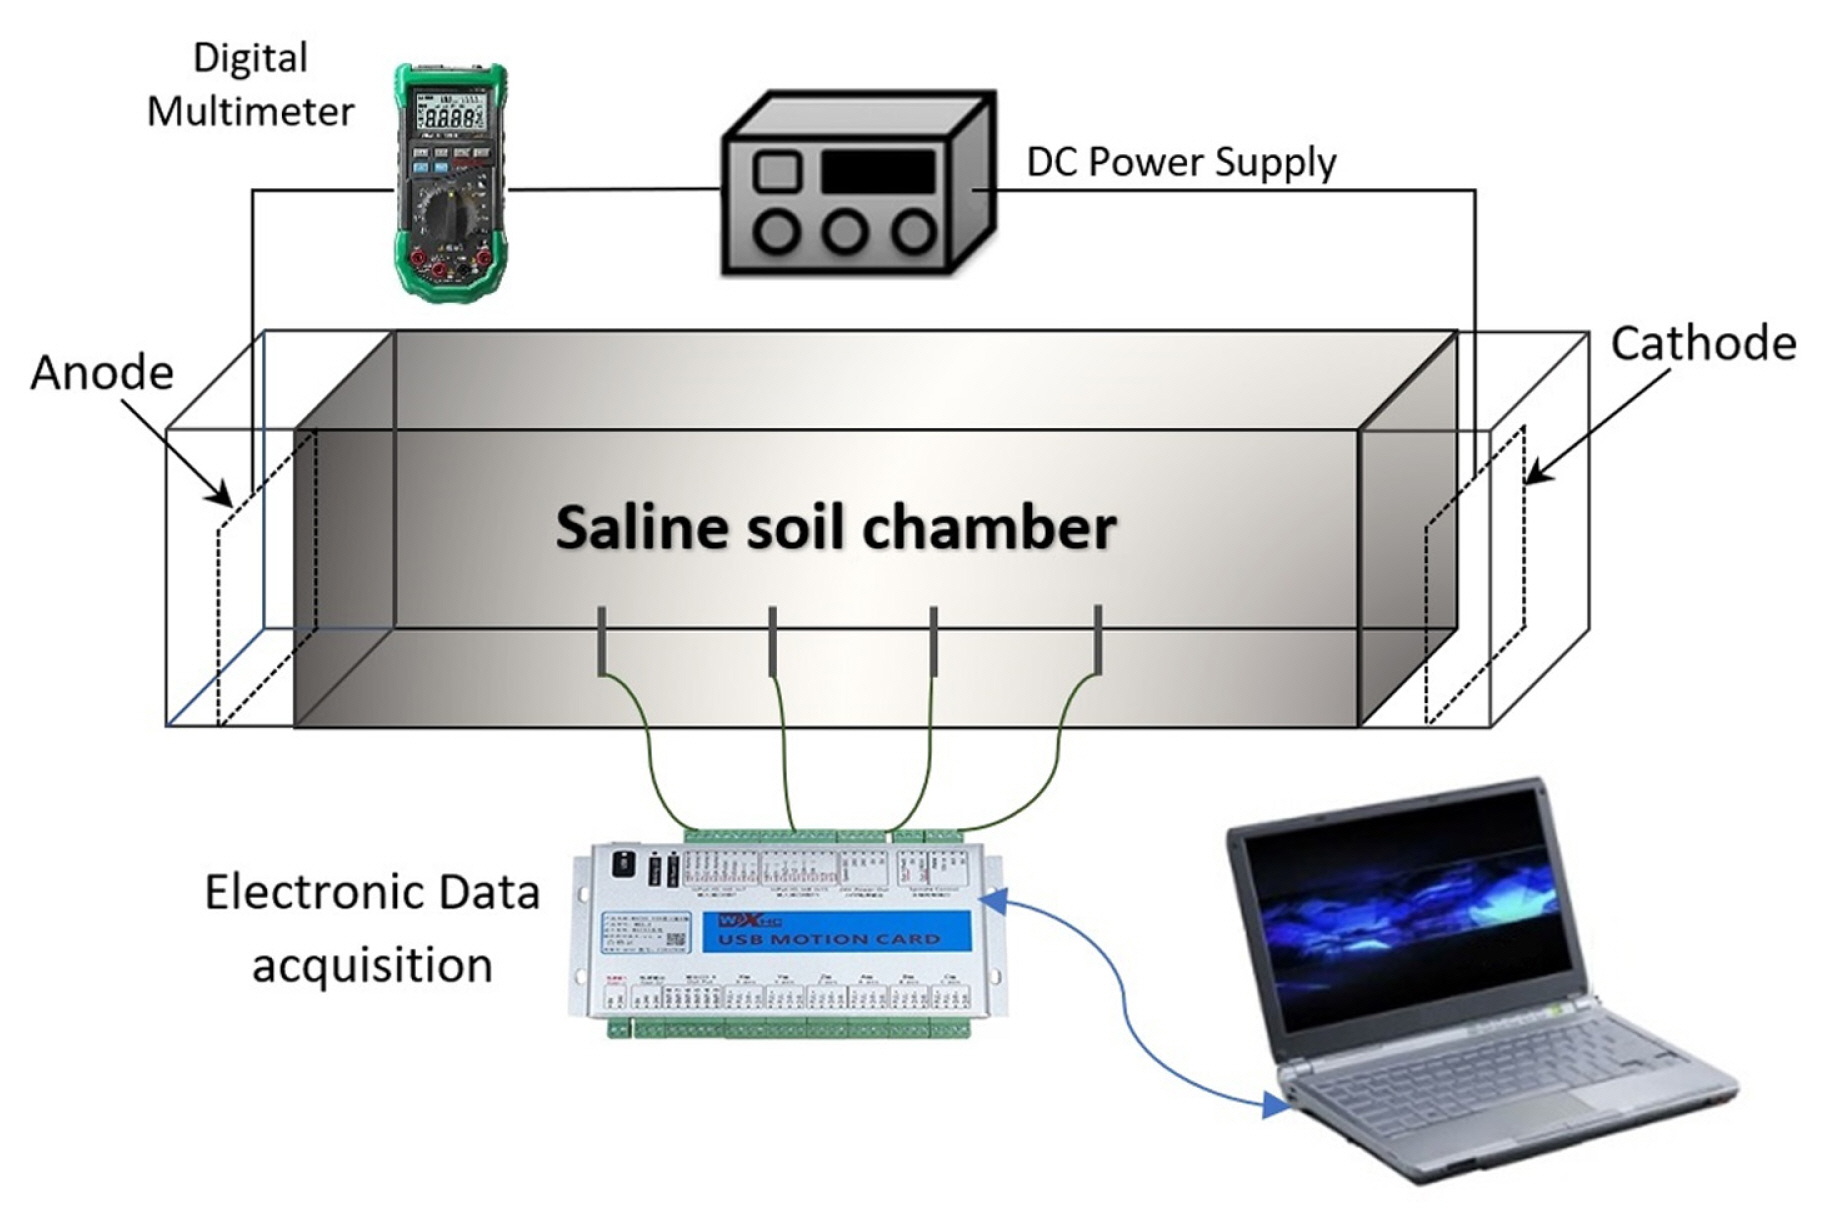
The experiments were carried out in a parallelepiped-shaped cell of 25 cm internal length, 10 cm internal width and 1 cm thick Perspex sheet. The cell was fitted with two copper plate electrodes having similar cross-sectional area as the cell. The experimental setup was connected to an electronic device allowing the automatic monitoring of data acquisitions such as current and electrical potential. A schematic representation of the experimental set up used in this investigation is illustrated in Fig. 3.
The electrical resistivity r was measured according to Wenner method, by applying a direct current DC to the outer electrodes and measuring the arising difference of potential between the inner ones [35]. The value of electrical resistivity is computed through the following formula:
Where L1 and L2 represent the spacing and depth of the electrodes, respectively, and R is the electrical resistance. The values of potential drop and current intensity were checked using a digital multimeter.
In this study, electrical resistivity has been used as an indicator of the influence of different parameters, such as salt concentration, water content and degree of saturation of saline soil specimens.
4. Results and Discussion
4.1 Relationship between salt concentration and electrical resistivity
As time progresses, many factors contribute to the increase of soil salinity such as irrigation, saline water intrusion and application of fertilizers [3,36]. Soil salinization affects negatively soil structure and hydraulic parameters producing damages to civil and industrial infrastructures.
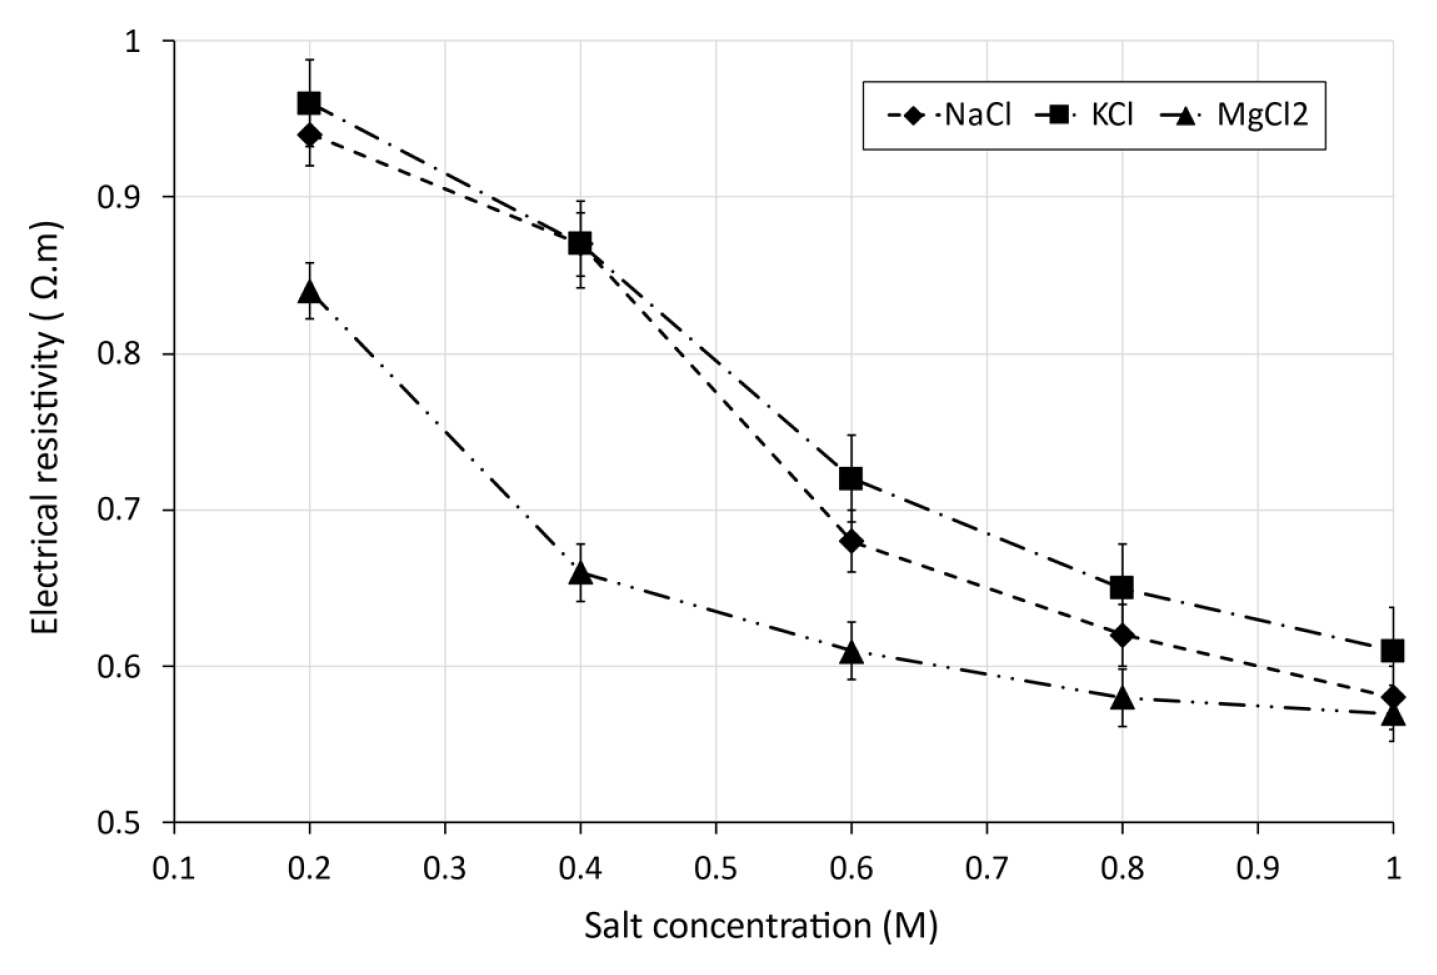
Fig. 4 illustrates the effect of salt concentration on electrical resistivity for different soil samples mixed with NaCl, KCl and MgCl2 solutions at different concentrations.
It appears from Fig. 4 that the salt concentration has a great effect on the electrical resistivity of soil specimens. According to the test results, it can be seen a drastic diminution of electrical resistivity with the increase of salt concentration. The influence of salt concentrations on the decrease of the electrical resistivity is more considerable for saline concentrations lower than 0.6 M. The reason is that the saline solutions close to this point with the concentration in excess of 0.6 M, the current flows in soil predominantly through electrical conduction of salts present in pore water and exchangeable ions of clay minerals. Thereafter, across soil matrix where soil particles are in continuous contact.
The composition of ions in saline soil samples is affected by the salt composition of soil water. Consequently, high ion concentrations are induced by the release of Na+, K+, Mg2+ cations and Cl− anions. Therefore, the electrical resistivity of soil is reduced [37].
Various curves (linear, exponential, polynomial, etc.) fitting interpolation were assessed. Thereafter, the approximation with higher coefficient of determination R2 was chosen. The correlation between salt concentration and electrical resistivity can be represented by the following relation:
Where C represents the salt concentration; and a1, b1 and c1 are the statistical parameters as summarized in Table 2.
We can observe from Table 2 that the regression reflects strong relationship between electrical resistivity and salt concentration, with coefficient of determination R2 varying between 0.96 and 0.99.
As reported by Corwin and Lesch [38], the current flows in the soil according to three pathways. The first consists of the electrical conduction, based on the movement of salt ions enclosed in pore fluid of soil matrix. The second pathway is attributed to the exchangeable ions at the surface of fine grained soils. The latest pathway takes place when soil particles have permanent and close connections [20,37]. When soil samples are submitted to electrical current, salt cations and chloride anions move toward the electrode with opposite charges. These migrations induce modifications in the soil solution.
Electrolysis refers to chemical reactions that involved with the electrical gradient near the electrodes [2,10]. Based on electrolysis theory, the following reactions occur:
At the vicinity of the anode, 2 electrons are provided by 2 chloride anions. However, at the cathode, hydrogen ions are produced from water. The migration of ionic species through the soil matrix induces modifications in the electrical resistivity. Restrained studies highlight the effect of salt concentration on the variation of electrical resistivity in saline soils, which constitute a governing element in the assessment of saline lands sustaining infrastructure developments.
4.2 Relationship between water content and electrical resistivity
Direct measures are usually used to estimate soil water content. Laboratory measurements involve weighing soil samples pre and post oven drying. Recent investigations appeared that the use of geophysical methods, and particularly of electrical resistivity, for assessment of soil water content is fast, economic and does not result in disturbances in soil structure [39–42]. In this study, the soil specimens blended with saline solutions at different concentrations were compacted to varied water contents.
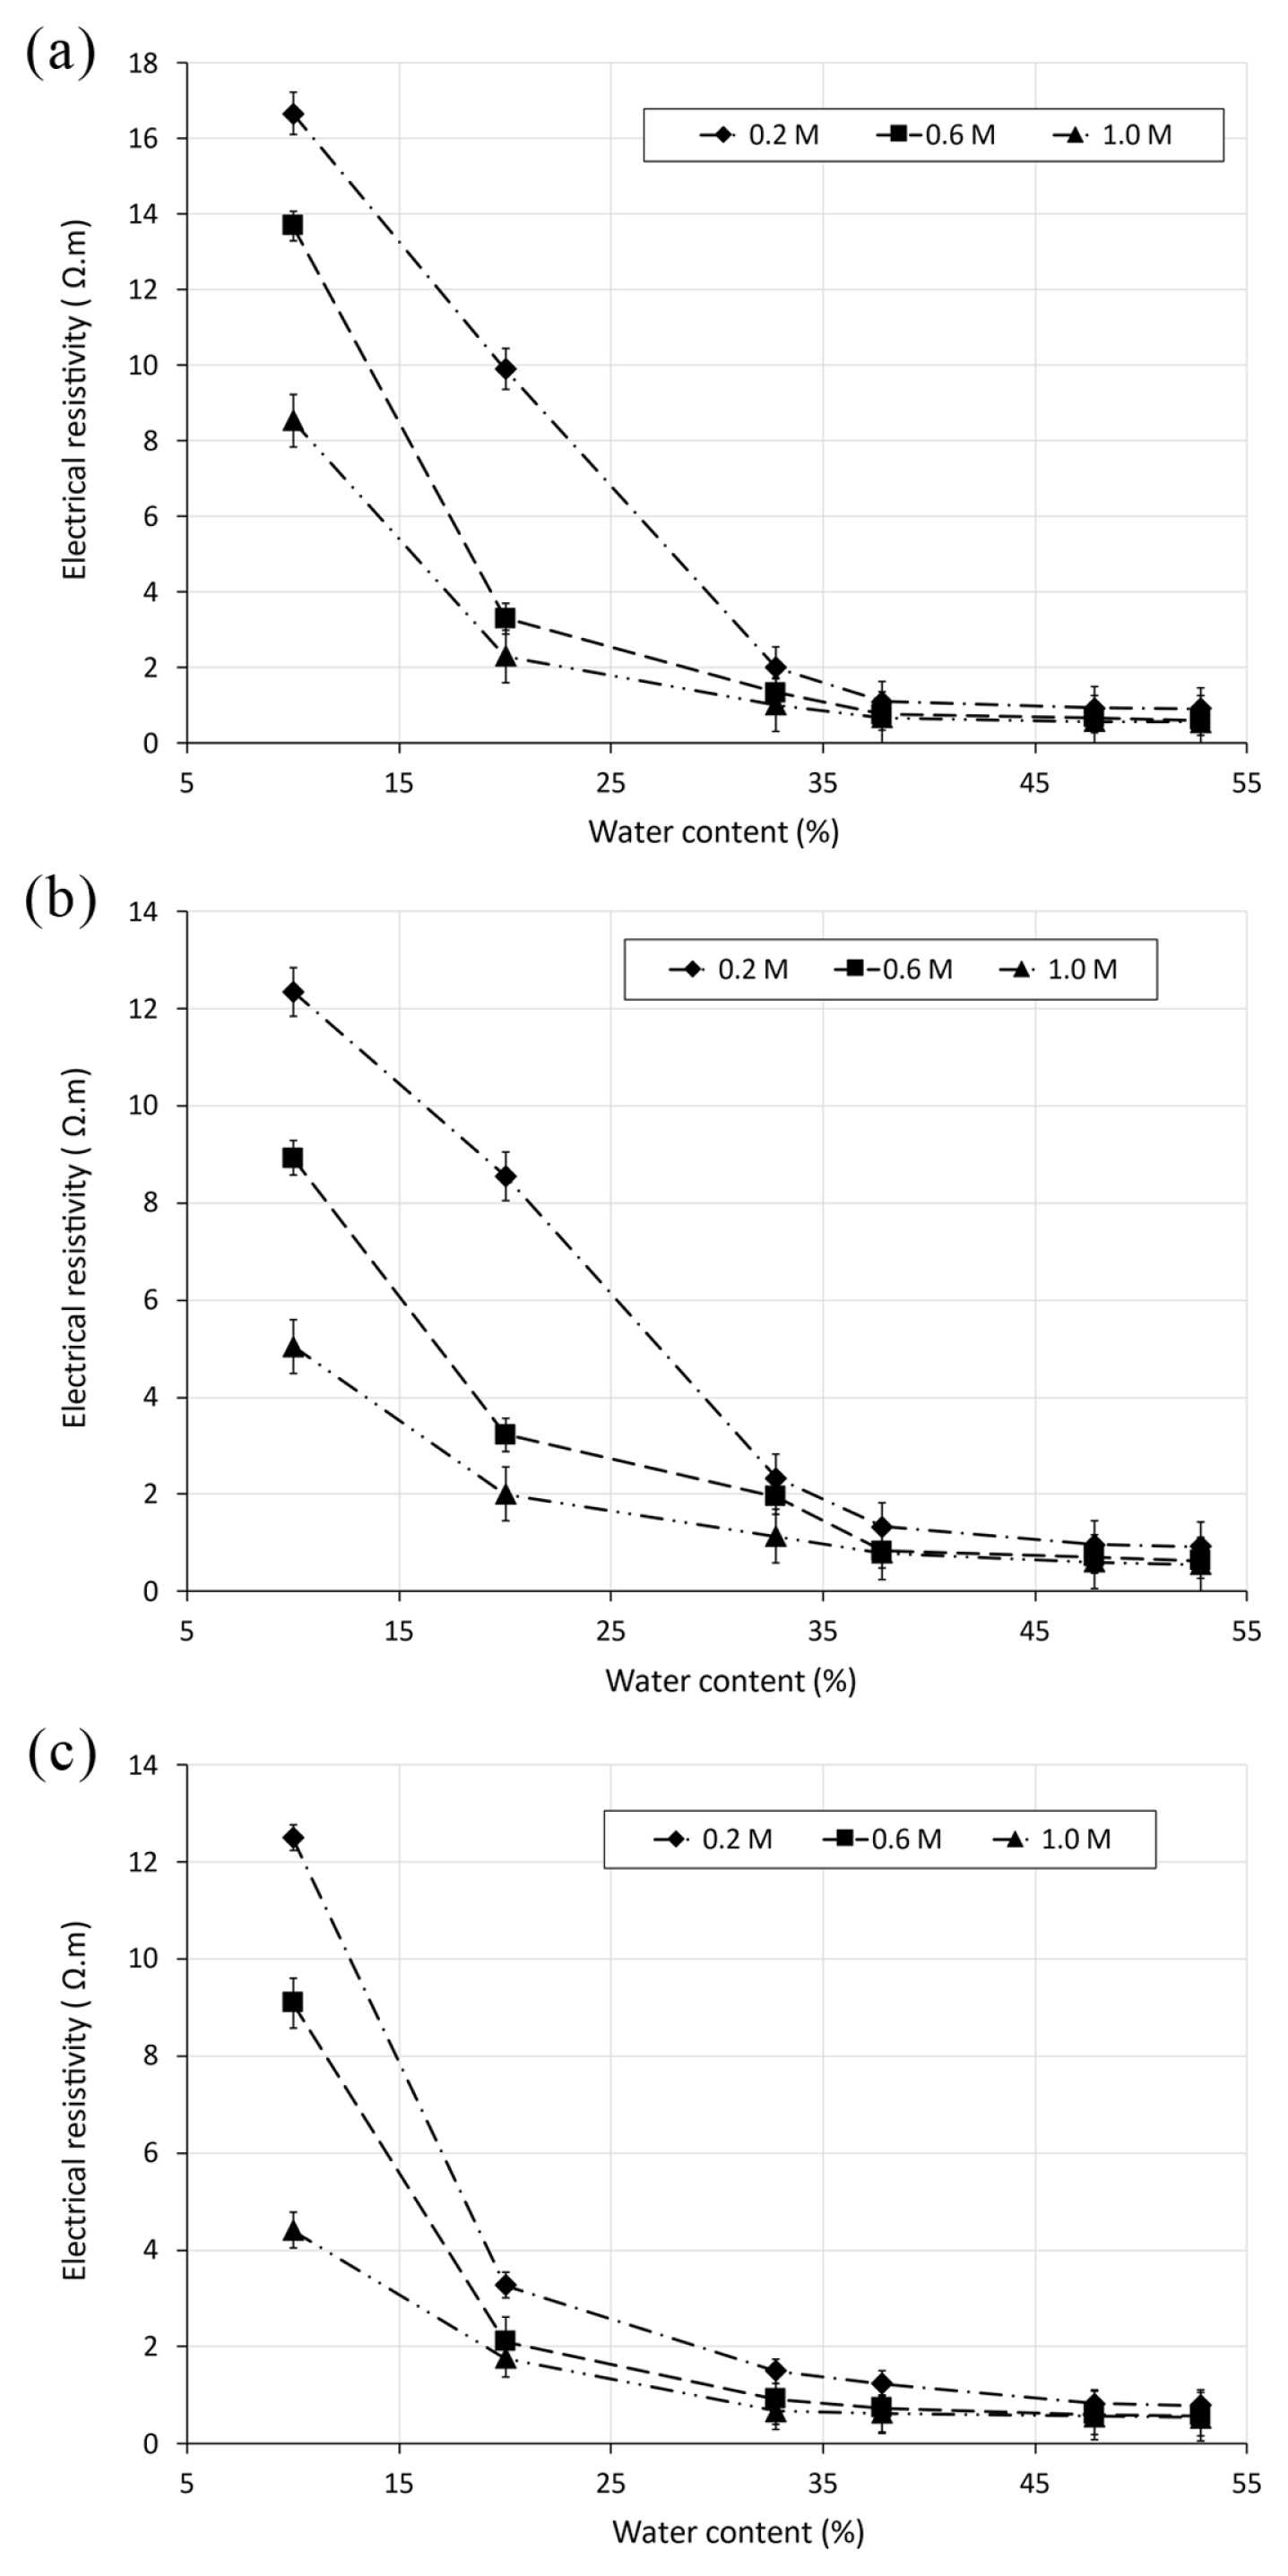
Fig. 5 shows the variation of the electrical resistivity of soil specimens mixed with NaCl, KCl and MgCl2 solutions at different concentrations of 0.2, 0.6 and 1 M. Previous investigations reported that the electrical resistivity of fine grained soil were not possible to define at water content below 8% [43–45]. This can be explained by the fact that the electrical resistivity of soil is associated to the volume of interstitial pore water present in soil matrix [33,45]. Opposite to sandy soils, where interstitial pore fluid is easily accessible for the electrical conduction; the electric charges, that composed the double layer at the surface of fine grained soils, leading to reduce the quantity of free interstitial water available for conduction [30,45].
According to the test results, a decrease of the electrical resistivity r with the increase of water content value w can be noticed. The same trend was observed for soil samples mixed with NaCl, KCl and MgCl2 solutions with different concentrations. At the beginning of the curves, a fast decline can be seen. Thereafter, the variation of electrical resistivity becomes irrelevant when the values of water content are higher than 38%. The Molecular attraction force in the film capillary zone is greater than the capillary force [46]. Therefore, the electrical resistivity becomes independent of water content since the mobility of electrical charges becomes dissociated from the migration of water and salt ions. As a result, the variation of electrical resistivity is relatively insignificant.
A positive correlation was observed between water content and electrical resistivity. It can be represented by the quadratic function as follows:
Where a2, b2 and c2 represent the statistical parameters summarized in Table 3.
In addition, the ionic mobility of water and salt particles in pore spaces promotes the conduction of electrical current [20,41] which lead to the diminution of soil resistivity. This report indicates that the salt concentration is one of the major prominent factors on variation of electrical resistivity.
4.3 Relationship between degree of saturation and electrical resistivity
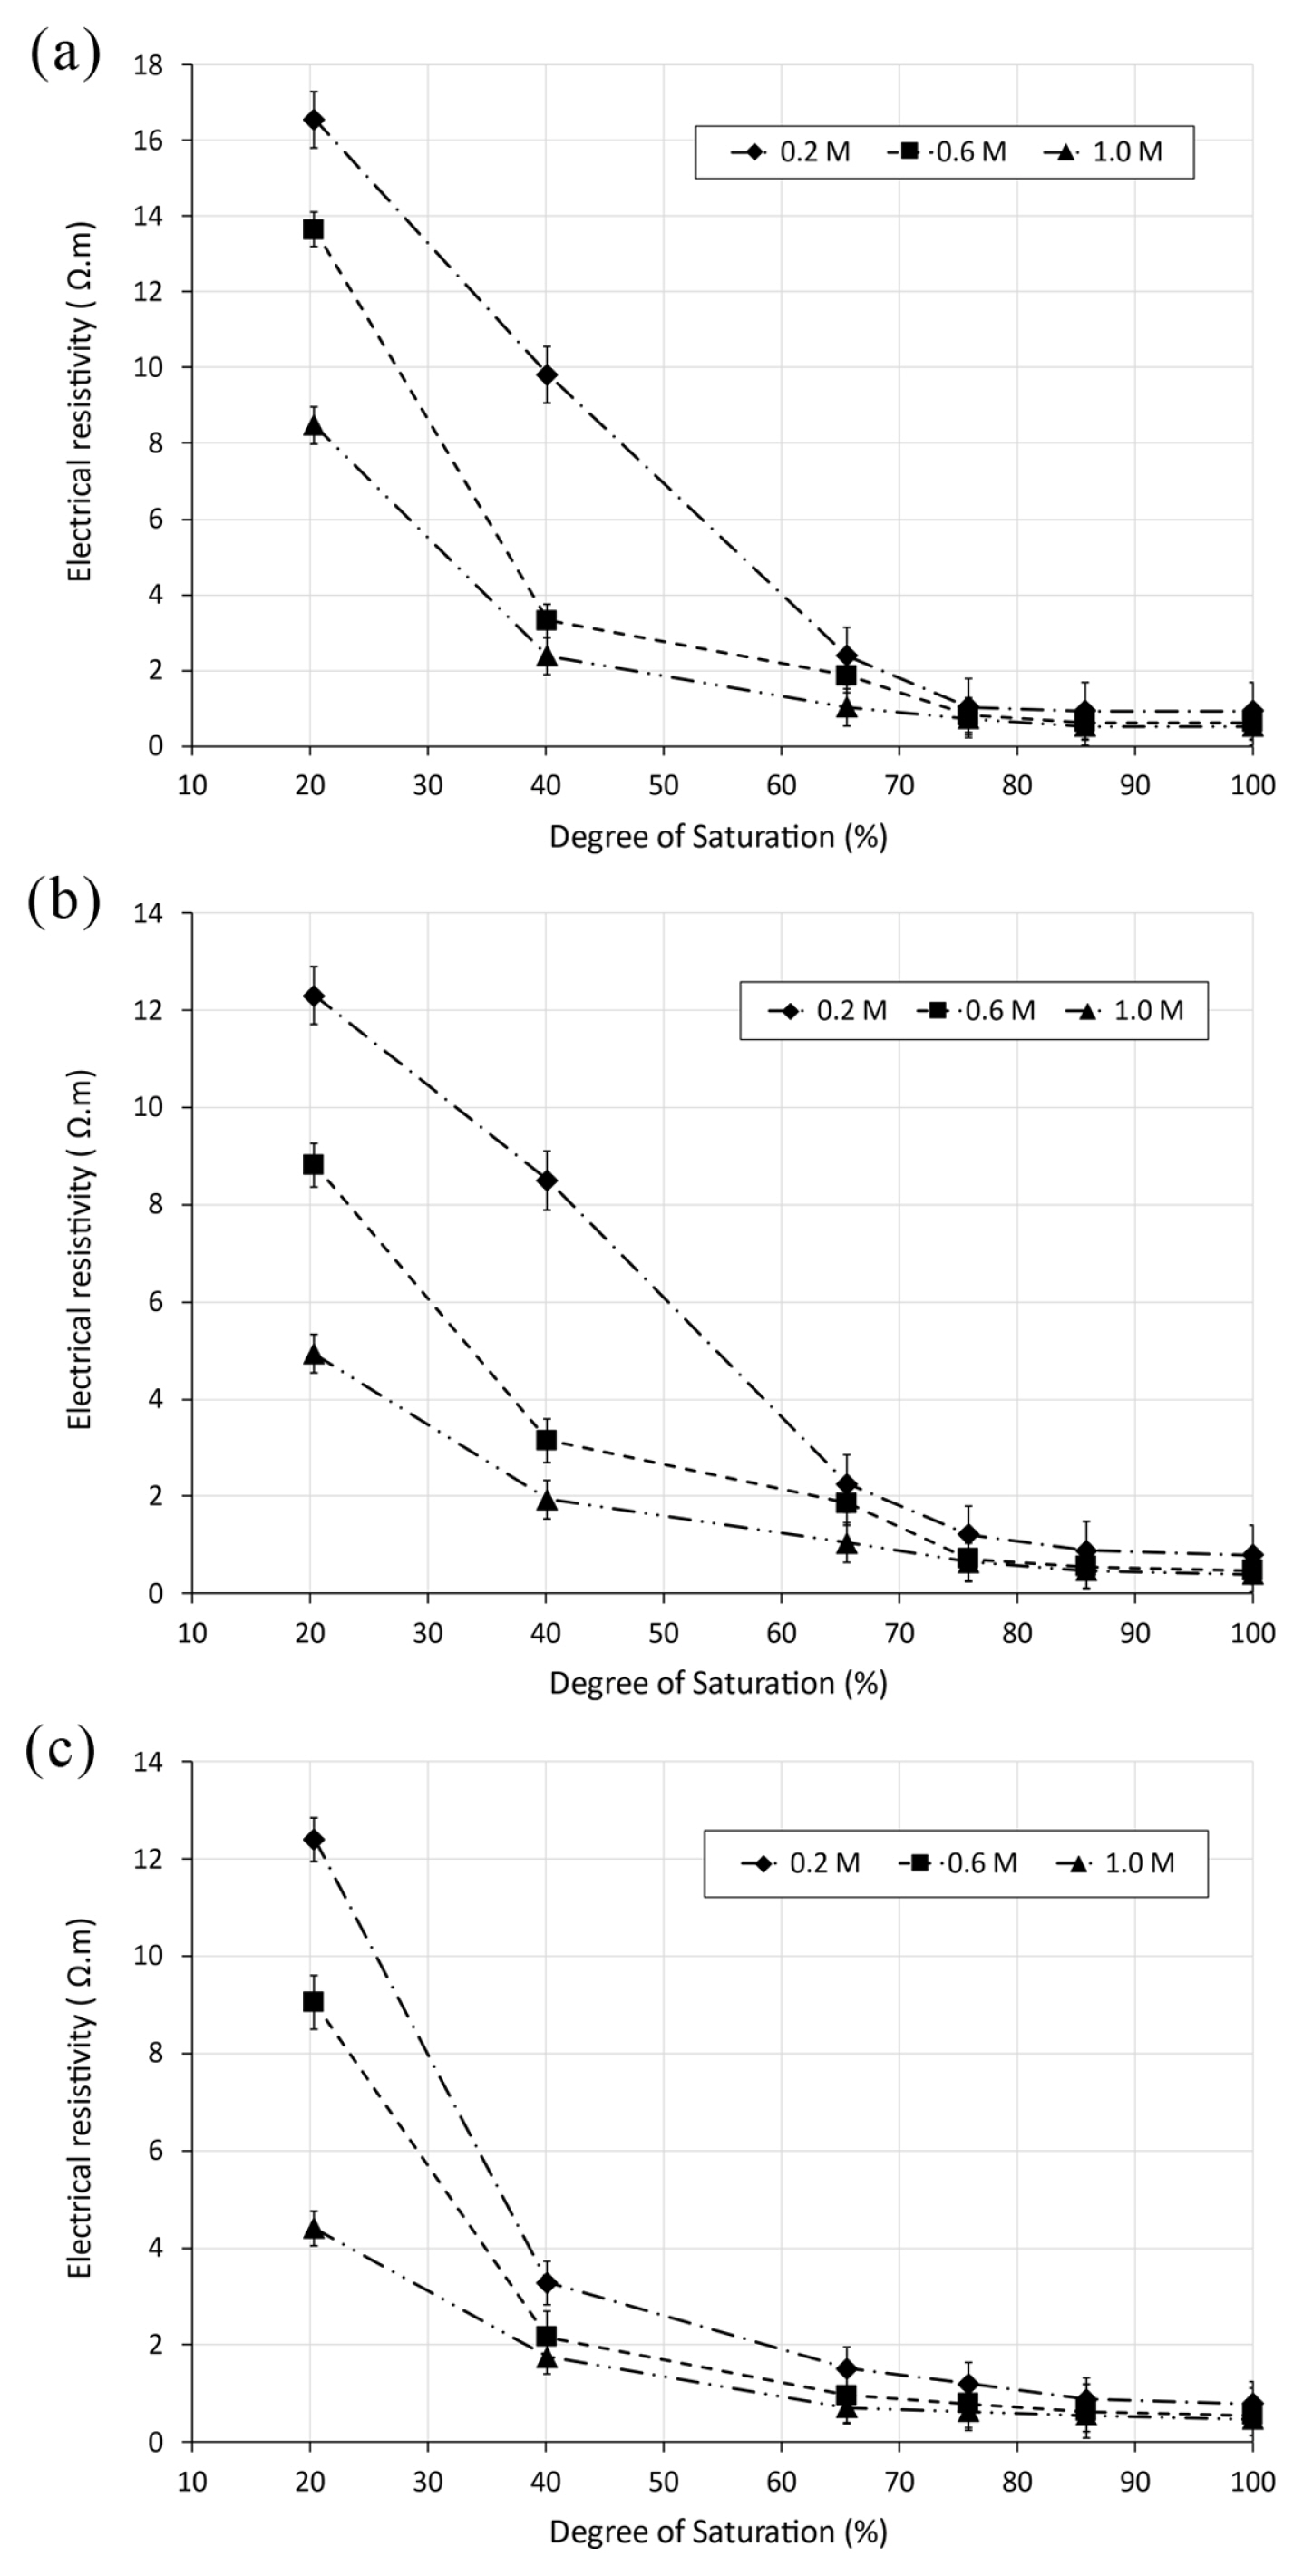
The assessment of the degree of saturation Sr provides important information of soil behaviour. Various investigations have attempted to study the influence of electrical resistivity on water content for soil. Nevertheless, plotting the degree of saturation with electrical resistivity can be used to estimate the water content [44]. In this research, the variation of electrical resistivity as function of the degree of saturation for saline soil samples was investigated. The obtained results are depicted in Fig. 6. It can be observed from these figures a gradual diminution in electrical resistivity with the increase of the degree of saturation for different soil specimens mixed with saline solutions NaCl, KCl and MgCl2 at different concentrations of 0.2, 0.6 and 1 M. According to the test results, electrical resistivity is reduced from 16.8 to 1 Ωm for saline soil sample at 0.2 M of NaCl, which represents a decrease of initial value of 16.8 times. The observed reductions become smaller with increasing concentrations. The same trend was observed for soil samples mixed with different solutions at different concentrations. The observed decreases ranged between 12.3 and 9.8 times in soil specimens mixed with KCl solution, 12.8 and 5.63 times for MgCl2 solution, respectively.
A strong quadratic correlation between electrical resistivity and degree of saturation of saline soils was identified. It can be described by the following equation:
Where a3, b3 and c3 are the fitting parameters summarized in Table 4.
The maximum strong correlation was noticed for soil specimen with 0.2 M NaCl (R2 = 0.99). The reduction in the degree of saturation is relative to the weakening of bridging between saline soils particles. The dielectric air void increases at lower degree of saturation, involving then the diminution of the linking of the pore network [44,47]. Consequently, the current flux through the soil is restricted by the reduction of moisture connectivity, developing thus high electrical resistivity [44]. Additionally, Fig. 6 shows a sharp reduction of electrical resistivity with increase of salt concentration for all soil specimens. The mixtures of soil with different saline solutions induced high ion concentrations as a result of the release of chloride anions and salt cations in soil solution [37].
5. Conclusions
Soil salinization is an environmental threat that affects soil parameters especially in arid and semiarid regions. The electrical resistivity represents a key factor which can be used to characterize salt affected soils. Additionally, investigating the electrical response is considered as quick, time consuming and non destructive.
In this study, laboratory tests were carried out on soil samples mixed with three types of chloride salts NaCl, KCl and MgCl2 at various concentrations, in order to investigate the effect of soil characteristics on electrical resistivity of saline soil specimens.
An inexpensive setup for measuring the electrical resistivity was developed in laboratory based on Ohm’s law application. The results revealed a big potential of employing the electrical resistivity to predict engineering soil properties. Strong and important relationships between electrical resistivity and saline soils parameters such as water content, degree of saturation and salt concentration, were identified.
Further researches including the use of the mixed solutions of NaCl, KCl and MgCl2 electrolytes with different concentrations, are highly needed for mimicking real soil samples. Moreover, the authors recommended to validate the finding models using additional soil samples originated from different salt affected areas.