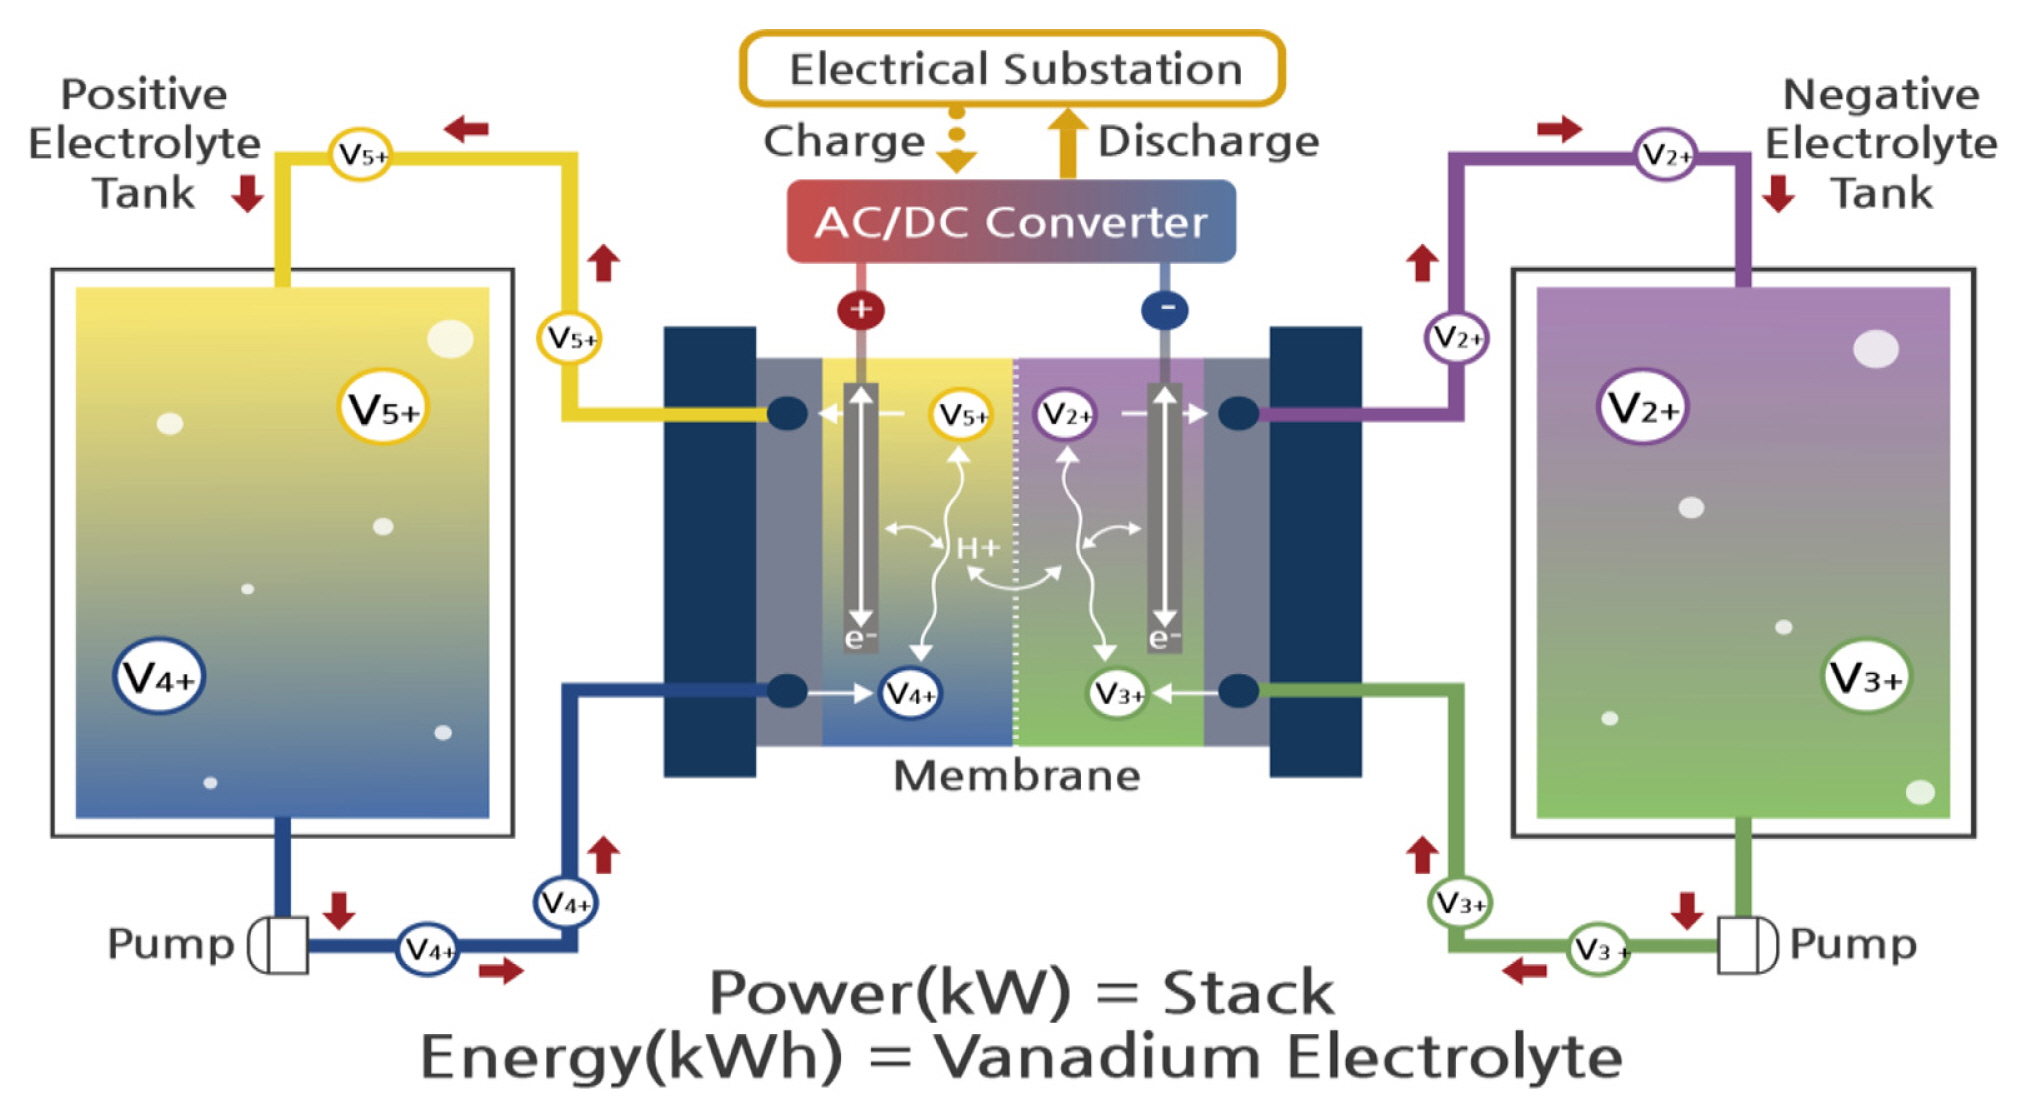
1. Introduction
Recently, the demand for eco-friendly renewable energies increased dramatically due to its environmental issues. However, most of them have their own difficulties such as irregular energy production following unstable energy supply. For those reasons, the energy storage system (ESS) has been required to overcome intermittent power generation. There are various kinds of ESS, such as lithium-ion battery (LIB), sodium-sulfur battery (NaS), and vanadium redox flow battery (VRFB). Among them, VRFB has gotten attention for its long lifecycle, room temperature operation, easy maintenance, and various range of storage capacities, identical solutions for both negative and positive electrodes. However, VRFB has some disadvantages compared to other types of batteries, in terms of power density. Many efforts have been conducted to improve those disadvantages of VRFB [1–18]. Some studies have suggested improving electrolytes for VRFB [1–4]. T. S. Zhao et al. [1] tried to modify electrolyte to increase the power density of VRFB. They showed the effect of Cl− by applying various concentrations of NaCl onto the electrolyte solution. They suggested improved reaction activity of VO2+/VO2+ redox couples resulted in decrease of charge transfer resistance due to the existence Cl−. Moreover, they showed an increase of both energy efficiency and vanadium utilization ratio than those without NaCl additives. They showed the best capacity retention rate after one hundred cycles for the additive concentration of 0.04 M NaCl in their research work. Nataliya et al. [2] showed unbalanced electrolytes better efficiencies than those of common electrolytes from their full cell test results. Yang et al. [3] investigated energy density by different the state of charge of positive electrolyte. Kim et al. [4] observed an increase in performance with methane-sulfonic acid additive into both side electrolyte. Also, research works for ion conducting membranes have also been introduced [5–9]. Reference [5] showed comparison of commercial membranes such as Nafion® 115 and VANADion in terms of ion selectivity. In that reference, it was found that the ion selectivity results in an increase of energy efficiency and the electrolyte utilization. In reference [6] the performance of VRFBs was tested and compared between plasma coated polybiphenylsulfone membrane (P-BPSH) and Nafion® 117. The energy efficiency of P-BPSH membrane is comparable to increase than Nafion® 117 membrane. Moreover, a lot of studies have been performed to enhance membrane ion selectivity. Wan et al. [7] indicated EE and durability increase when applying polybenzimidazole membrane. Zhang et al. [8] investigate membrane applying aryl ether ketone ketone (PyPEKK) for VRFB. Result of the cell test confirmed increased performance and stability to compared nafion 212. In reference [9], energy efficiency of branched polyfluoro sulfonated polymide (BPFSPI) membrane was higher than Nafion 212. Moreover, BPFSPI-10-50 membrane showed the best performance and stability. Many trials to enhance the electrochemical characteristics of carbon felt electrodes for VRFB have been conducted [10–18]. Lim and Lee [10] compared the decrease of total resistance and increased energy efficiency between bipolar plate carbon felt electrode (BP-CFE) assembly and conventional graphite BP. Park et al. [11] modified carbon felt (CF) surface to introduce boron functional group. The electrode with boron functional group increased energy efficiency (EE) by intimating electrolyte reaction on the surface. Shah et al. [12] attempted to modify CF electrode surface by using hydrothermal treatment with ammonium persulfate (APS). The electrochemical characteristics were improved by the ASP comparing that of pristine electrodes so that both energy efficiency and capacity retention ability were increased. Carbon felt through a rapid and low-cost method to develop highly functionalized activated CF with uniformly distributed surface nanocracks (approximately 30~100 nm). In reference [13], the surface electrode nanocraks size was controlled by controlling the process conditions such as different temperature or activation time. They achieved nanocrack size by nitrogen doping. It was seen that the increase of surface area may cause an increase of energy efficiency. Moreover, nitrogen-doped CF achieved higher electrolyte utilization than that of untreated CF. M. G. Hosseini et. al. [14] investigates the effect of both N− and WO3− on electrode performance. They achieved higher electrocatalytic activity, large current density, higher reversibility towards VO2+/VO2+ couple and decreased resistance. Wang et al. [15] tried to increase carbon felt performance with water vapor so that it introduced oxygen functional groups on the electrode surface. The modified electrode showed the best performance at activation time and temperature of 5 min and 700°C, respectively. Ting et al. [16] performed to modify carbon felt surface with various weak acids such as citric acid, oxalic acid, and ethylene diamine tetraacetic acid. The increased oxygen functional groups induced the improved electrochemical activity. The unit cell test results indicated an increase of energy efficiency compared with untreated carbon felt. Wang et al. [17] compared pristine carbon felt, CO2 activated carbon felt, and nitrogen activated carbon felt (N2-CF) at the higher temperature of 1000°C and 30 minutes of activation time. The amount of oxygen functional group introduced on the surface was the best for CO2 activated carbon felt compared to that of pristine and nitrogen activated carbon felts in terms of electrochemical characteristics and energy efficiency. F. González et al. [18] investigate the effect of CO2 and steam during the carbonization process of walnut shell surfaces. It was found that the uniformity of pore distribution and adsorption of carbonized walnut shell surface are dependent on the experiment temperature and activation time. However, the results at the heat treatment temperature of 900°C revealed a decrease of surface area in comparison with that of 850°C. In this paper, we conducted heat treatment on carbon felt electrodes for VRFB with CO2 under various temperatures from 700°C to 900°C with 50°C of differences. The heat treatment time for every case was 8 hours. Enhanced electrochemical characteristics such as increased anodic/cathodic peaks, decreased electrochemical reaction resistance, and higher energy efficiency due to the oxygen functional group introduced on the surface of carbon felts was observed.
2. Experimental
2.1 Carbon felt preparation and activation process
Carbon felts for the electrode of VRFB were prepared at the size of 3 cm × 3 cm and 1 cm × 1 cm for full cell and electrochemical characteristics tests such as CV and EIS. The carbon felt samples were cleaned using ultrasonic cleaner for 30 minutes in D.I water. The carbon felt samples were activated in a tube furnace under CO2 atmosphere. The CO2 gas was humidified through a bubble type humidifier at room temperature. The temperature for electrode activation processes were set as range between 500 and 1000°C. The efficiencies and electrochemical characteristics differences were rarely observed under the activation temperature of less than 700°C. For this reason, the data shown in this paper is the activation temperature from 700°C. The activation temperatures were 700, 750, 800, 850, and 900°C. The activation process was conducted for 8 hours for all cases.
2.2 Electrochemical characteristics test
The 3-electrode system was used to validate the electrochemical characteristics. The Pt-mesh was hired as a counter electrode. The reference electrode for this work was Ag/AgCl electrode. The electrolyte for the 3-electrode system was prepared with 0.025 M VOSO4 under 3.0 M H2SO4 of supporting electrolyte. The voltage scan range for CV test was between 0.5 V and 1.3 V with scan rate of 10mV s−1. The frequency range for the EIS test was from 10 kHz to 10 mHz.
2.3 Unit cell test
Unit cell was made using modified electrodes and Nafion® 117. Electrolytes for both positive and negative electrodes were 1.6 M VOSO4 and 1.6 M V2(SO4)3, respectively. The amount of electrolytes for both electrodes was the same as 40 mL. The flow rate of electrolytes for both positive and negative electrodes was controlled the same as 35 mL min−1. The cut-off voltage set up was 1.6 V and 1.0 V for charge and discharge, respectively at the current density of 60 mA cm−2. Voltage efficiency (VE), coulomb efficiency (CE), energy efficiency (EE) were obtained by equations (1), (2), and (3).
3. Results and Discussion
The weight loss of carbon felt electrodes according to the heat treatment temperature are listed in Table 1. The weight loss was obtained from equation 4.
The weight loss increases with increase of heat treatment temperature as expected. The weight loss according to the treatment temperature was 2.57, 3.17, 4.86, 4.45, and 15.70% for 700, 750, 800, 850, and 900°C, respectively. The dramatic weight loss occurred at 900°C. Fig. 1 shows scanning electron microscope (SEM) images that represent surface changes of carbon felts according to heat treatment temperature change. The SEM images show increased surface pore with increase of heat treatment temperature.
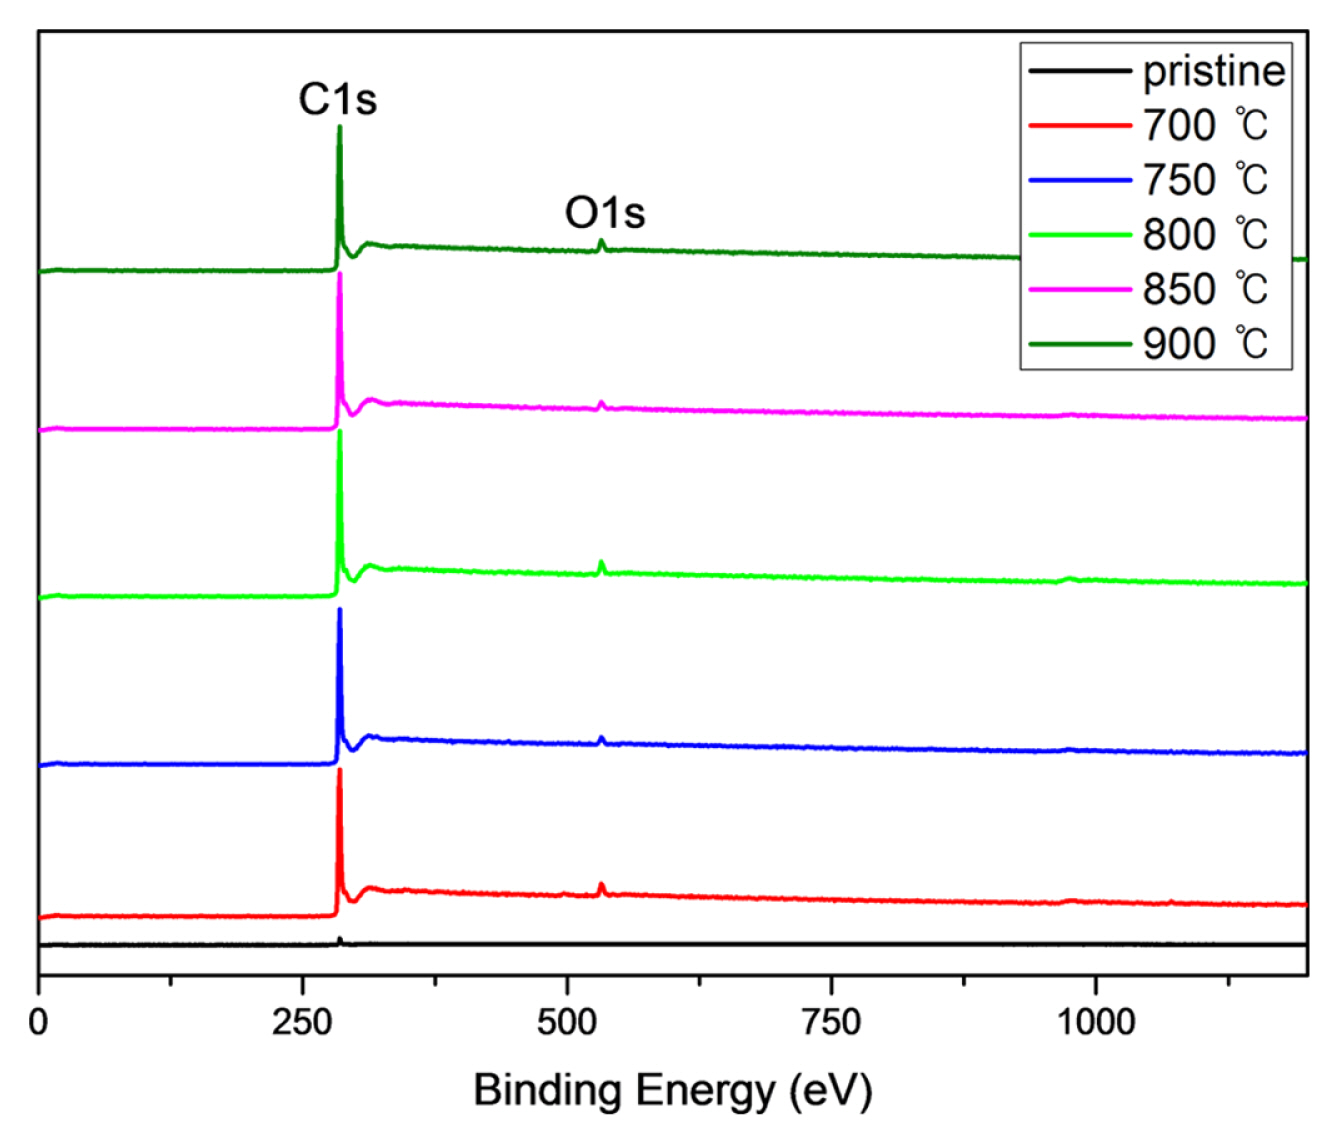
Fig. 2 shows total X-ray photoelectron spectroscopy (XPS) peaks of modified electrodes. It shows increased intensity of C1 and O1 peaks with increase of heat treatment temperature. After that attempted exact analysis for the binding structure of each sample.
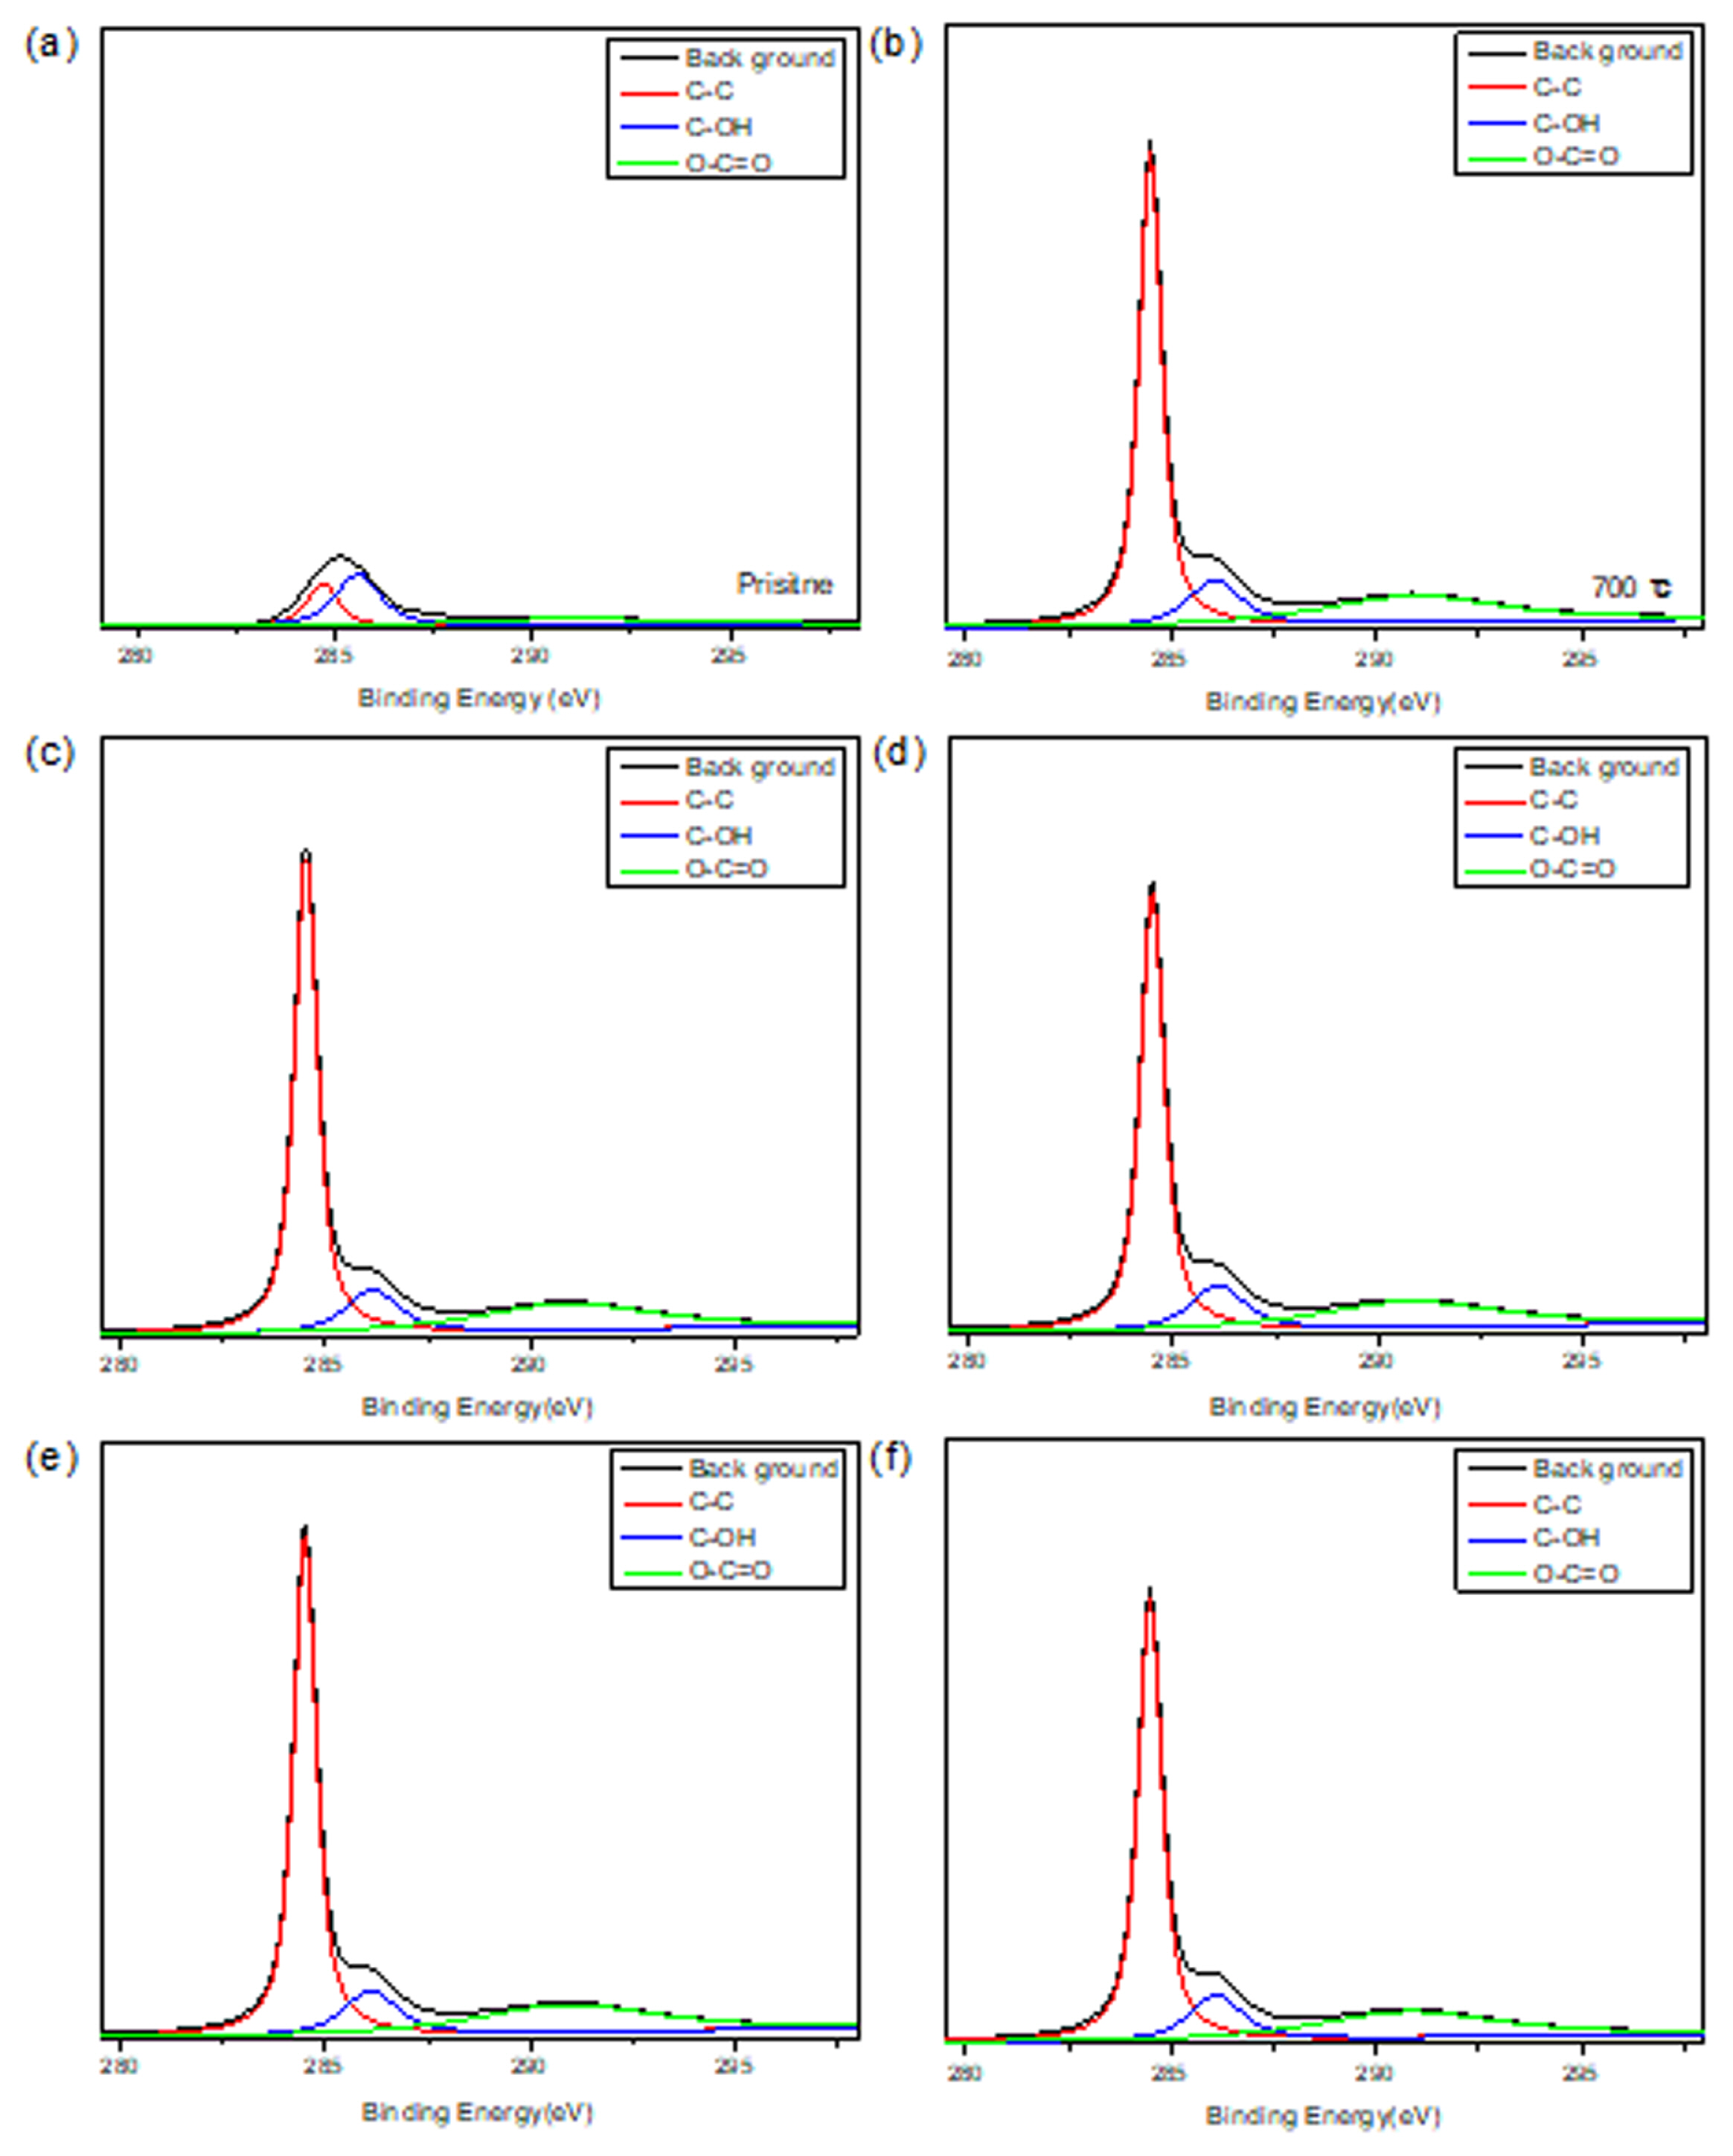
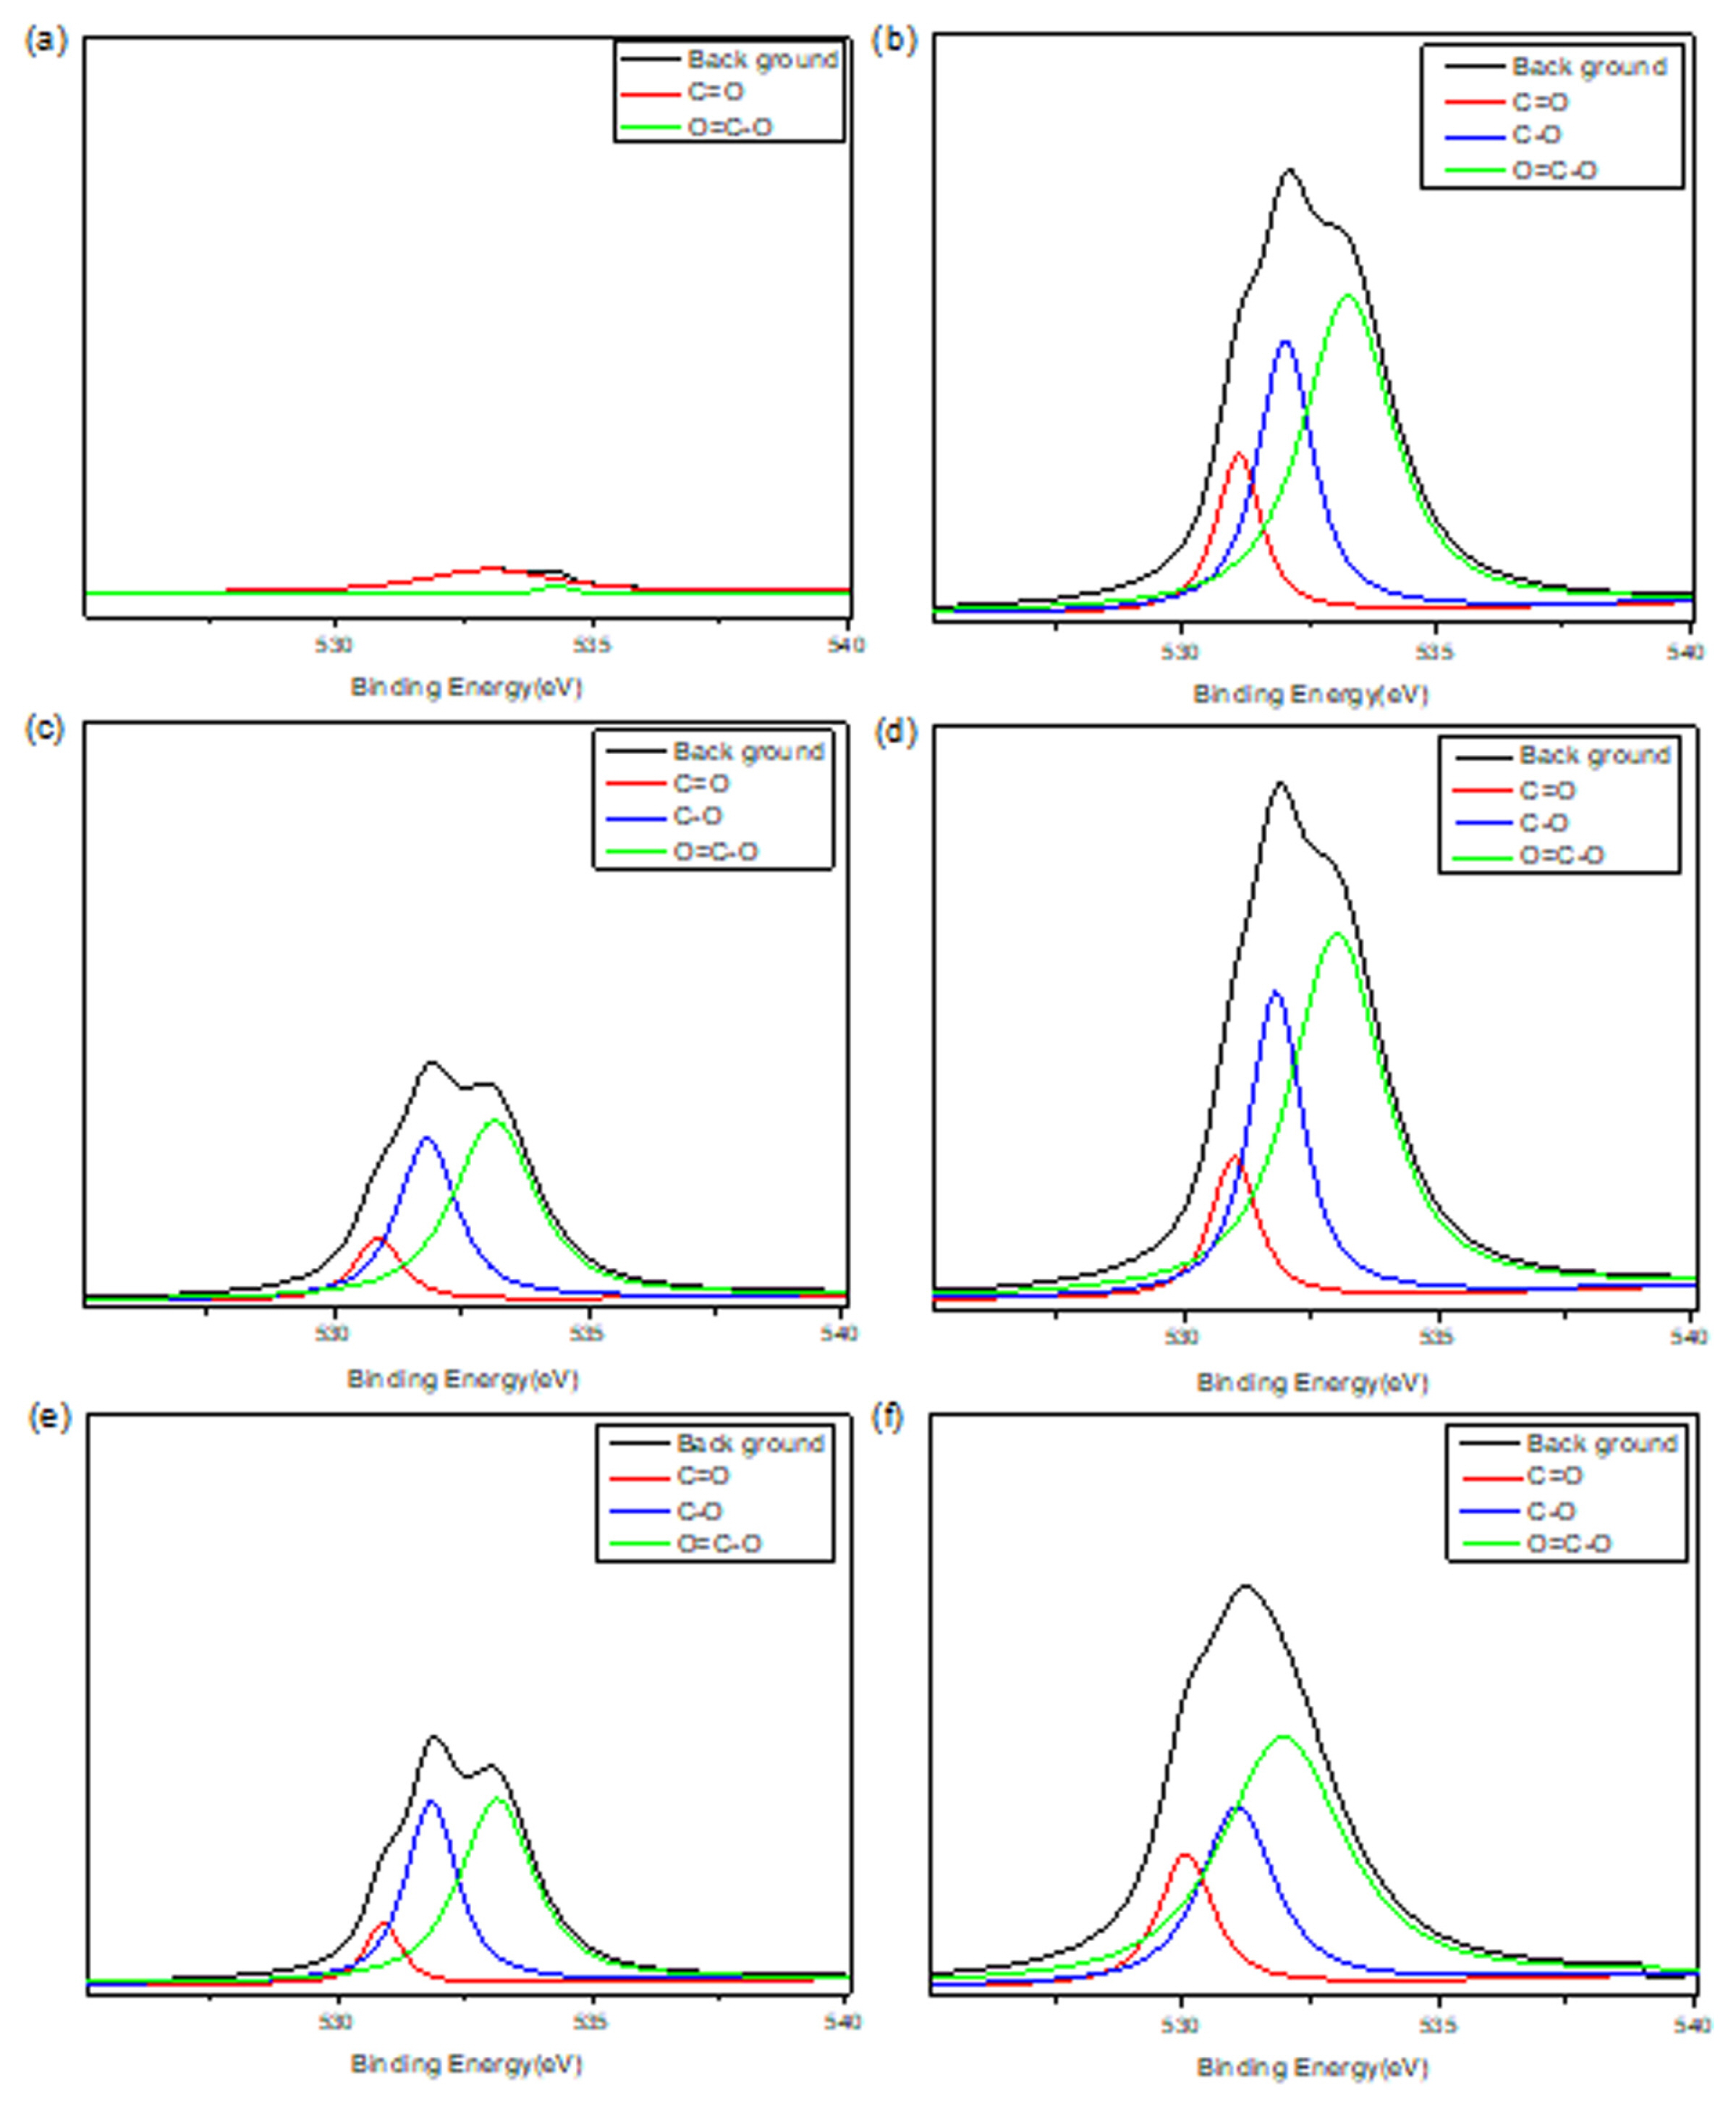
Effort to elucidate quantitative analysis of the effect of heat treatment is shown in Fig. 3. The C1s and O1s peaks shown in Fig. 2 are investigated in Fig. 3 and Fig. 4. The C1s peaks are decomposed according to functional groups, such as C-C, C-OH, and O-C=O and the results are summarized in Table 2. The O1s peaks are decomposed and shown in Fig. 4 and summarized in Table 3. Those results show the fraction of functional groups introduced on the surface was increased with heat treatment temperature increase.
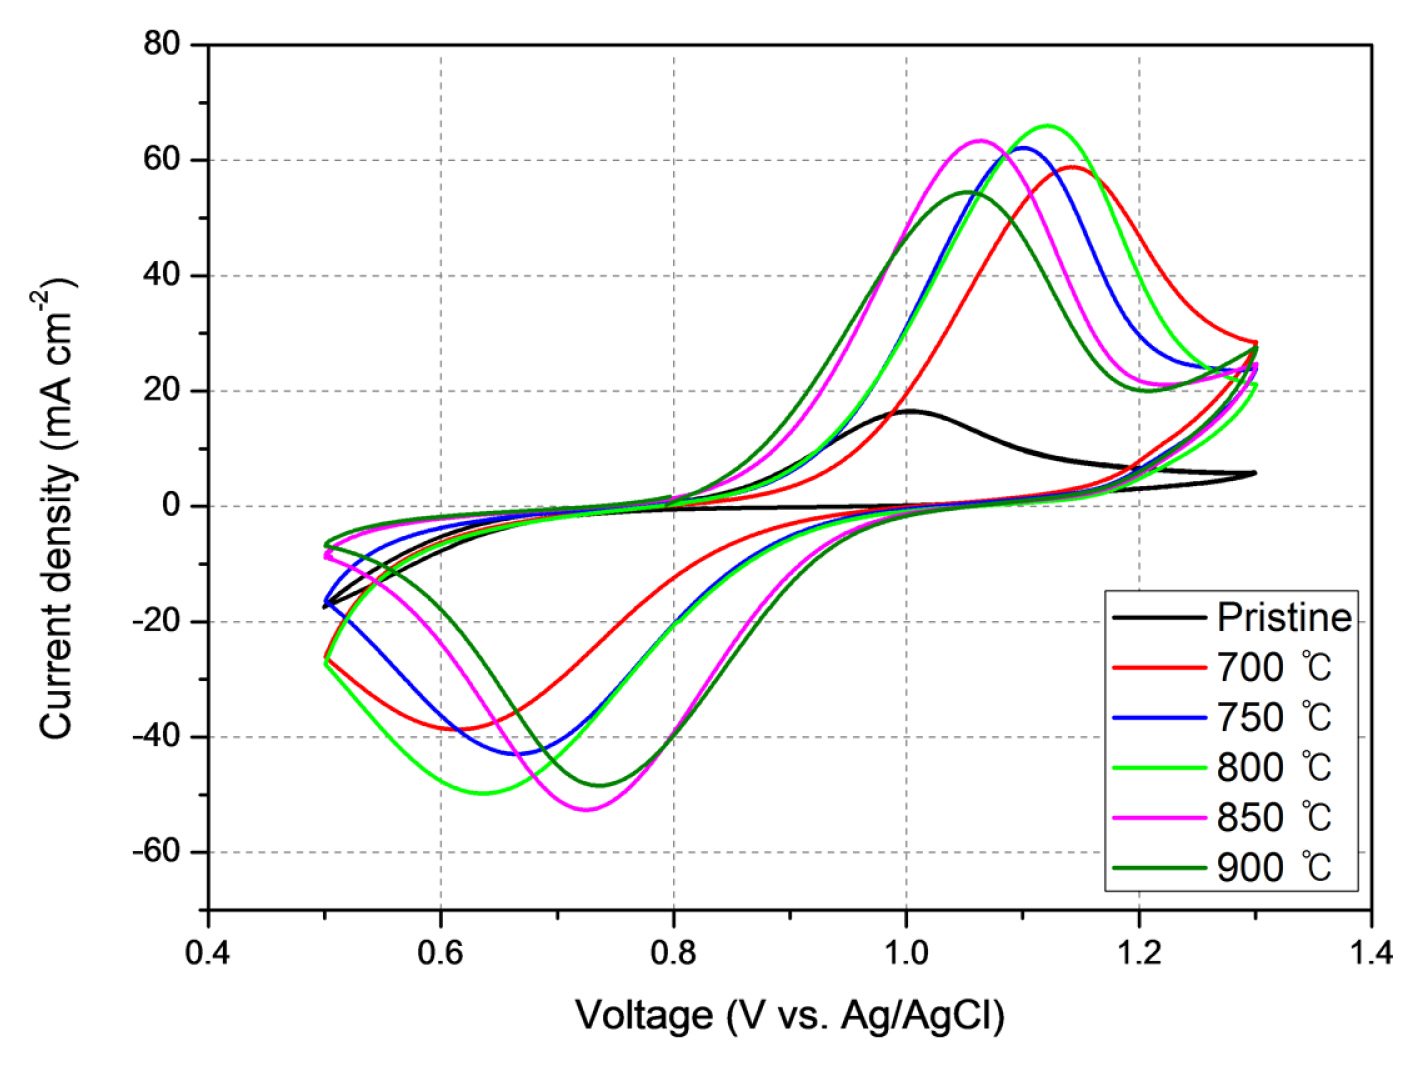
Fig. 5 shows CV results of pristine carbon felt and surface modified carbon felts. The oxidation peaks current density (Ipa) were 59.35, 62.52, 65.97, 63.39, and 54.48 mA cm2 for the pristine CF and heat treatment temperature of 700, 750, 800, 850, and 900°C, respectively. The oxidation peak for pristine CF was insignificant, 16.53 mA cm−2. The oxidation peak current densities increased with heat treatment temperature below 800°C then began to decrease from 850°C due to weight loss. The magnitude of reduction peaks current density (Ipc) were −38.7, −42.95, −49.78, −52.61, and −48.43 mA cm2 for the temperature of 700, 750, 800, 850, and 900°C, respectively, while that of pristine CF is not observed. The magnitude of reduction peak current densities increases with increase of heat treatment temperature below 850°C. The oxidation/reduction peak ratio |Ipa/Ipc| increases with heat treatment temperature. The values are following: 0.65, 0.69, 0.75, 0.83, and 0.89 for heat treatment temperature of 700, 750, 800, 850, and 900°C, respectively. The voltage difference between oxidation and reduction (Epa - Epc), which represents reversibility. was decreased with experiment temperature 0.53, 0.44, 0.49, 0.34 and 0.32 V at 700, 750, 800, 850 and 900°C, respectively. However, both the oxidation and reduction peak current densities at 900°C was very small due to serious weight loss at that temperature. The best CV data was obtained at 850°C in terms of magnitude of peak current density, electrochemical reactivity, and potential difference, reversibility. The results of CV data were summarized in Table 4.
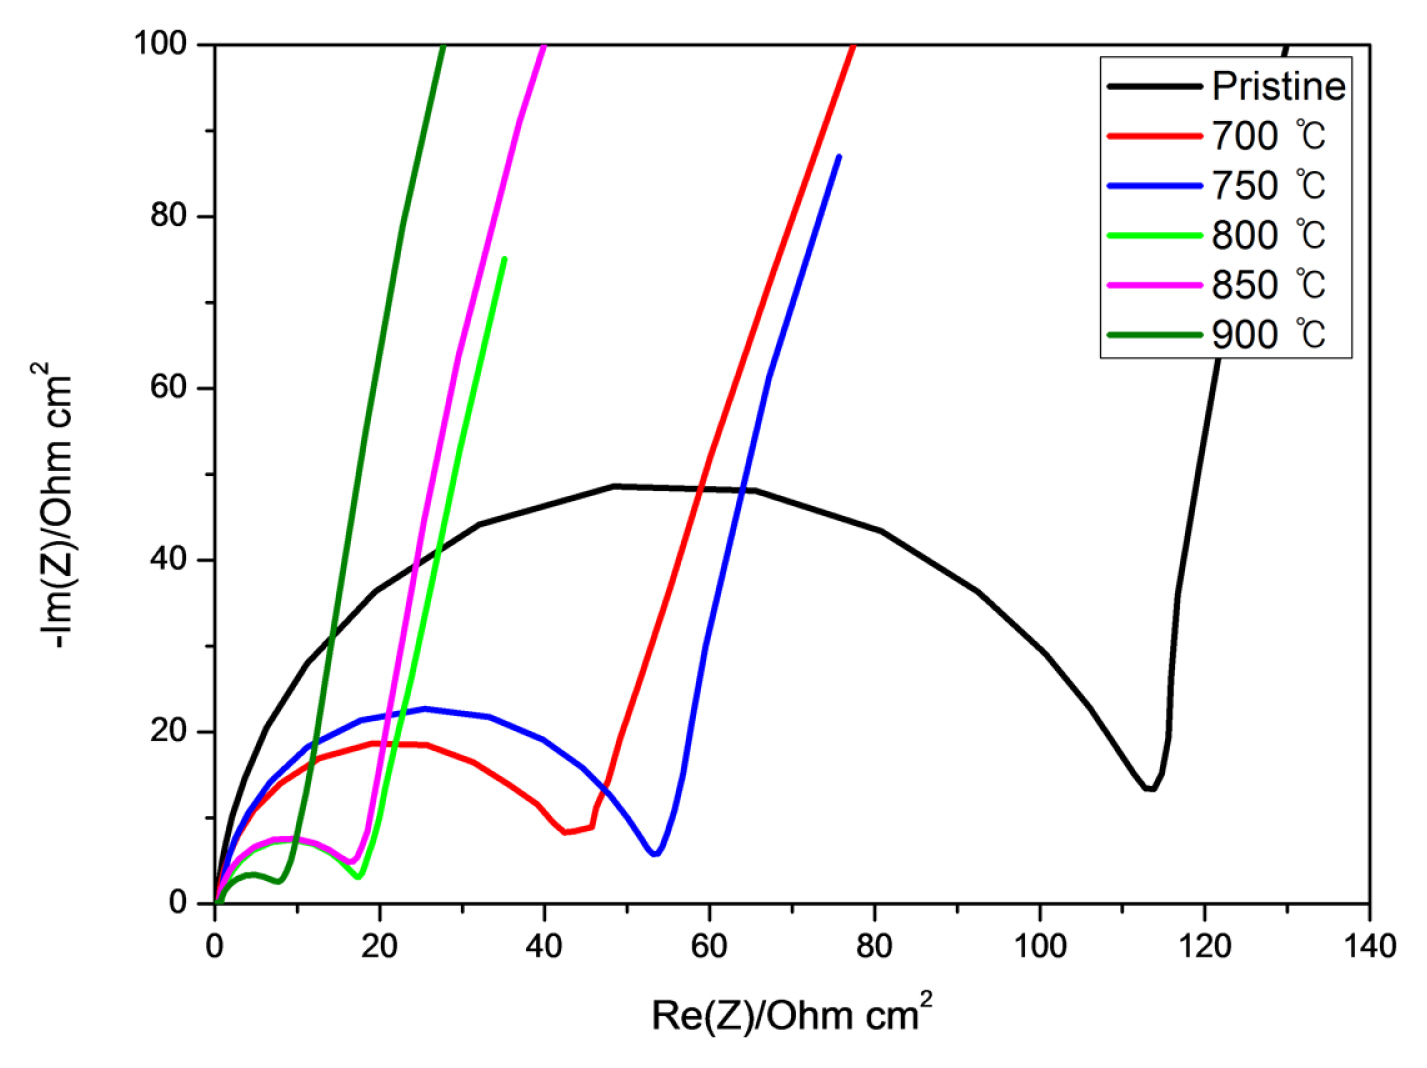
Fig. 6 shows EIS analysis comparison of pristine carbon felt and those of heat treatment temperature of 700, 750, 800, 850 and 900°C. The charge transfer resistance (Rct), the diameter in the figure which means, decreased with increase of heat treatment temperature, while the electrode surface resistance (Rs), the x-intercept in the figure which means the solution resistance, for all cases show similar values. It indicates the functional groups on the surface contributed to mitigate reaction.
The unit cell test results of the heat treated carbon felts are shown in Fig. 7,. The energy efficiencies are 69.37, 78.17, 80.76, 82.45, and 75.47%, for the heat treatment temperature of 700, 750, 800, 850, and 900°C, respectively. Also, the IR drops are 0.38, 0.25, 0.23, 0.20, and 0.23 V at 900°C, for the heat treatment temperature of 700, 750, 800, 850, and 900°C, respectively. The efficiencies and IR drops are compared and listed in Table 5. The best EE and IR drops were obtained at 850°C instead of that of 900°C. These represent that although the functional group portion was increased with heat treatment temperature, severe weight loss at 900°C resulted in reaction sites loss on the surface. The results were also verified at CV test results in Fig. 5.
4. Conclusions
The effect of surface treatment under the CO2 atmosphere has been investigated. The XPS analysis data represent the result of increased carbon and oxygen functional groups with increase of temperature. The improved electrochemical characteristics with increase of heat treatment temperature was proven up to the temperature of 850°C. However, at the temperature of 900°C, the weight loss resulted in lower efficiencies obtained from the unit cell test. The best electrochemical characteristics were obtained at the temperature of 850°C. Both CV and EIS data reveal increased performance as electrodes. The unit cell test data show the increase of energy efficiency with increase of treatment temperature up to 850°C. The energy efficiencies according to treatment temperature were 69.37, 78.17, 80.76, 82.45, and 75.47%, for the treatment temperature of 700, 750, 800, 850, and 900°C, respectively.