The Effect of the Anode Thickness on Electrolyte Supported SOFCs
Article information
Abstract
Planer-type electrolyte substrates are often utilized for stack manufacturing of electrolyte-supported solid oxide fuel cells (ES-SOFCs) to fulfill necessary requirements such as a high mechanical strength and redox stability. This work did an electrochemical analysis of ES-SOFC with different NiO-YSZ anode thicknesses to find the optimal value for the high performance of the fuel cell. The cell resistivities were constant at anode thickness between 25–58 μm, but a thick anode (74 μm) caused a high electrode resistivity leading to a dramatic reduction in cell performance. A stability test was performed for 50 hours at 700°C, and the results showed a degradation rate of 0.3% per 1000 h by extrapolated fitting.
1. Introduction
Fuel cells are an electrochemical energy conversion device converting chemical energy to electric energy, and they have a low emission, are packable, and can be modulated [1]. Among the various types of fuel cells, solid oxide fuel cells (SOFCs) are a promising technology for clean energy sources due to their high efficiency, excellent fuel flexibility, and low environmental impact [2]. The SOFCs generally are operated at high temperatures (> 600°C) and do not require precious metals as catalysts. Moreover, they could allow for direct internal reforming of various fuels without a reformer by adjusting the structure and/or material development [3,4].
Anode materials for SOFCs have commonly utilized nickel and yttria stabilized zirconia (Ni-YSZ) cermet due to its sufficient electron/oxygen-ion conductivity, high catalytic activity, and good mechanical/chemical compatibility with other components [5]. Ni with more than a 35 vol% should be contained in the anode components to fulfill the specific requirements of electronic conductivity and a sufficient catalytic activity. However, some researchers have reported problems such as delamination and broken cells that occurred by thermal cycle intolerance in high Ni loading components due to coefficient of thermal expansion (CTE) mismatch of the Ni and other components [7–10]. Even though the Ni-YSZ cermet is under a reducing condition containing a large amount of hydrogen during operation at high temperature, Ni still can be oxidized partially by water as a byproduct that occurs from Ni agglomeration and even critically damage the cell. The anode supported cell (ASC) is the most studied recent SOFC type, but it has a few disadvantages including limited gas diffusion, a vulnerability to mechanical properties due to the thin electrolyte and thick anode, and a complicated fabrication process [11,12]. Therefore, electrolyte-supported solid oxide fuel cells (ESSOFCs) are preferred over an ASC in terms of mechanical durability against the redox cycle because the structural design of the ES-SOFCs provide a thick electrolyte with a thin electrode that can withstand the destruction of a cell from a crack even occurred by Ni redox in the anode [13–16].
The Ni-YSZ anode layer consists of a porous microstructure with three phases: an electronically conductive Ni phase, an oxygen ionically conductive YSZ phase, and a pore phase for gas diffusion. Electrochemical reactions accompanied by transport phenomena occur at these three-phase boundaries (TPBs) and mainly appear at the closed electrolyte side rather than far away from the electrolyte due to the lower ionic conductivity of the YSZ electrolyte than the electronic conductivity and gas diffusion [17–19]. For ES-SOFCs, anode thickness is one of the important parameters that affects cell performance due to the above reasons, but its systemic electrochemical study is rare.
In this study, an ES-SOFC was fabricated consisting of a YSZ electrolyte, 10 mol% Sm doped CeO2 and La0.6Sr0.4Co0.2Fe0.8O3-δ (SDC-LSCF) electrodes, and a (SDC) buffer layer. The electrochemical performance was examined with various anode thicknesses using the current-voltage curve. We provide the polarization properties and cell stability for 50 h at 700°C.
2. Experimental
2.1 Sample preparation
ES-SOFC cells, LSCF-SDC/SDC/YSZ/Ni-YSZ, with various anode thicknesses were fabricated in this study. The YSZ electrolyte disk (a thickness of 250 μm and a diameter of 2 cm, Thermotek) and the commercial powders LSCF-SDC (5:5 wt%, Kceracell), SDC (Kceracell), NiO-YSZ (6:4 wt%, Kceracell), and La0.6Sr0.4CoO3 (LSC, Kceracell) were used for the cell preparation. The YSZ electrolyte disk was rinsed in deionized water and ethanol several times to remove any unintended impurities on the surface. NiO-YSZ, SDC, LSCF-YSZ, and LSC pastes were prepared to mix the powder and ink vehicle of 441(Ferro, Country) at a mass ratio of 7:3.
The anode electrode was formed using the NiOYSZ paste on the YSZ disk by a screen-printing method followed by heat-treatment at 1450°C in ambient air for 10 h with a heating and cooling rate of 5°C/min. In the screen-printing process of the anode, the thickness was controlled using various masks with 20~100 μm depths and a same active area of 0.5 cm2. The SDC buffer layer was screen-printed using a 10 μm depth mask with an area of 0.76 cm2 to the YSZ disk, which is the opposite side of the anode, and then sintered at 1100°C in ambient air for 1 h. The LSCF-SDC cathode was also screen-printed with a 40 μm depth mask with an active area of 0.5 cm2 on the SDC buffer layer and was sintered at 1100°C in ambient air for 2 h. The current collecting layers, the NiO and LSC, were prepared on the top surface of the anode and cathode by brushing on the NiO and LSC pastes, respectively.
2.2 Single cell performance tests and microstructure analysis
A single cell was sealed on the anode side of an alumina tube with sealant (Ceramabond 552, Aremco). The loaded sample was then placed inside a furnace and heated at 800°C at the rate of study of effect of 5°C/min in ambient air after the heat-treatment according to the supplier’s instructions for the sealant. After the N2 purging process, 3% humidified H2 was supplied with a flow rate of 100 mL/min to the anode and maintained for a few hours to fully reduce the NiO to Ni metal. Both input/output gas flows of H2 on the anode side were monitored by a mass flow meter to confirm the sealing of the cell. On the other hand, the cathode was supplied with synthetic air with a flow rate of 200 mL/min. The cell performance was evaluated by measuring the current-voltage (I–V) curves in a temperature range of 600~800°C with 50°C intervals. I–V curves were collected at a rate of 50 mV/sec from the open circuit voltage (OCV) to 0.3 V. AC electrochemical impedance spectroscopy (EIS) was measured using ZIVE MP5 at OCV in a frequency range of 106~1 Hz with a 10 mV amplitude. The short-term stability of a single cell was examined at 700°C for 50 h under a constant bias of 100 mA/cm2. Microstructural characterization of the ES-SOFC cells was performed by a field emission scanning electron microscope (FE-SEM, Hitach S-4300) at an acceleration voltage of 10 kV after a Pt coating by sputtering.
3. Results and Discussion
Fig. 1 shows the cell images of each step of the cell fabrication process. The cells were prepared using the rained YSZ electrolyte with 250 μm by followed sintering from high to low temperature in order of the NiO-YSZ anode, SDC buffer layer, and LSCF-SDC cathode. The fabrication process of all samples was the same except for the anode thickness. The active area of both the anode and cathode was 0.5 cm2 with a 0.8 cm diameter. The NiO and LSC as current collectors were deposited on the top surface of the anode and cathode, respectively.
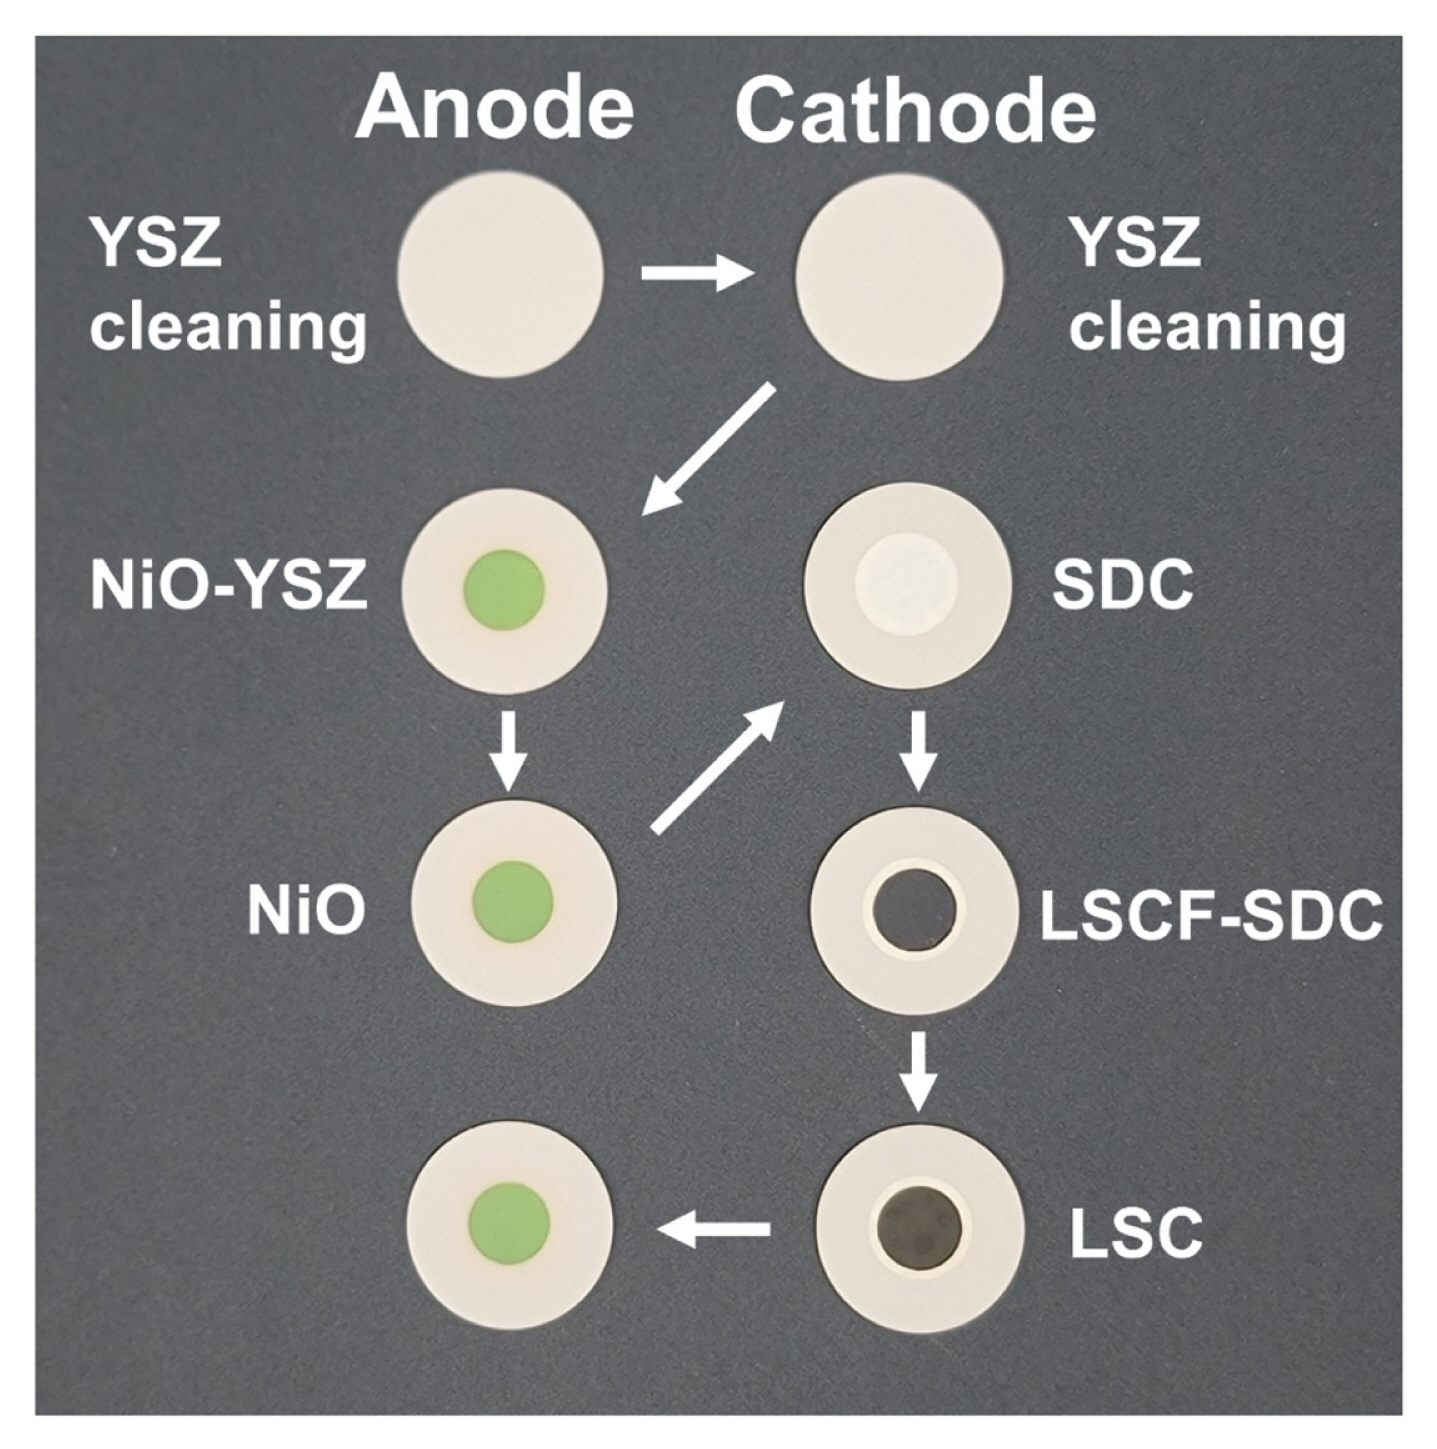
Image of the single cell fabrication process of the ES-SOFC.
Fig. 2 shows a cross-sectional microstructure of the ES-SOFC cell after operating at 800°C. The thicknesses of the anode current collector, anode, electrolyte, buffer layer, cathode, and cathode current collector were estimated to be 110, 45, 250, 15, 38, and 110 μm, respectively, based on the SEM image. The thick and dense electrolyte without cracks and pinholes satisfied the essential requirement of mechanical strength for the cell. The various thicknesses of the anode for all samples were measured before the electrochemical tests by a Digimatic Micrometer (Mitutoy), and the results are listed in Table 1. No remarkable change in anode thickness before and after the tests was observed for all the samples. As can be seen in the high magnitude images, the interface between the anode/electrolyte and cathode/buffer layer/electrolyte shows good adherence. The anode has a highly porose microstructure of a reduced Ni-YSZ layer suggesting that it can provide a sufficient gas transport pathway. In addition, the Ni-YSZ particles are roughly 1 μm in size and well distributed homogeneously on the entire anode to provide good networking for electron and oxygen ion transportation. The morphology of the SDC buffer layer was much denser than that of the Ni-YSZ anode. On the other hand, the particle size of LSCF-SDC in the cathode was smaller than that of Ni-YSZ. This observation might be associated with the lower sintering temperature of the cathode compared to the anode.

Cross-sectional SEM image of the ES-SOFC after electrochemical testing: (top images) cathode side and (bottom images) anode side.

The anode thicknesses of the ES-SOFCs
The effect of the thickness optimization of the anode was investigated by measuring the impedance spectra at OCV with a 10 mA amplitude. The impedance results of all samples were replotted as the area specific resistance shown in Fig. 3. The offset values at a high and low frequency are typically related to the ohmic (Rohm) and total cell resistance (Rtot), respectively, shown in Fig. 3(a). In addition, the value of the difference between the offsets at high and low frequency is like both ends of the semicircle (see Fig. 3(a)) that belongs to the electrode resistance (Rel). The Rtot of the S1~S6 cells was less than 1.25 Ω cm2 while the S7 cell had the highest value of around 1.73 Ω cm2. This significant increase in Rtot of the S7 cell mainly could have occurred by Rel which could be attributed to the long pathway of gas diffusion due to the thick anode thickness of 74 μm. In addition, the thick anode layer also can have a great impact on the unintended change of the microstructure in terms of its densification, agglomeration, and optimal porosity range. Fig. 3(b) shows the resistance of all the cells depending on the anode thickness. The Rohm values of the samples from the S1 to S7 cells were 1.24, 1.22, 0.93, 1.11, 1.18, 1.24, and 1.73 Ω cm2, respectively, which were constant regardless of the anode thickness. However, the Rel value was constant with the increasing Ni-YSZ thickness until 58 μm and then dramatically increased with the thick anode of 74 μm. A low Rtot was observed in the middle range of the anode thicknesses between 38~58 μm suggesting that the anode thickness is an important parameter for obtaining a high cell performance.
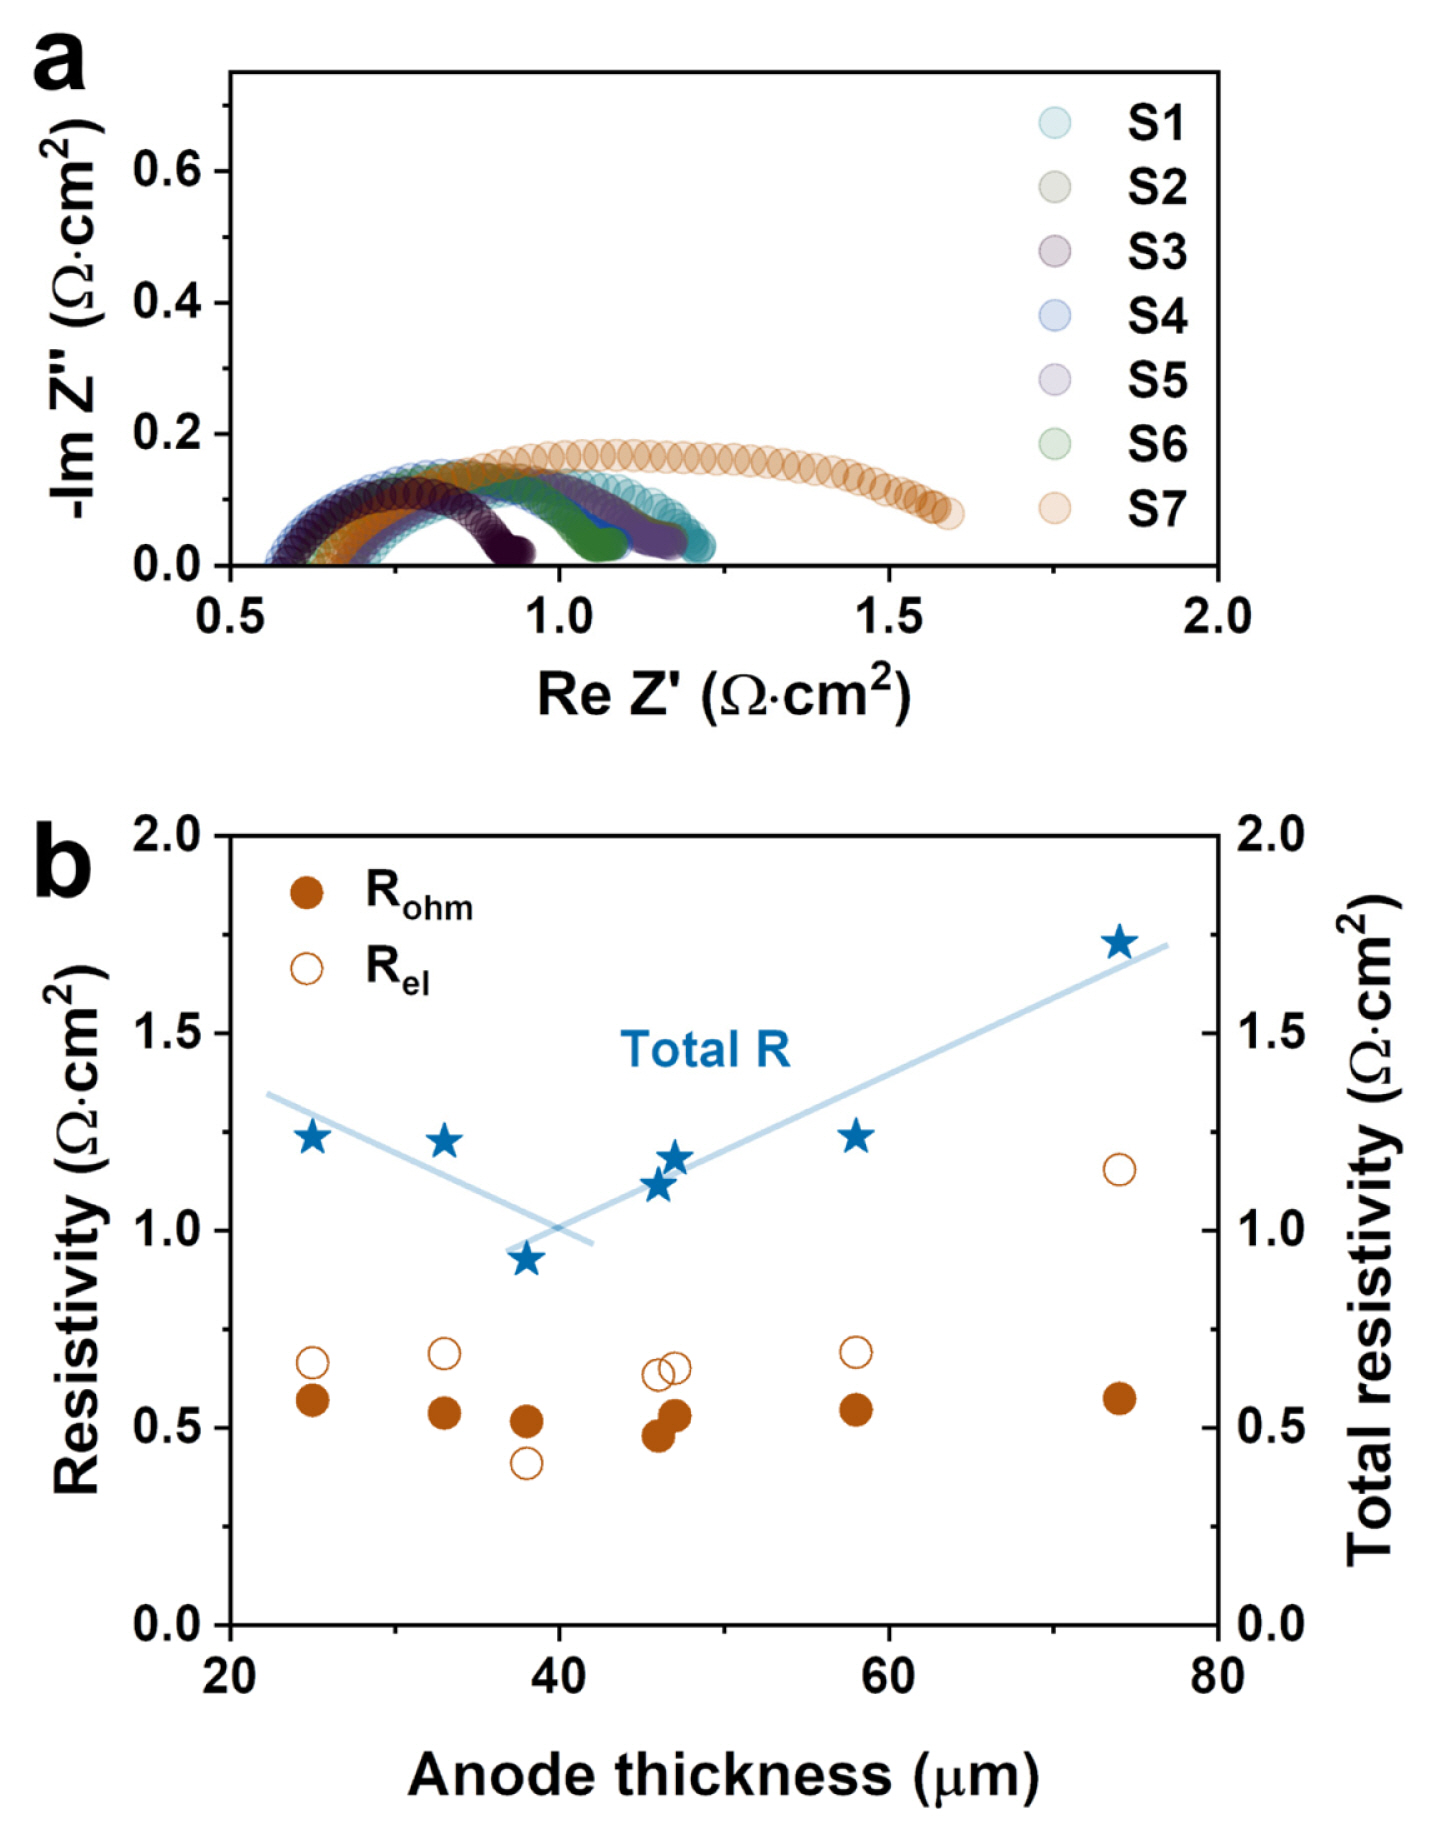
(a) Impedance spectra and (b) current-voltage curves of the single cells with different anode thicknesses at 800°C.
To explore this electrode reaction, the distribution function of the relaxation time (DRT) of the impedance spectra was used. The DRT method has been widely used to analyze the impedance spectra obtained from SOFCs because it gives information directly about the impedance related reactions without any prior assumptions on the individual reactions [20,21]. The deconvolution theorem enables or g(v) to be computed by element-wise division of the Fourier transform F( ) as follows:
By using t̂ = ln (ω/ωo), the analogous function defined as g(ω) represents the product t̂ = ln (ω/ωo).
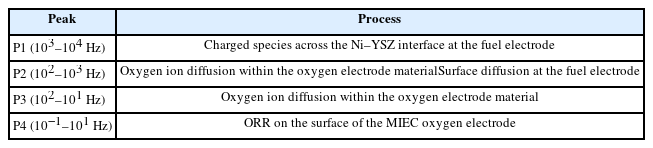
The distribution function that was calculated from the extrapolated imaginary part of the impedance is shown in Fig. 4. Whereas the polarization processes overlap in the impedance curve, several processes can be clearly distinguished in the distribution. For the DRT plots as a function of the frequency, four peaks were identified, and Table 2 presents the details for the electrode polarization processes [22,23]. Four peaks can be observed in the DRT analysis, namely the P1 to P4 regime from high to low frequency. According to the DRT results, most samples showed the highest peak intensity of P1 indicating that ionic transport on the anode side can strongly affect the cell performance. The S7 sample showed large P2 and P3 peaks at the characteristic frequency range related to oxygen ion diffusion, suggesting that the thick anode layer may be a factor in interrupting ion diffusion. In addition, in the measured frequency range, the integral region is the largest in the S7 sample, which is consistent with the largest electrode impedance values, Rel, in Fig. 3.
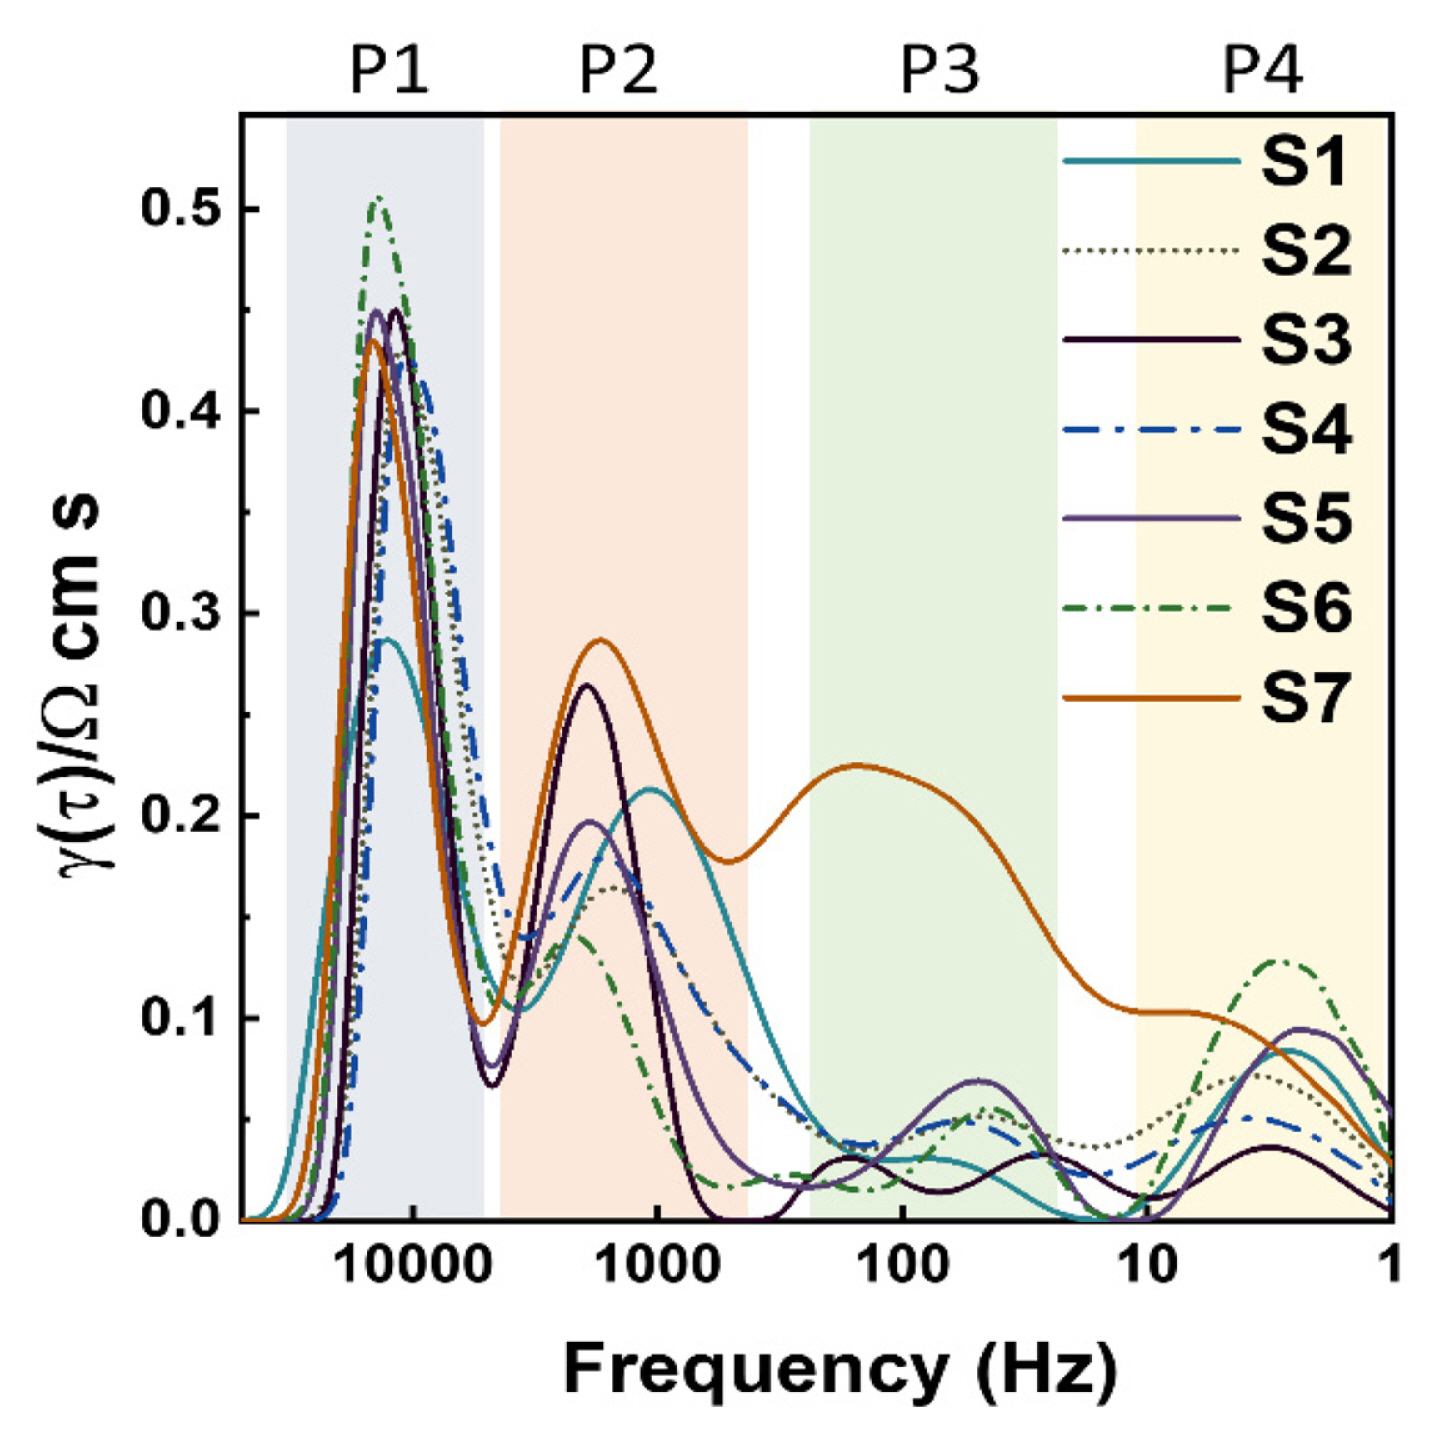
DRT spectra with different anode thicknesses at 800°C for the ES-SOFCs.
The electrode processes of the ES-SOFCs
Fig. 5 shows the cell performances of the ESSOFCs evaluated at 800°C using air as the oxidant gas and 3% humidified H2 as the fuel gas. Every single cell consisted of a 250 μm thick YSZ electrolyte substrate sandwiched between Ni|Ni-YSZ as the anode side and SDC|LSCF-YSZ|LSC as the cathode side. The current collectors, Ni and LSC, were prepared to have the same area with the anode and cathode. The OCV of the cells was in the range of 1.08 to 1.12 V, except for the S1 sample with 1 V, measured across the single cells. This phenomenon of an OCV drop probably occurred due to gas leakage on the anode side because only the S1 sample had a value of 98% while others were close to 100% for the results of the leakage test which used the difference in the H2 gas between the input and output. Fig. 5(a) presents the I–V and peak power density curves of the ESSOFCs recorded at 800°C. For all single cells, no remarkable concentration loss was observed in the IV curves suggesting that the gas diffusion through the pores of all the sintered layers is sufficient within the limiting current. Fig. 5(b) shows the collected peak power density of the cells with the different anode thickness listed in Table 3. The maximum power density of the S3 cell achieved the highest value of 388 mW/cm2 among the ES-SOFCs with the 38 μm thick Ni-YSZ. To the best of our knowledge, such a high-power density in an ES-SOFC tested under a similar condition has not yet been reported in the open literature. The trend of the power densities according to the anode thickness is quite similar to the opposite of the resistance in Fig. 3(b), considering the low OCV of the S1 cell due to the small leakage on the H2 fuel side. This result indicates that the maximum performance depends mainly on the ohmic polarization while the activation and concentration effects are minor.

Current-voltage curves and peak power density of the cells with different anode thicknesses measured at 800°C.
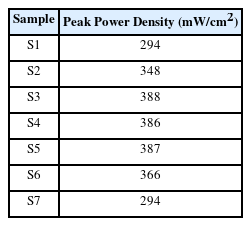
The peak power density of the ES-SOFCs
The current-voltage curves of the S3 cell, which shows the highest performance with the lowest resistance, were measured in the OCV range up to 0.3 V at 800~600°C with decrements of 50°C shown in Fig. 6(a). The OCV was slightly increased from 1.09 to 1.11 V, which is close to the theoretical values [24], as the temperature was decreased from 800 to 600°C, and this result suggests that sufficient gas-tight sealing was successfully achieved. The I–V curve at the measured temperature shows a linear feature, and its slope is steep with the decreasing temperature leading to a decreased cell performance and reaching the limit of the current density. The cell achieved peak power densities of 388, 266, 170, 98, and 51 mW/cm2 at 800, 750, 700, 650, and 600°C, respectively. The peak power density at 800°C was around 70% of the performance compared to the theoretical maximum power density (i.e., 550 mW/cm2) with the YSZ electrolyte; thus, in a future study, the structure, material, and fabrication processes still need to be optimized. To examine the electrochemical stability of the cell, the performance of the S1 cell was maintained for 50 h at a constant current bias of 100 mA/cm2 at 700°C shown in Fig. 6(b). There was no observable performance degradation within operation period. The power density was reduced from 88.8 mW/cm2 at the beginning to 87.6 mW/cm2 at the final stage suggesting that the degradation rate was 0.3% per 1000 h by extrapolating plot. This negligible degradation rate during the short-term evaluation for 50 h indicates reasonable cell stability which is enough to obtain accurately the performance results.

(a) Current-voltage and power density curves of the ES-SOFC at different temperatures and (b) short-term stability at 700°C.
4. Conclusions
In this study, we developed ES-SOFCs operating at a temperature range of 800~600°C with different thicknesses of anode architectures using screen-printing techniques. In this study, the anode thicknesses were between 25~74 μm, and the active area was 0.5 cm2 same as the cathode. Although a sintered dense electrolyte might have poor interface adherence between the electrolyte and electrode in ES SOFCs, we successfully obtained an excellent interface for each layer through a well-controlled sintering process. The cells yielded a peak power density that was higher than 380 mW/cm2 at 800°C when the range of the anode thickness was 38~47 μm (S3, S4, and S5 cells) and all other components and fabrication processes were the same. For the S3 cell, the peak power density was recorded at 170 mW/cm2 at an operating temperature of 700°C. Simultaneously, excellent electrochemical stability was observed for a 50-h operation under 100 mA/cm2 constant bias with a degradation rate of 0.3% per 1000 h. This work demonstrates the importance of the anode thickness especially in affecting the performance of ESSOFCs.
Acknowledgement
This research was supported by the projects of the Korea Electric Power Corporation(R22EA08).
Notes
Conflicts of Interest
The authors declare no conflicts of interest.