1. Introduction
Tungsten and cobalt are widely used as strategic resources in the military, aerospace, science and technology industries, as well as other industries [1]. Tungsten cobalt alloy is widely used in cemented carbide because of its high melting point, high hardness, and good wear and corrosion resistance [2]. With the development of society, the use of spent cemented carbide (YG8) is increasing year by year, and it is difficult to achieve efficient recycling with the current cemented carbide recycling technology [3]. Therefore, developing a new recycling process for spent carbide is of great significance to natural resources and the rational development of mineral resources.
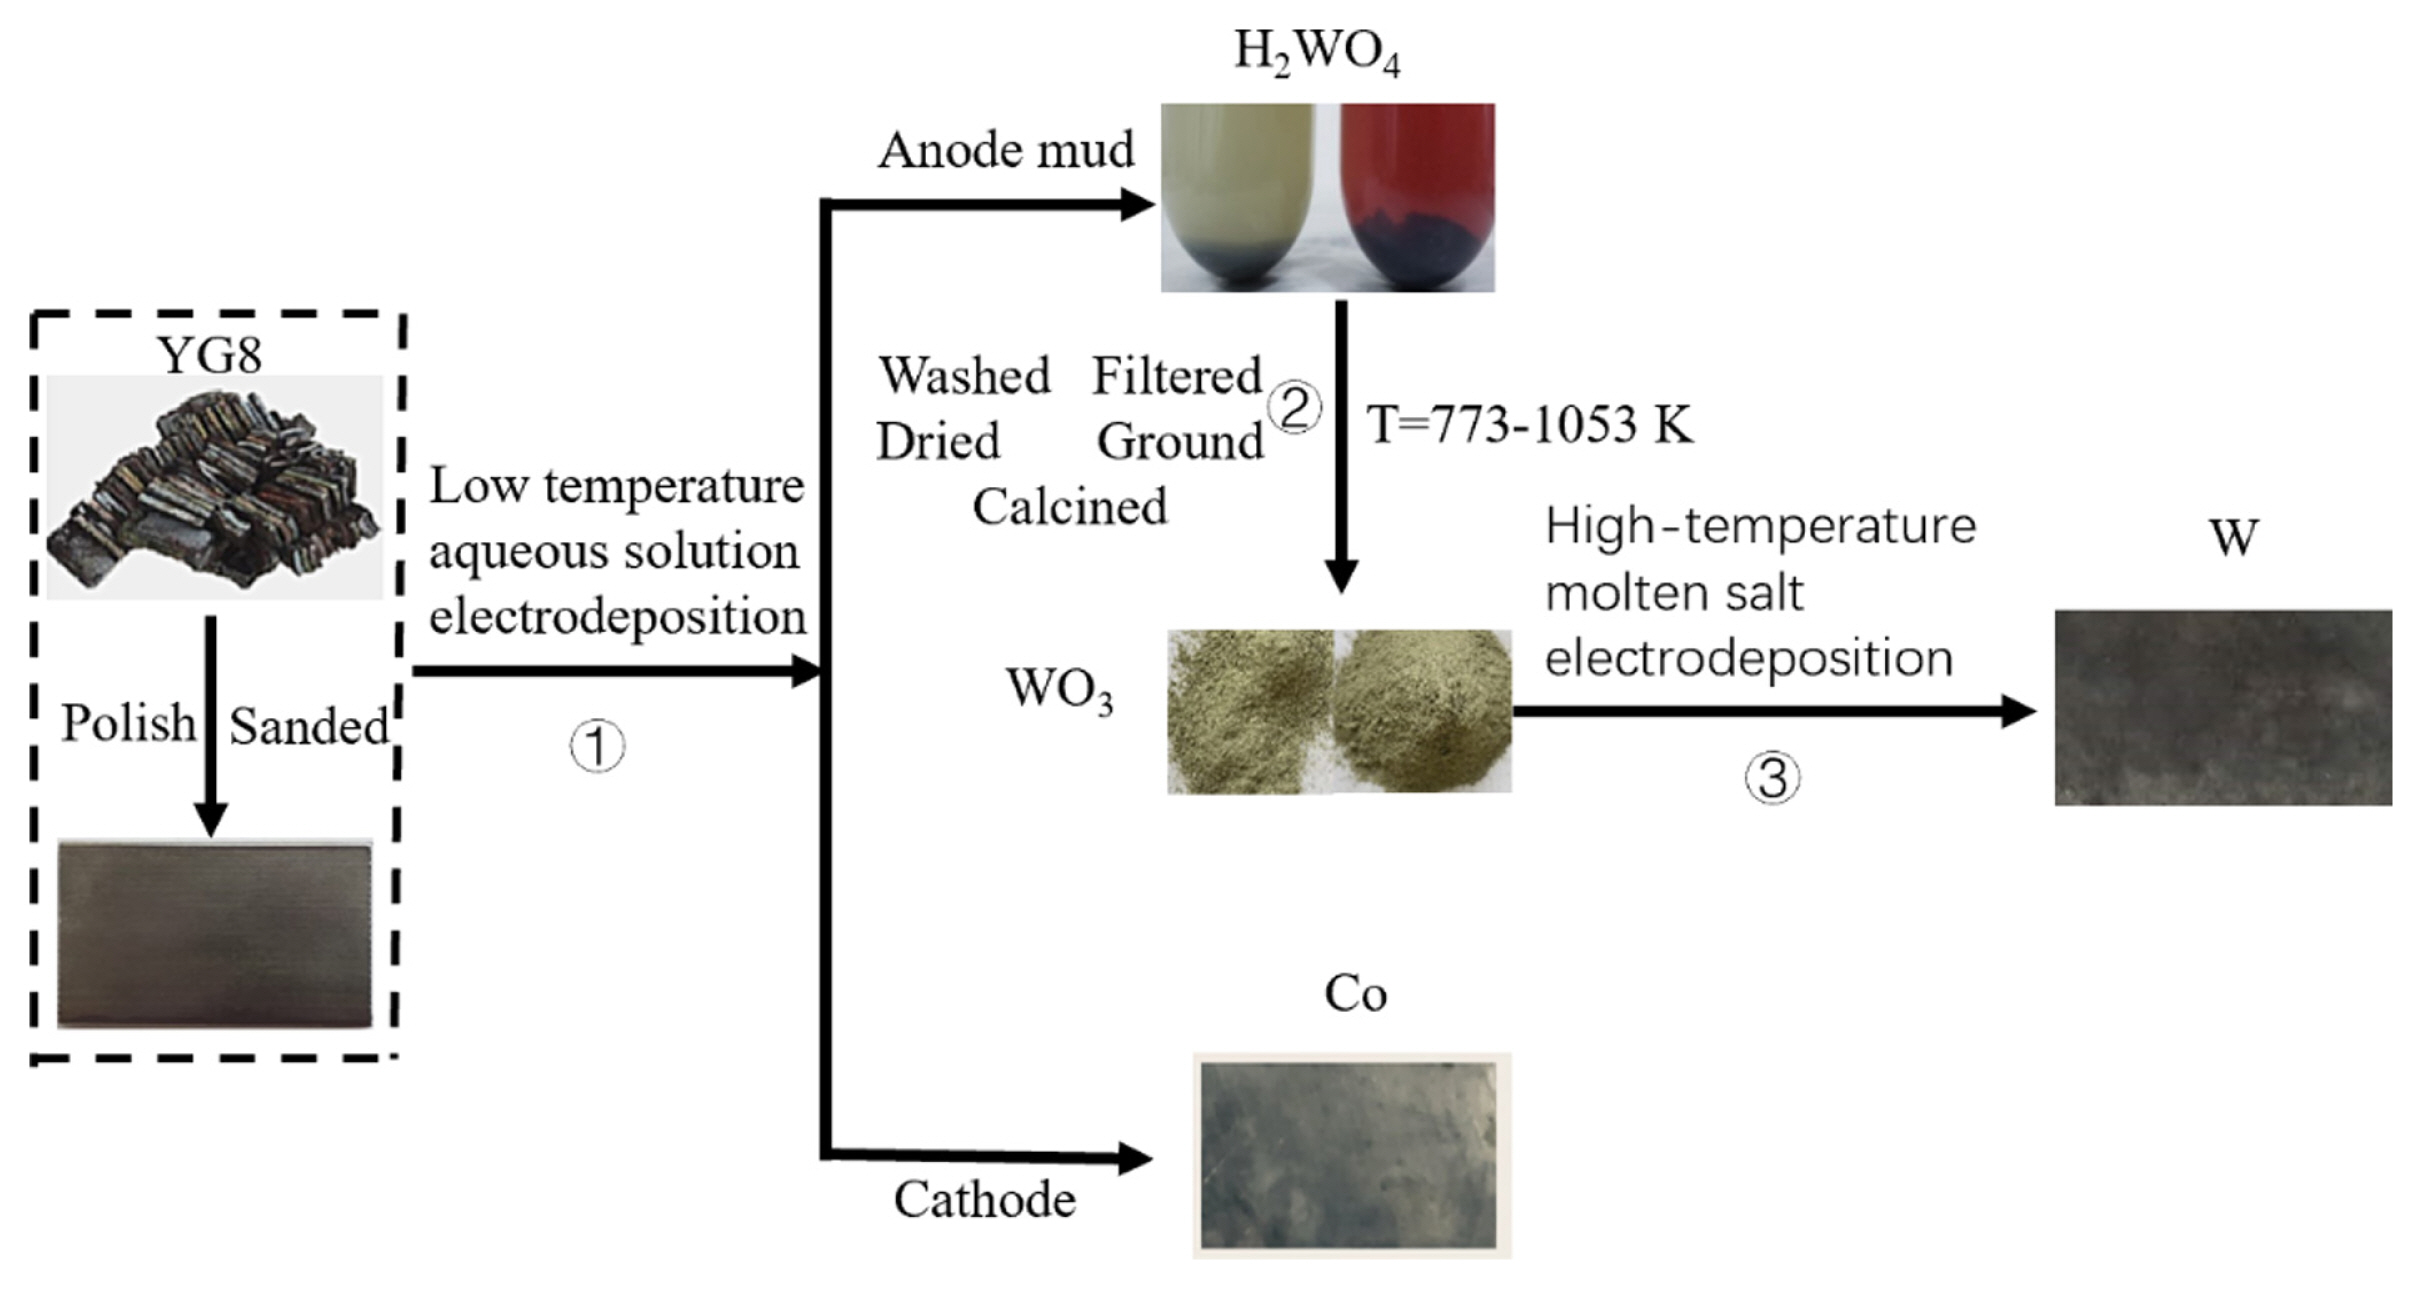
There are several methods of recycling spent cemented carbides, including the zinc process, high-temperature process, cold stream method and electrochemical method [4]. The electrochemical method is favored because of its advantages, such as simple equipment and easy process control. Electrochemistry involves two types of operation: molten salt electrochemistry at high temperatures and aqueous solution electrochemistry at low temperatures. Using hydrochloric acid as the electrolyte, B. Huang [5] effectively separated tungsten and cobalt from spent carbide by electrodeposition, but the waste solution was a serious environmental pollutant. X. Xi et al. [6] successfully extracted tungsten from WC scrap and investigated the electrochemical behavior of tungsten ions in a NaCl-KCl melt at 1023 K. They demonstrated the feasibility of tungsten recovery from spent carbide by molten salt electrodeposition, but the efficiency of tungsten recovery was only 18%. X. Xiao et al. [7] separated tungsten from spent carbide in a NaF-KF molten salt and proposed the concept of short process recovery of tungsten. However, the process required considerable energy consumption, and the electrochemical recovery of spent carbide was not described. To reduce energy consumption and environmental pollution in the recovery process and realize the efficient recovery of tungsten resources, our group proposed using the combined technology of aqueous solution electrochemical separation and molten salt electrochemical deposition to recover cobalt and tungsten [8]. The specific process route is shown in Fig. 1,. H. Kang [8] completed a preliminary study of using spent cemented carbide (YG8) as the anode in an acidic aqueous solution to recover cobalt and H2WO4. Based on this study, WO3, a product of H2WO4 calcination, was used as a tungsten source to obtain high-quality tungsten by electrodeposition of molten salt, and the effect of current density on current efficiency during tungsten deposition and the electrochemical precipitation discharge mechanism of tungsten W(VI) was studied.
2. Experimental
2.1 Experimental materials
All the reagents (Except WO3) included in the paper were supplied by Sinopharm Chemical Reagent Co., Ltd. The purity of the reagents is AR. As a preparation for the experiment, NaCl, Na2WO4, and WO3 were dehydrated for 24 h under vacuum at 473 K to ensure that the experimental reagents were dry and without water.
The diameter of both graphite and tungsten rods is 8 mm, the platinum wireŌĆÖs diameter is 2 mm, and their purity is 99.99%. The area of the stainless-steel plate (AISI 1045) is 6 cm2. To prepare the plates for the experiment, they were sanded with sandpaper of 1000 grit. After polishing, they were cleaned with alcohol for 10 min. And using deionized water to wash the surface for 5 min, finally dried and vacuum sealed.
2.2 Experimental process
An argon atmosphere was used for the next experiments, and the temperature was kept at 1053 K. The molar ratio of NaCl:Na2WO4:WO3 was 82:16:2 (100 g).
Investigating the effect of current density on current efficiency in a two-electrode deposition. 8 is a tungsten rod that serves as the anode. The cathode is stainless steel, while the graphite electrode leaves the surface of the liquid molten salt. Electrodeposition was conducted for 3 h. Tungsten was obtained on the cathode plate and the tungsten rod at the anode was reduced.
A three-electrode system was used in the experiments to study the reduction mechanism of W(VI). Tests were performed on the Swiss Wantong electrochemical workstation. The working electrode and counter electrode are stainless-steel plate and graphite. 8 is a platinum wire, as the reference electrode. Tungsten was obtained on the cathode plate and the anode produced CO2.
3. Results and Discussion
3.1. Analysis of calcination products
The H2WO4 obtained by electrolysis of the aqueous solution has two parts [8], one from the anode plate and the other from the breaker. The H2WO4 cannot be used directly for tungsten recovery by electrodeposition, so we calcined it under a muffle furnace, after which we characterized the calcination products by XRD and SEM. After calcination of tungstic acid, the following reactions occur [6]:
The XRD results show that both the anode clay in the beaker and the anode clay adhered to the anode have the same phase of WO3 at the same temperature. Different temperature comparisons show that the tungsten trioxide particles become larger as the temperature increases, while the growth of tungsten trioxide: gradually changes from one crystalline surface to multiple crystalline surfaces.
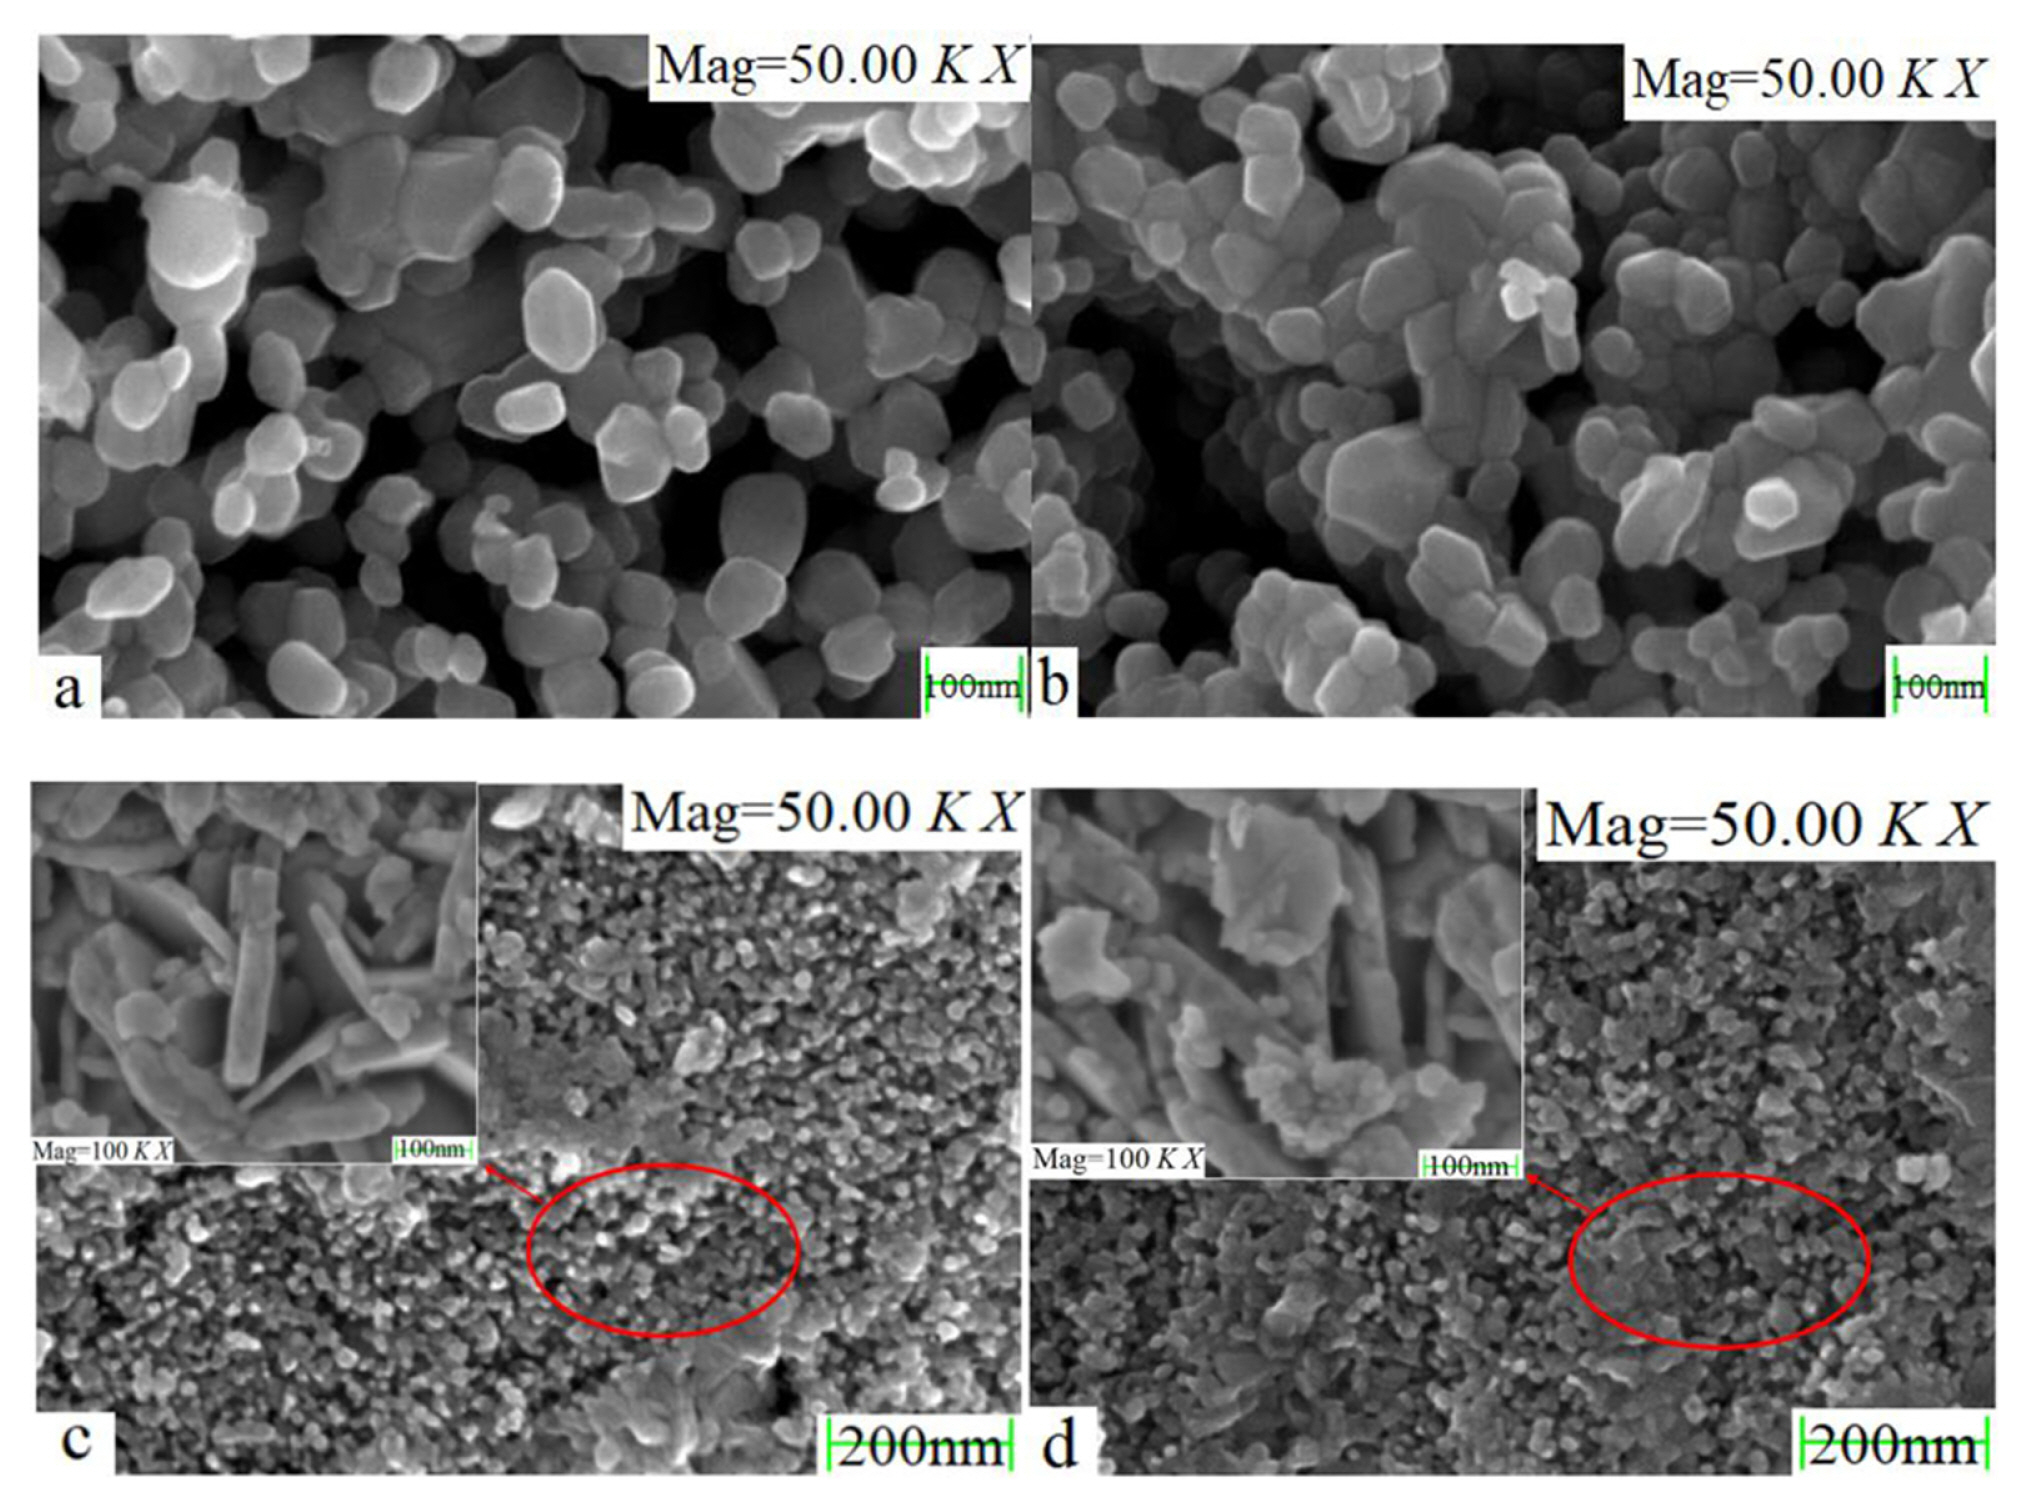
The aŌĆōd in Fig. 4 corresponds to the aŌĆōd in Fig. 3. The SEM results show that temperature has an effect on the morphology and size of WO3, with increasing temperature corresponding to a larger particle size of the generated WO3. And magnification of the circled region in Fig. 4(c,d) to 100,000 times shows clearly that the region is flaky. The WO3 morphology obtained at higher calcination temperature is more regular.
No other phases were detected in the results, and the WO3 obtained by calcination at 1013 K was able to be used as a raw material to provide tungsten ions for molten salt electrodeposition.
3.2. Effect of current density on current efficiency
Current efficiency ╬Ę is related to current density, use of additives, the content of metals in electrolyte, the temperature of electrolyte, etc. [9] Increasing the temperature or the concentration of a certain ratio of molten salt will sharply increase the pollution, so this paper in the process study only discusses the influence of current density on the current efficiency of tungsten recovery.
Where m1 is the actually received mass of tungsten (g), m2 is the theoretical mass of tungsten (g), C is the electrochemical equivalent (1.143 g┬ĘAŌłÆ1┬ĘhŌłÆ1), I is the electron current (A), t is electrolysis time (3 h), J is the current density (mA┬ĘcmŌłÆ2), and S is the area of the stainless-steel plate (6 cm2).
It can be known from the formation and growth of crystal nuclei [10] that the energy required for tungsten nucleation is much greater than the energy required for the growth of tungsten nuclei, when the current density does not reach a critical value, crystal nuclei able to grow continuously, and they grew with the increase in current density; when the current density exceeded the critical value, the increase in current density resulted in concentration polarization, and excessive current density produced burnt matter, affecting the precipitation of metal ions, and crystal nuclei decrease with the increase of current density.
Fig. 5 shows that the current efficiency increases first and then decreases with increasing current density. When the current density is lower than 80 mA┬ĘcmŌłÆ2, the crystal nucleus of tungsten will increase gradually with increasing current density, so the current efficiency will increase gradually. When the current density was 80 mA┬ĘcmŌłÆ2, the current efficiency reached a maximum of 82.91%. When the current density exceeds 80mA┬ĘcmŌłÆ2, the crystal nucleus of tungsten gradually decreases with the increase of current density, so the current efficiency decreases [11]. Apart from that, in high-temperature molten salt, minimal tungsten does not bond well with stainless steel, so it is easily impacted into molten salt by ion migration and the flow of molten salt, and then the current efficiency is reduced [12].
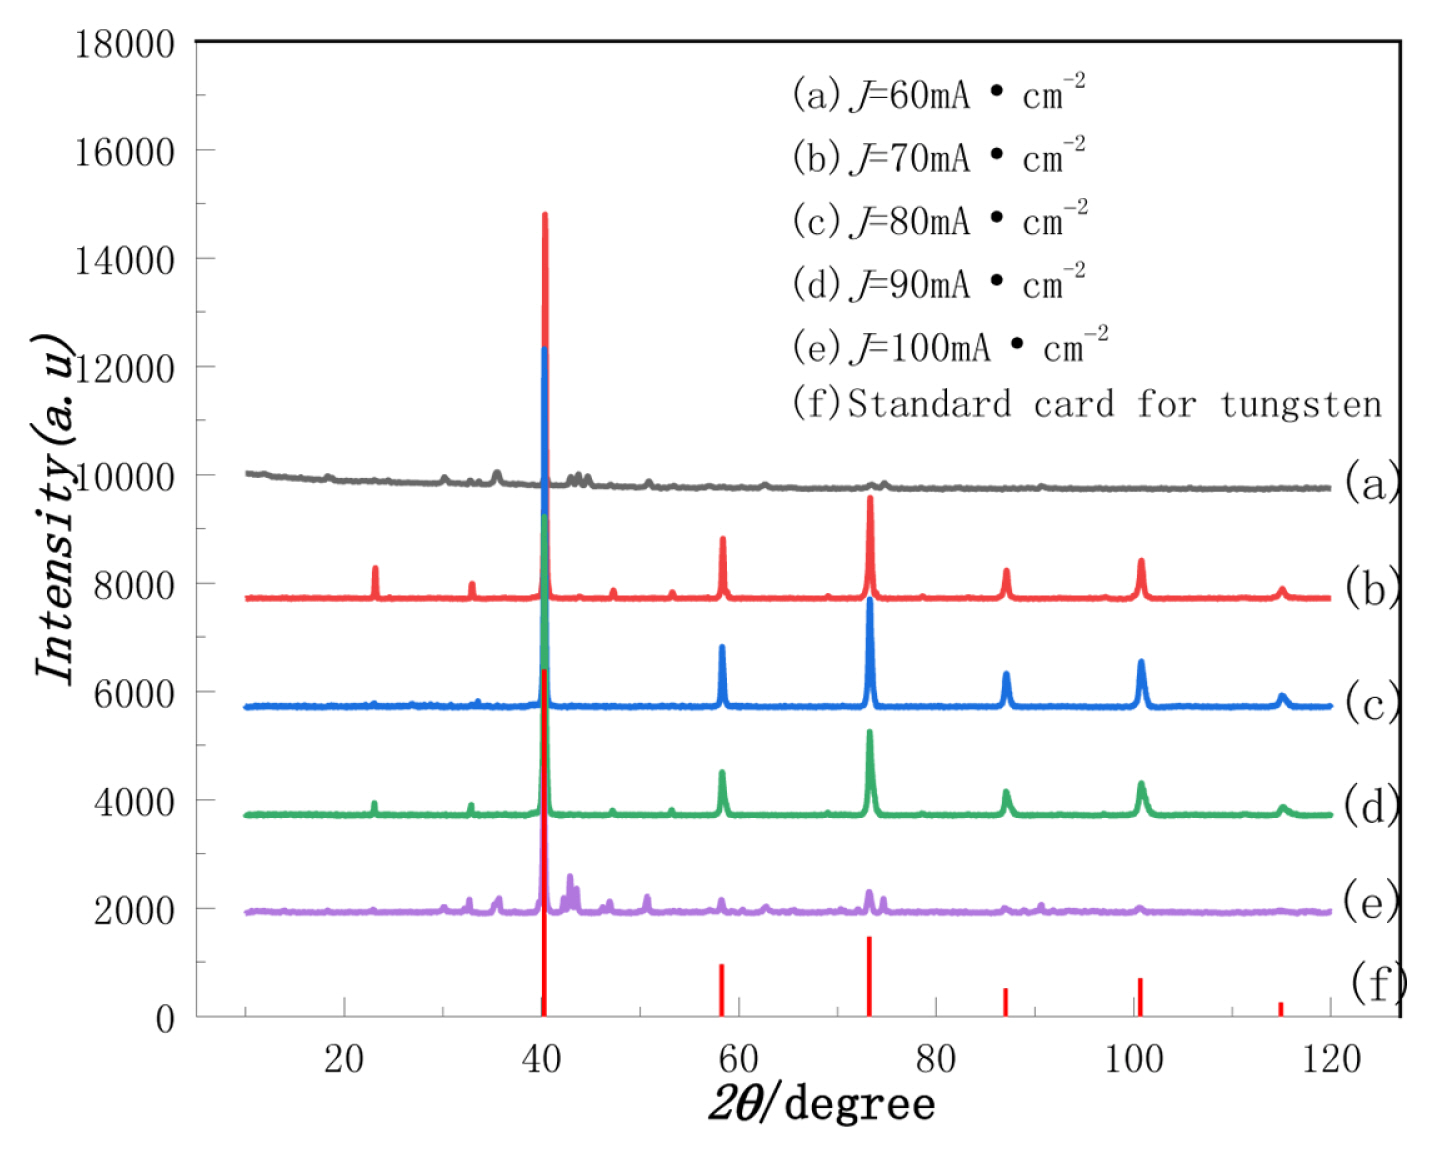
The tungsten on the surface of the cathode was obtained under different current densities, washed with deionized water, and then characterized by XRD after drying. The results are shown in Fig. 6.
Fig. 6 shows that when the current density is low as well as high, less tungsten is deposited on the cathode plate. This trend is the same as that in Fig. 5. The lattice constants calculated by Jade software are a=b=c=3.163 ├ģ and ╬▒=╬▓=╬│=90┬░, which belong to the cubic crystal system. The cubic crystal system corresponds to a braffey lattice (a=b=c=3.165 ├ģ, ╬▒=╬▓=╬│=90┬░).
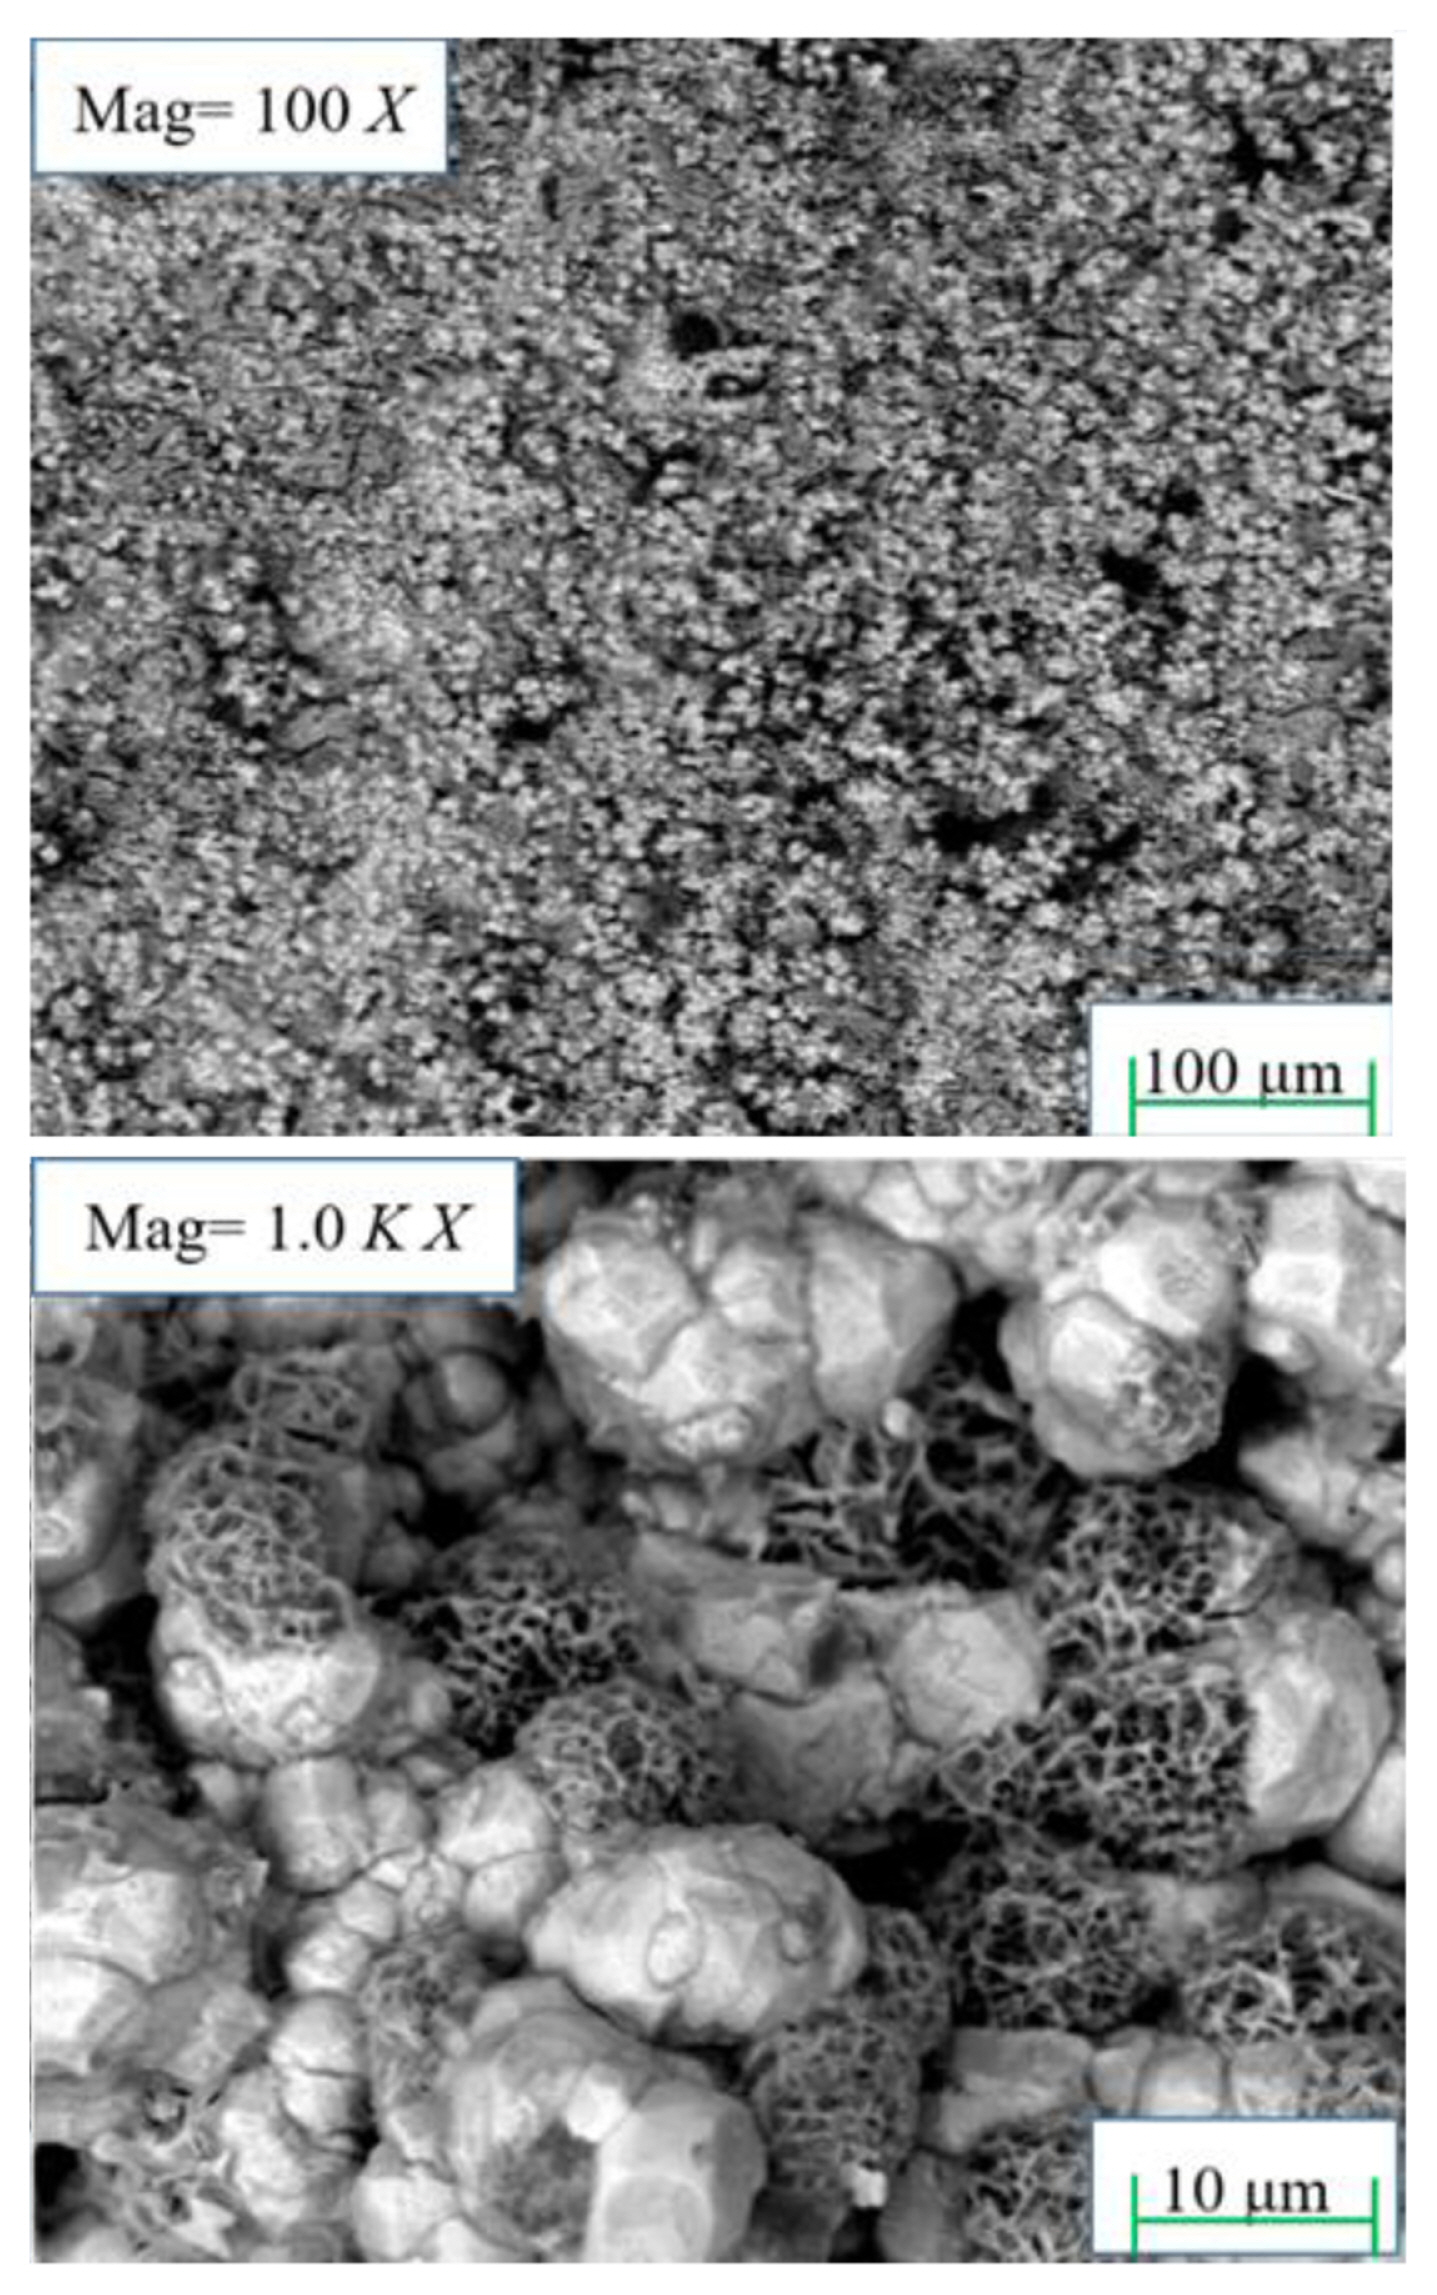
The coated plate at a current density of 80 mA┬ĘcmŌłÆ2 was characterized by SEM and the results are shown in Fig. 7. It shows that the distribution of tungsten is evenly granular when it is enlarged to 100X; when it is enlarged to 1.0kX, it can be seen that the structure of tungsten has sponge-like features.
3.3. Mechanism of the electrode reaction
3.3.1. Linear sweep voltammetry analysis (LSV)
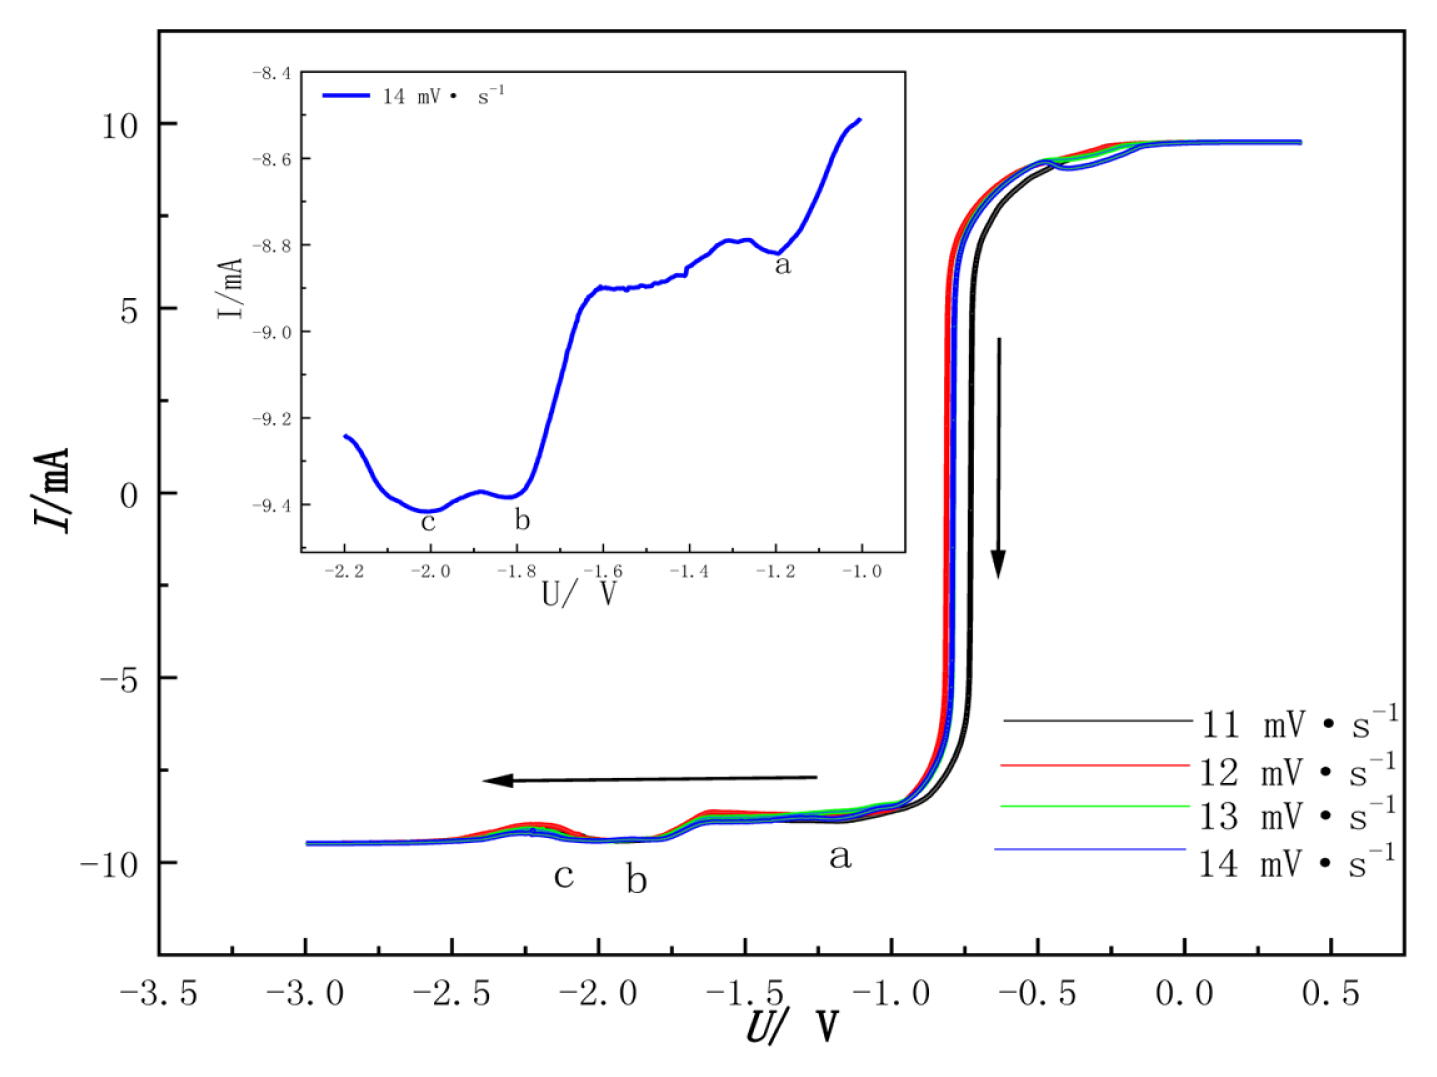
The discharge mechanism of W(VI) was studied with LSV. The temperature was 1053 K. The scanning direction changed from positive to negative. The scan range was 11~14 mV┬ĘsŌłÆ1. The test results are shown in Fig. 8,.
In this experiment, 14 mV┬ĘsŌłÆ1 is taken as an example. It shows that when the scan rate is 14 mV┬ĘsŌłÆ1, there are three reduction peaks in the range of (a) ŌłÆ1~1.2 V, (b) ŌłÆ1.75~1.8 V, and (c) ŌłÆ1.9~ŌłÆ2.1 V, corresponding to the reduction of W(VI). According to the relationship between electrochemistry and thermodynamics [6]:
where T = 1053 K,
╬ö G T ╬Ė = - 909250 ŌĆē kJ ┬Ę mol - 1
Adjacent points are taken at the right of the reduction peak (a), and then make the E-lg((Ip-I)/I) relationship curve as shown in Fig. 9.
According to the electron transfer number formula [13]:
E-Potential (V); Ip-peak current; k-slope of straight line; n-number of electrons transferred; F=96500 C┬ĘmolŌłÆ1; T=1053 K; and R=8.314 J┬Ę(mol┬ĘK)ŌłÆ1
Fig. 9 shows that E has a good linear relationship with log10[(Ip-I)/I] and that the slope of the fitting line is k=1.365. Through the above formula (7), the transfer electron number of W(VI) can be obtained by the following calculation:
From the calculation and the theoretical decomposition voltage, no electron transfer occurs, and the decomposition reaction of W2O72ŌłÆ may occur at peak (a) [14]:
W2O72ŌłÆ is from WO3 entering the molten salt to be dissolved, after which it diffuses toward the cathode due to the concentration difference [15]. The dissolution mechanism is as follows:
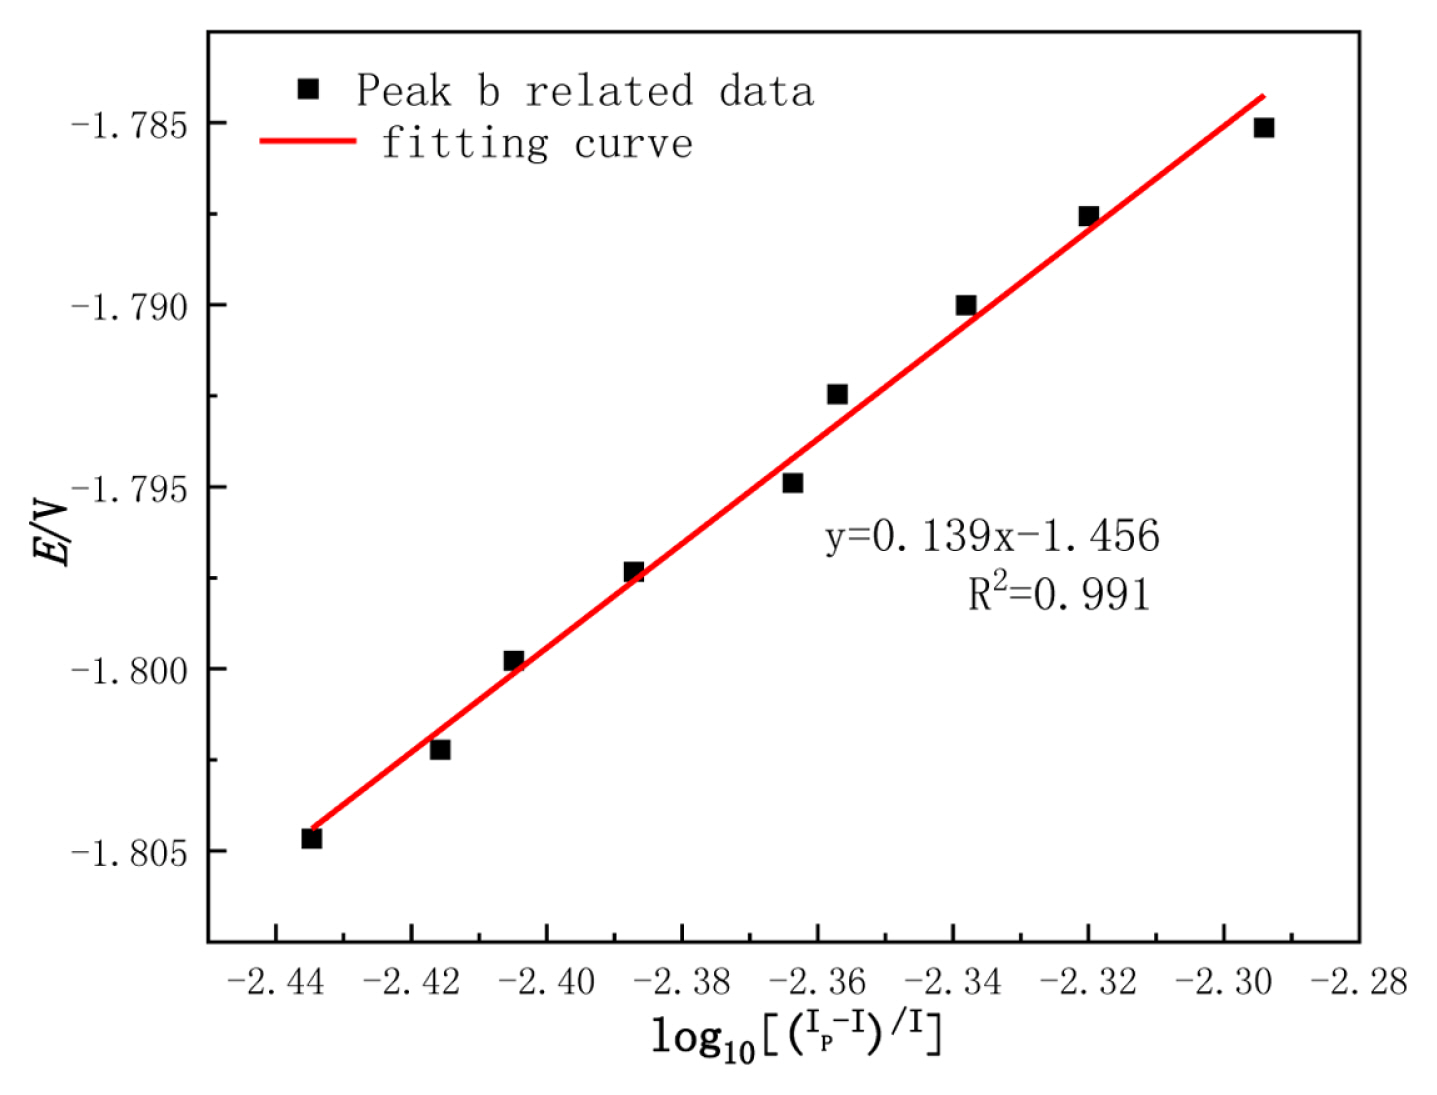
Adjacent points are taken at the right of the reduction peak (b), and then make the E-log10[(Ip-I)/I] relationship curve as shown in Fig. 10,.
Fig. 10 shows the slope of the fitting line is k=0.139. Through the formula (7), the transfer electron number of W(VI) can be obtained by the following calculation:
It is proven that the electron transfer number at peak (b) is 2. The principle is as follows:
Adjacent points are taken at the right of the reduction peak (c), and then make the E-log10[(Ip-I)/I] relationship curve as shown in Fig. 11.
Fig. 11 shows the slope of the fitting line is k=0.054. Through formula (7), the transfer electron number of W(VI) can be obtained by the following calculation:
It is proven that the electron transfer number at peak (c) is 4. The principle is as follows:
In summary, the principle is as follows:
Cathode:
Anode:
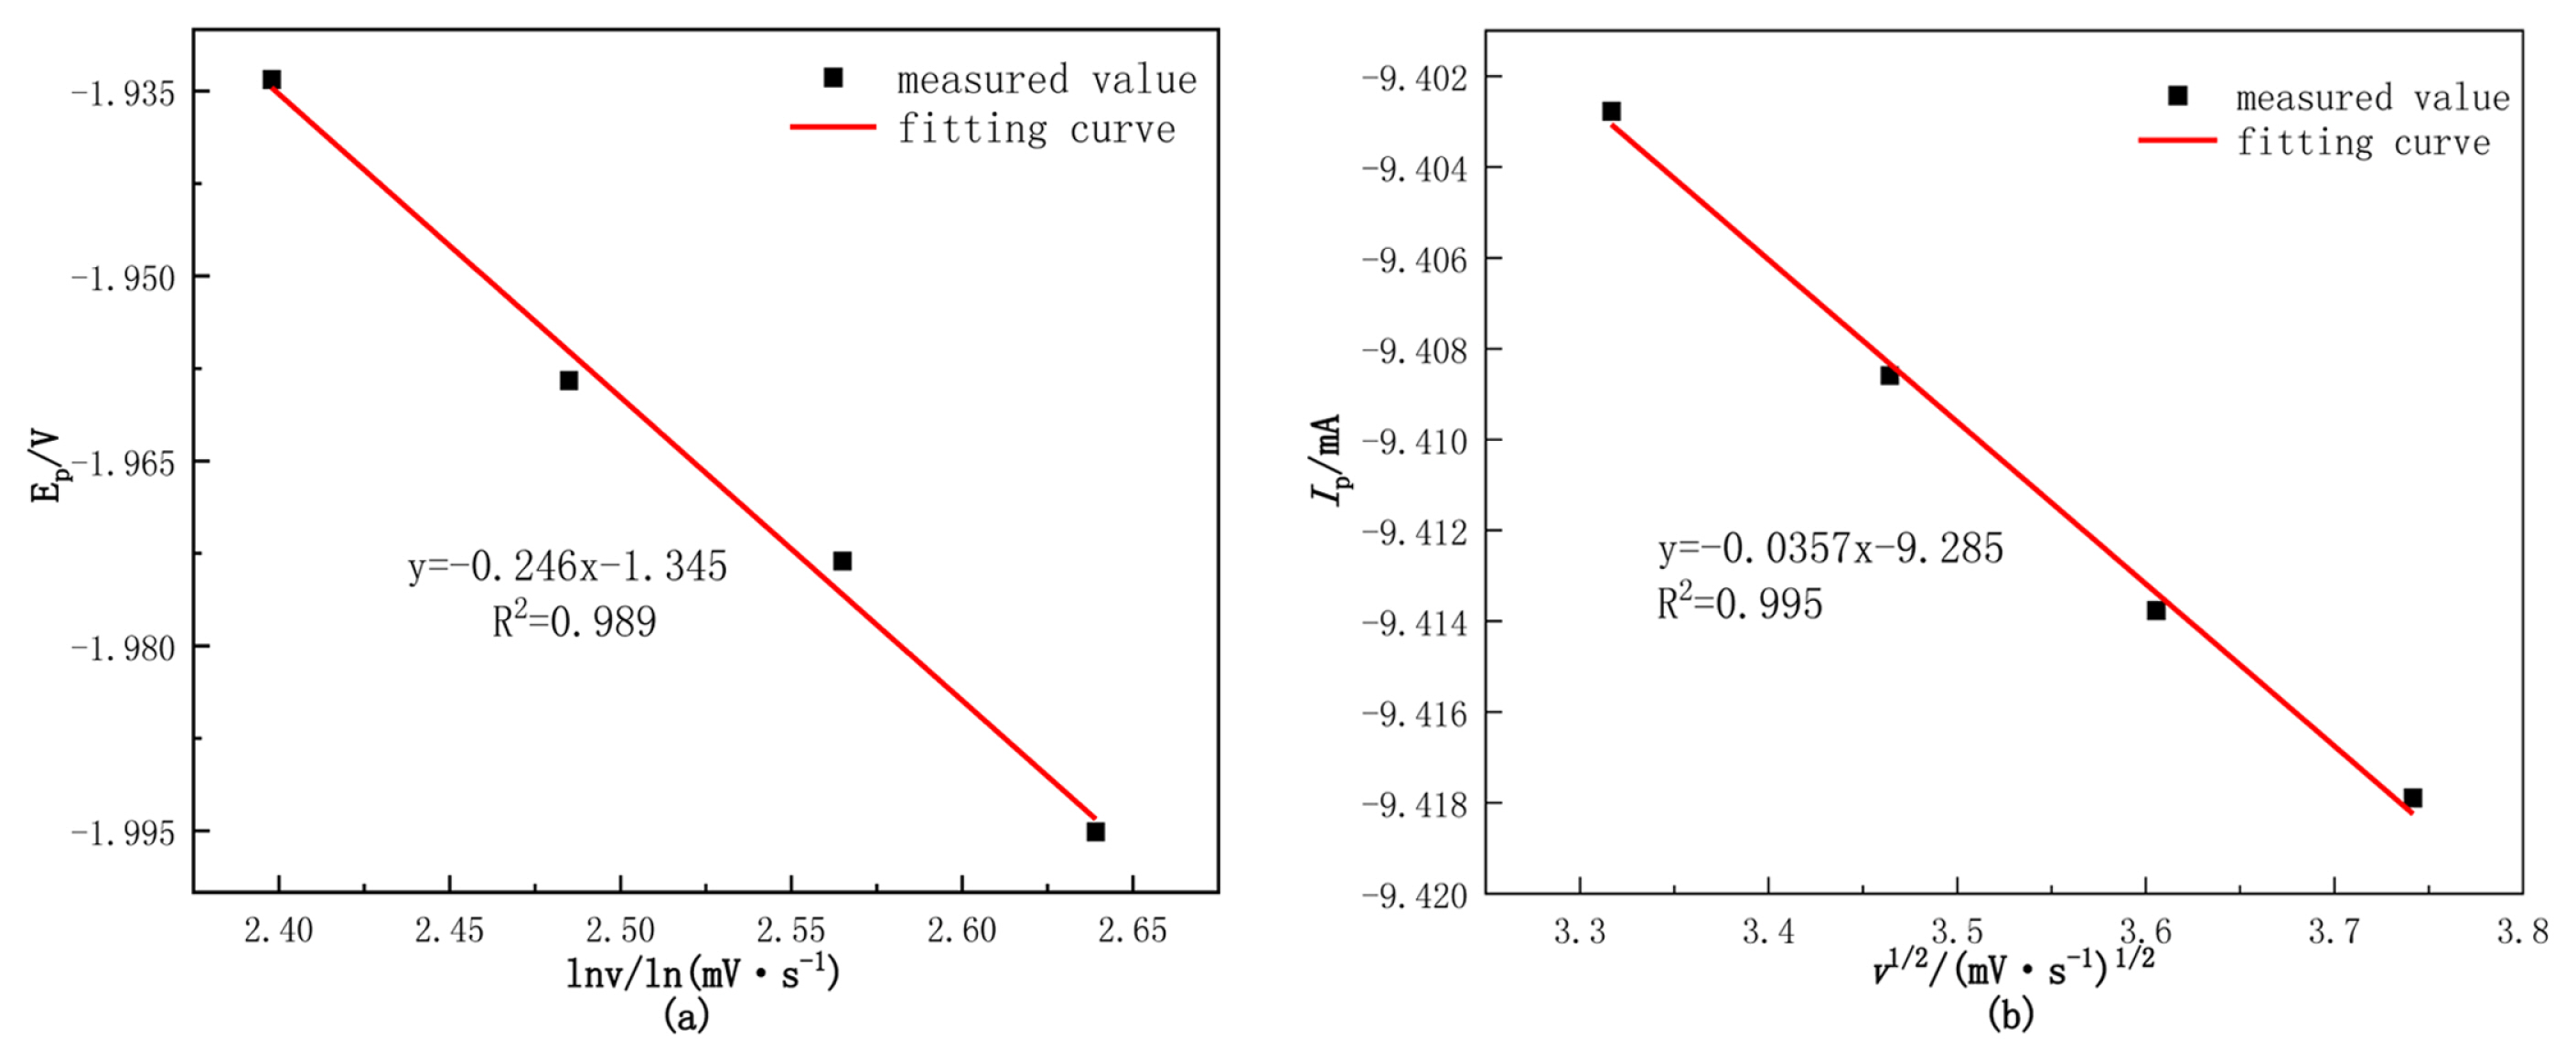
Afterward, whether the reduction process of W(VI) in tungsten trioxide is reversible and controlled by diffusion steps are studied. Table 4 presents the relevant data.
The relationship between the peak potential and scanning rate is studied to determine whether the reduction process is reversible [16,17]. According to the analysis in Fig. 12(a), the relationship between the Ep and the lnv is linear, so it can be judged that the process of W(VI) reducing to tungsten metal on the stainless-steel cathode is an irreversible process.
According to the analysis in Fig. 12(b), the Ip is linearly related to the v1/2, it conforms to the Randles-Sevcik equation [18], which indicates that the electrochemical reduction process of reduced metals is controlled by diffusion steps.
3.3.2. Chronoamperometric analysis
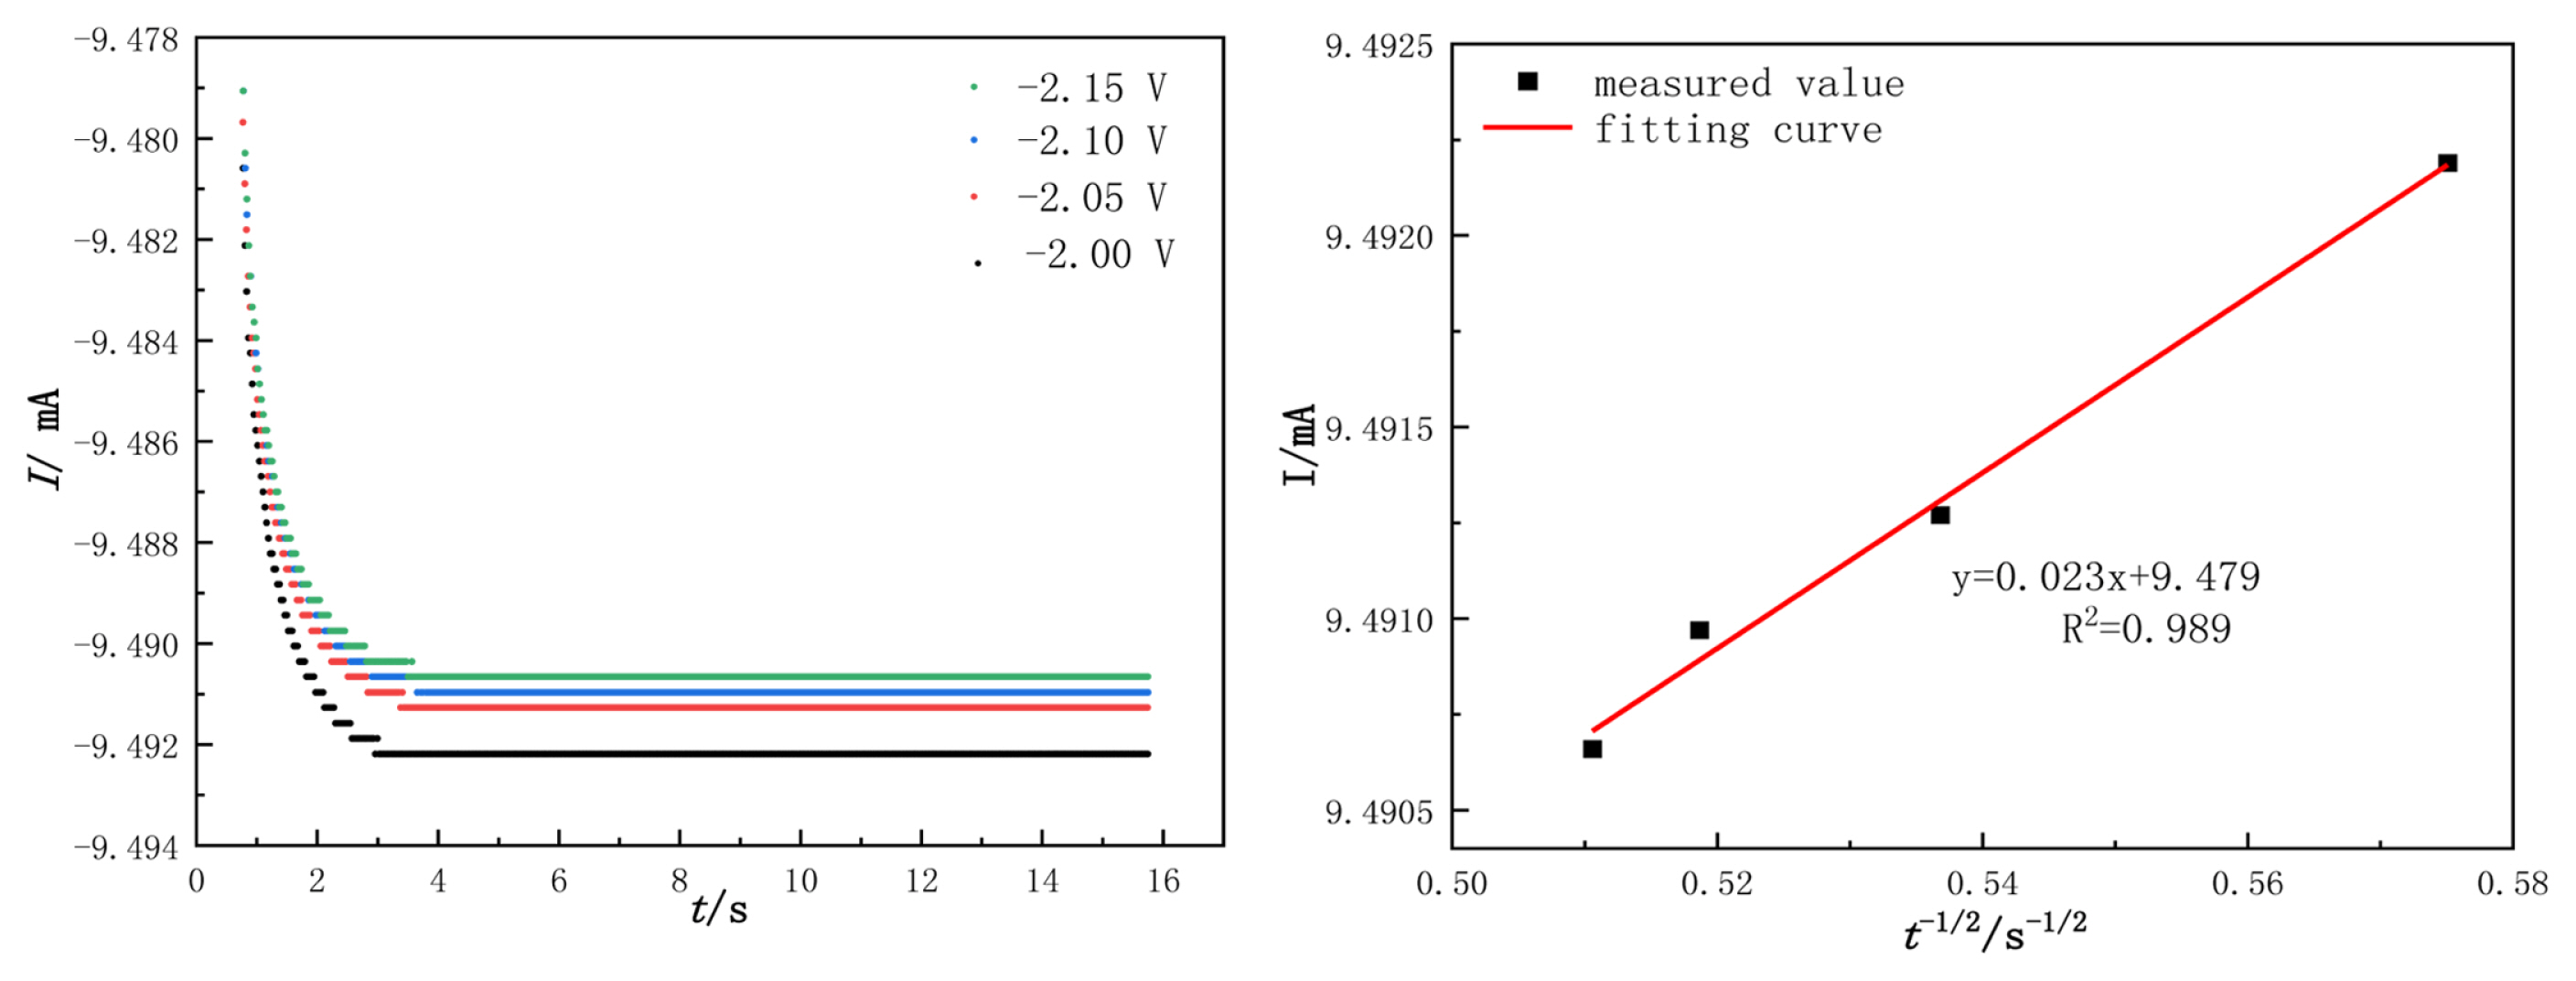
The nucleation process of WO3 was studied by Chronoamperometry in the electrochemical deposition. The temperature was 1053 K and the potential ranged from ŌłÆ2.00 V to ŌłÆ2.15 V. The test results and the relationship between I(t) and the negative square root of the transition time can be seen in Fig. 13(a,b).
Fig. 13(a) indicates that the electron current (in absolute value) is first increased, and then stabilizes. For example, in the curve (ŌłÆ2.00 V), the current quickly rises to its maximum as the electrical double layer is charged on the surface of the electrode [8]. In addition, W(VI) is rapidly decreased, and with increasing electrolysis time, the amount of tungsten on the working electrode surface increases. The quantities of W(VI) in the active nucleus canŌĆÖt meet the velocity of W formation, and it is controlled by concentration polarization. These factors contribute to the change in current. After that, no new tungsten nucleus is formed; instead, the nucleus grows on the cathode surface. As can be seen from the comparison of the chronoamperometric curves at different potentials, the electrochemical reduction of W(VI) is controlled by the diffusion step on the cathode surface.
As shown in Fig. 13(b), I(t) exhibit a good linear relationship with ŽäŌłÆ1/2. As a result, the electrochemical reduction of W(VI) is controlled by the diffusion step.
Based on the Cottrell equation [19], the diffusion coefficient of W(VI) can be calculated in an irreversible system. According to the equation (15), where A is the working electrode surface area (cm2); DW(VI) is the diffusion coefficient (cm2┬ĘsŌłÆ1); C0 is the W(VI) concentration (mol┬ĘLŌłÆ1); Žä is the transition time; ŽĆ =3.14; F =96500 C┬ĘmolŌłÆ1; and n is the number of electrons transferred.
when A=6 cm2, Žä1/2=0.023 mA┬Ęs, C0=0.432├Ś10ŌłÆ3 mol┬ĘLŌłÆ1, n=6, the calculated result is DW(VI ) =7.379├Ś10ŌłÆ10 cm2┬ĘsŌłÆ1.
In Fig. 13(a), different points can be randomly selected from the rising portion of the chronoamperometric curve at different electric potentials, the W(VI) nucleation mechanism could be obtained from the equations of instantaneous nucleation and continuous nucleation [20,21]. The equations (16) and (18) can be simplified as shown in Equations (17) and (19), respectively.
Instantaneous nucleation:
Continuous nucleation:
In the above equations, I(t)-electron current corresponding to time (mA); Z-valence; F=96500 C┬ĘmolŌłÆ1; N the nucleation number density (cmŌłÆ2); DW(VI)-diffusion coefficient (cm2sŌłÆ1); C0-concentration of W(VI) (mol┬ĘLŌłÆ1); M-molar mass (g┬ĘmolŌłÆ1); Žü-density (g┬ĘcmŌłÆ3); Kn-nucleation rate constant (cmŌłÆ2┬ĘsŌłÆ1); t-time (s); and ŽĆ=3.14.
Table 5 shows that the fitting degree of I(t)-t1/2 is better than the fitting degree of I(t)-t3/2 at any potential. The average fitting degree of I(t)-t1/2 was 0.965 and that of I(t)-t3/2 was 0.963. By comparison [22], the nucleation mechanism of W(VI) in molten salt agrees with instantaneous nucleation.
4. Conclusions
By optimizing the recovery process of tungsten from waste cemented carbide, when the current density is 80 mA┬ĘcmŌłÆ2, the electrolytic temperature is 1053 K and the molar ratio of NaCl:Na2WO4:WO3 was 82:16:2 (100 g), the maximum current efficiency is 82.91%. The reduction mechanism of tungsten was investigated using a three-electrode system, and electrochemical tests of LSV and Chronoamperometry were performed. The LSV results show that W(VI) is reduced in the first step at a potential of ŌłÆ1.75~ŌłÆ1.8 V. The number of electrons transferred is 2, and the reaction occurs W(VI)+2eŌłÆŌåÆW(IV). At a potential of ŌłÆ1.9~ŌłÆ2.1 V, the second reduction step occurs, and the number of electrons transferred is 4. The reaction occurs W(IV)+4eŌłÆŌåÆW(S). The relation between the natural logarithm of sweep speed and peak potential shows that the reduction of W(VI) is an irreversible process, and the relation between the power of sweep speed and peak current shows that the reduction process of W(VI) is controlled by the diffusion process. The diffusion coefficient of W(VI) is DW(VI)=7.379├Ś10ŌłÆ10 cm2┬ĘsŌłÆ1 by Chronoamperometric parameters. According to the nucleation formula and linear fitting, the W(VI) nucleation mode is closer to instantaneous nucleation.