Electroanalytical Determination of Copper(II) Ions Using a Polymer Membrane Sensor
Article information
Abstract
In this study, a new potentiometric sensor selective to copper(II) ions was developed and characterized. The developed sensor has a polymeric membrane and contains 4.0% electroactive material (ionophore), 33.0% poly(vinyl chloride) (PVC), 63.0% bis(2–ethylhexyl)sebacate (BEHS) and 1.0% potassium tetrakis(p–chlorophenyl)borate (KTpClPB). This novel copper( II)–selective sensor exhibits a Nernstian response over a wide concentration range from 1.0×10⁻⁶ to 1.0×10⁻¹ mol L−1 with a slope of 29.6 (±1.2) mV decade−1, and a lower detection limit of 8.75×10⁻⁷ mol L−1. The sensor, which was produced economically by synthesizing the ionophore in the laboratory, has a good selectivity and repeatability, fast response time and stable potentiometric behaviour. The potential response of the sensor remains unaffected of pH in the range of 5.0–10.0. Based on the analytical applications of the sensor, we showed that it can be used as an indicator electrode in the quantification of Cu2+ ions by potentiometric titration against EDTA, and can also be successfully utilized for the determination of copper(II) ions in different real samples.
1. Introduction
Trace metals are toxic for many organisms above a threshold concentration (for instance, the maximum containment level of copper is 1.3 mg/L according to EPA and WHO), and thus the presence of these metal ions in the environment and the food must be precisely and periodically monitored, making its determination in various media an essential analytical task [1–4]. Copper is one of the essential trace elements, and it has a high importance in industry, environmental and biological systems since it plays central roles in many biochemical processes. Copper is considered to be the second most toxic metal to aquatic life, and it leaks to waters and to other ecosystems via waste-waters emanating from mining industries, refineries, paper and dyeing industries to name a few industrial sources, posing a high risk to public health. Considering the importance of environmental protection and its effects on public health, the determination of copper in the environment and the food is very important, and many methods have been developed for this purpose so far. These techniques used for copper monitoring includes atomic absorption spectrometry (AAS), UV–Vis spectrometry and inductively coupled plasma atomic emission spectrometry (ICP–AES), high performance liquid chromatography (HPLC), anodic stripping voltammetry and cyclic voltammetry [5–9]. Generally, these methods require expensive instruments, qualified personnel (since they require complex analytical operations), sample pre–treatment, and they are hard to use in various settings; therefore, they are not suitable for the field analysis or to be used in resource-limited areas [10–13].
Therefore, new analytical tools are needed for economical real-time monitoring of environmental pollutants including copper(II). Many potentiometric methods with ion–selective sensors have been reported in the recent years due to their simplicity, portability, compactness, low cost, low detection limits, good mechanical stability, robustness and short response time. The most important advantage of these ion-selective sensors is the fact that they are able to measure the free metal ion activity which is responsible for their toxicity in organisms [14–17].
Various sensors for the potentiometric determination of Cu(II) ions in different samples have been developed up to date. Vlascici et al. reported a potentiometric copper(II)–selective sensor using a symmetrically subst ituted meso-porphyrin (5,10,15,20-tetrakis(4-allyloxyphenyl)porphyrin (TAPP)) [18]. In another study, a pencil graphite electrode (PGE) electrodeposited by nanostructure polypyrrole (PPy) conducting polymer film doped with 5-sulfosalicylic acid (SSA) was developed for the potentiometric detection of Cu (II) ions in aqueous solutions [19]. Others reported a copper(II)–selective potentiometric electrode based on graphite oxide–imprinted polymer composite for the electrochemical monitoring of copper(II) ions, and tested it in spiked river, dam, and tap water samples [20]. Carbon paste electrode modified with DTPT (3,4-dihydro-4,4,6-trimethyl-2(1H)-pyrimidine thione), carbon paste electrodes (CPE) modified with multi walled carbon nanotubes (MWCNT), modified carbon paste electrode (MCPE) based on 2-(3-phenoxy phenyl) propanoic acid (Fenoprofen (FP)), modified carbon paste electrodes based on amino acid (L-ornithine) or curcumin (turmeric) as ionophores and o–nitrophenyl octyl ether (o–NPOE) as solvent mediator, were also used in sensors developed for the potentiometric determination of Cu(II) ions [21–24]. Furthermore, other studies used different methodologies to develop copper sensors such as the one using polyvinyl chloride (PVC) matrix membranes containing neutral carrier porphyrin ionophores [25].
In the present study, we developed a copper(II)–selective potentiometric sensor using (E)-2-((1H-pyrrol-2-yl)methylene)hydrazinecarbothioamide (Fig. 1) as an ionophore. We also characterized its selectivity, repeatability, response time, potentiometric behaviour and pH response. Furthermore, we studied the applicability of this novel sensor in various real samples.
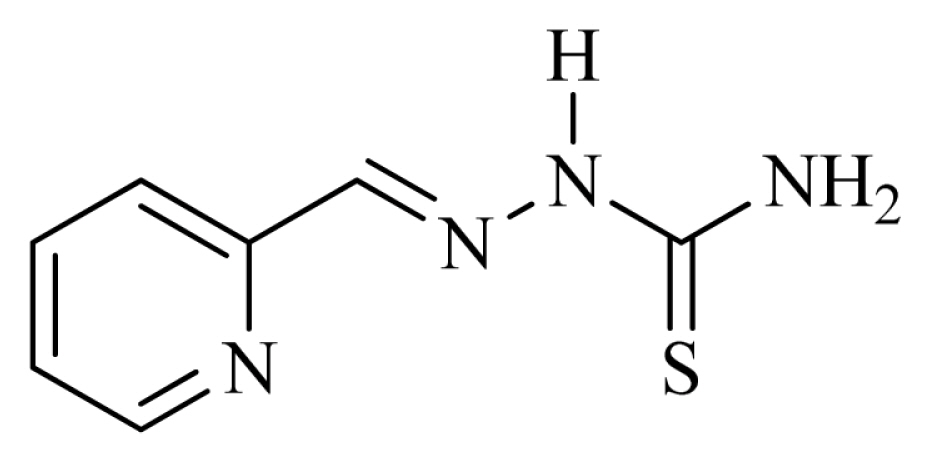
The chemical structure of (E)-2-((1H-pyrrol-2-yl)methylene)hydrazine carbothioamide.
2. Experimental
2.1. Chemicals and reagents
2-pyridinecarboxaldehyde, thiosemicarbazide, acetic acid and ethanol used in ionophore synthesis were purchased from Sigma Aldrich and Merck. Sensor components (high molecular weight PVC, dibutyl phthalate (DBP), bis (2–ethylhexyl)adipate (DEHA), bis(2–ethylhexyl)sebacate (BEHS), 1.0% potassium tetrakis(p–chlorophenyl)borate (KTpClPB) and tetrahydrofuran (THF)) were obtained from Sigma Aldrich. Nitric acid (HNO3), sodium hydroxide (NaOH), ethylenediaminetetraacetic acid (EDTA) and metal nitrate salts were purchased from Sigma Aldrich, Fluka and Merck. All–solid–state contact components (graphite powder, epoxy (Macroplast Su 2227) and hardener (Desmodur RFE)) were supplied from Sigma Aldrich, Henkel (Istanbul, Turkey) and Bayer AG (Darmstadt, Germany), respectively. Ultrapure water (18.2 MΩ cm−1) was obtained via Human ultrapure water system (Zeneer Power I) and used in all phases of the study. All standard solutions were freshly prepared in ultrapure water and renewed daily.
2.2. Apparatus
The characterization studies of the synthesized ionophore were performed using 1H– and 13C–NMR spectra recorded on a Brucker Advance III instrument (400 MHz). FT–IR spectra was obtained by Jasco FT/IR–4700 spectrometer. Melting points were measured on Electrothermal 9100. The potential measurements were carried out on a computer–controlled multichannel potentiometric system (Medisen Medical Ltd. Sti., Turkey). The system has a lab–made software program. Ag/AgCl (Thermo Scientific Orion 900100) electrode was used as a reference electrode for the potential measurements. pH measurements were performed with a digital pH meter (Mettler Toledo, Model S220).
2.3. Method
2.3.1. Synthesis of (E)-2-(pyridin-2-ylmethylene) hydrazine carbothioamide
(E)-2-((1H-pyrrol-2-yl)methylene)hydrazine carbothioamide was synthesized as previously reported in the literature [26–28]. Firstly, 2-pyridinecarboxaldehyde (1 mmol) was dissolved in warm ethanol (15 mL). Thiosemicarbazide (1 mmol) was dissolved in warm water (15 mL) and then added to this solution. 5 drops of acetic acid were subsequently added to the mixture. The reaction was stirred magnetically for 4h at room conditions. The precipitate formed at the end of the reaction was filtered off. After washing with ethanol several times, ionophore was ultimately synthesized. Brown solid, Yield 85%, m.p. 206–207°C; 1H NMR (400 MHz, δ, ppm, DMSO-d6): 11.64 (s, 1H), 8.56–8.55 (m, 1H), 8.34 (s, 1H), 8.27 (d, J = 8.0 Hz, 1H), 8.17 (s, 1H), 8.10 (s, 1H), 7.81 (t, J = 8.0 Hz, 1H), 7.38–7.35 (m, 1H); 13C NMR (101 MHz, δ, ppm, DMSO-d6): 178.86, 153.78, 149.74, 143.01, 136.98, 124.55, 120.68; FT-IR (KBr, υmax, cm−1): 3430, 3258, 3156, 1603, 1238, 1112.
2.3.2. Preparation of PVC membrane copper(II)-selective sensors
Copper(II)–selective PVC membrane sensor was prepared by following the general procedure given below:
A mixture of all–solid–state contact consisting of 50.0% (w/w) graphite, 35.0% (w/w) epoxy and 15.0% (w/w) hardener was thoroughly dissolved in approximately 3 mL of THF. After obtaining the appropriate viscosity, the ends of copper wires were dipped into this mixture several times and covered with conductive solid contact. The coated copper wires were kept in the dark for about 24h [29,30]. Then, sensors containing synthesized ionophore, different plasticizers (DBP, DEHA and BEHS), PVC and KTpClPB were prepared by dissolving them in approximately 3 mL of THF. Finally, the surface of the all–solid–contact was coated with this membrane cocktail by dipping them into the prepared membrane mixture for 4–5 times. The prepared PVC membrane sensors were left to dry for approximately 24h [31].
2.3.3. Potential measurements
Potentials were measured using an Ag/AgCl reference electrode. All potential studies were carried out at 25 ± 1.0°C temperature by using the following cell assembly:
Ag/AgCl ; KCl (3 M) ||Cu2+ sample solution |Cu(II)–selective membrane|solid contact| Cu wire
3. Results and Discussion
3.1. Membrane optimization
In this study, PVC membrane electrodes with the same ratios of all components were prepared using PVC, ionophore, KTpClPB and three different plasticizers (33.0:3.0:1.0:63.0 w/w, respectively). Plasticizers in the membrane composition of ion–selective sensors are important components that affect potentiometric performance characteristics. Plasticizers significantly affect both the dielectric constant of the membrane and the mobility of the ions [32]. Therefore, the type and ratio of plasticizers in the membrane mixture is of great importance in the coordination of the ions by the ionophore [33]. For this reason, the plasticizer used is of great importance in the selectivity of the developed sensor. In this study, the effect of three different types (BEHS, DEHA and DBP) of plasticizers on the potentiometric response of the sensor was investigated. The PVC membrane electrode prepared with BEHS has a lower detection limit and higher R2 value over a wider concentration range than electrodes prepared with DEHA and DBP. The components of the prepared PVC membrane electrodes and their potentiometric responses are given in Table 1. According to the results in Table 1, it was determined that the interaction between the ionophore and Cu(II) ions in the sensor prepared using BEHS was relatively stronger and the potentiometric performance characteristics of this sensor were superior to the others. Therefore, we preferred BEHS as the plasticizer in this study, and then changed the ionophore ratios. We examined the potentiometric behaviour of PVC membranes containing 2.0% and 4.0% ionophores. However, when the ionophore ratio decreased and increased, the potentiometric response of the sensor deteriorated. For this reason, we determined the ionophore ratio to be 3.0% as the ideal PVC membrane mixture. The potential response of the optimum membrane (Table 1) was determined using copper(II) solutions with concentrations between 1.0×10⁻¹ and 1.0×10⁻⁷ mol L−1. The potentiometric response of the copper(II)–selective sensor is given in Fig. 2(a) and the calibration curve is given in Fig. 2(b). As seen in Fig. 2(a), the prepared sensor exhibited a Nernstian behaviour of 29.6 (±1.16) mV decade−1 in the concentration range of 1.0×10⁻¹–1.0×10⁻⁶ mol L−1. The detection limit of the novel sensor, which exhibits a fairly ideal potentiometric response, was calculated according to Fig. 2(b). The potential value corresponding to the intersection point of the horizontal and vertical curves in the calibration curve (Fig. 2b) was written in the linear equation, and the detection limit of the sensor was calculated as 8.75×10⁻⁷ mol L−1. Based on the results obtained, we can state that the developed sensor has a Nernstian response and a low detection limit over a wide concentration range.

The prepared copper(II)-selective sensor components and potentiometric performance characteristics
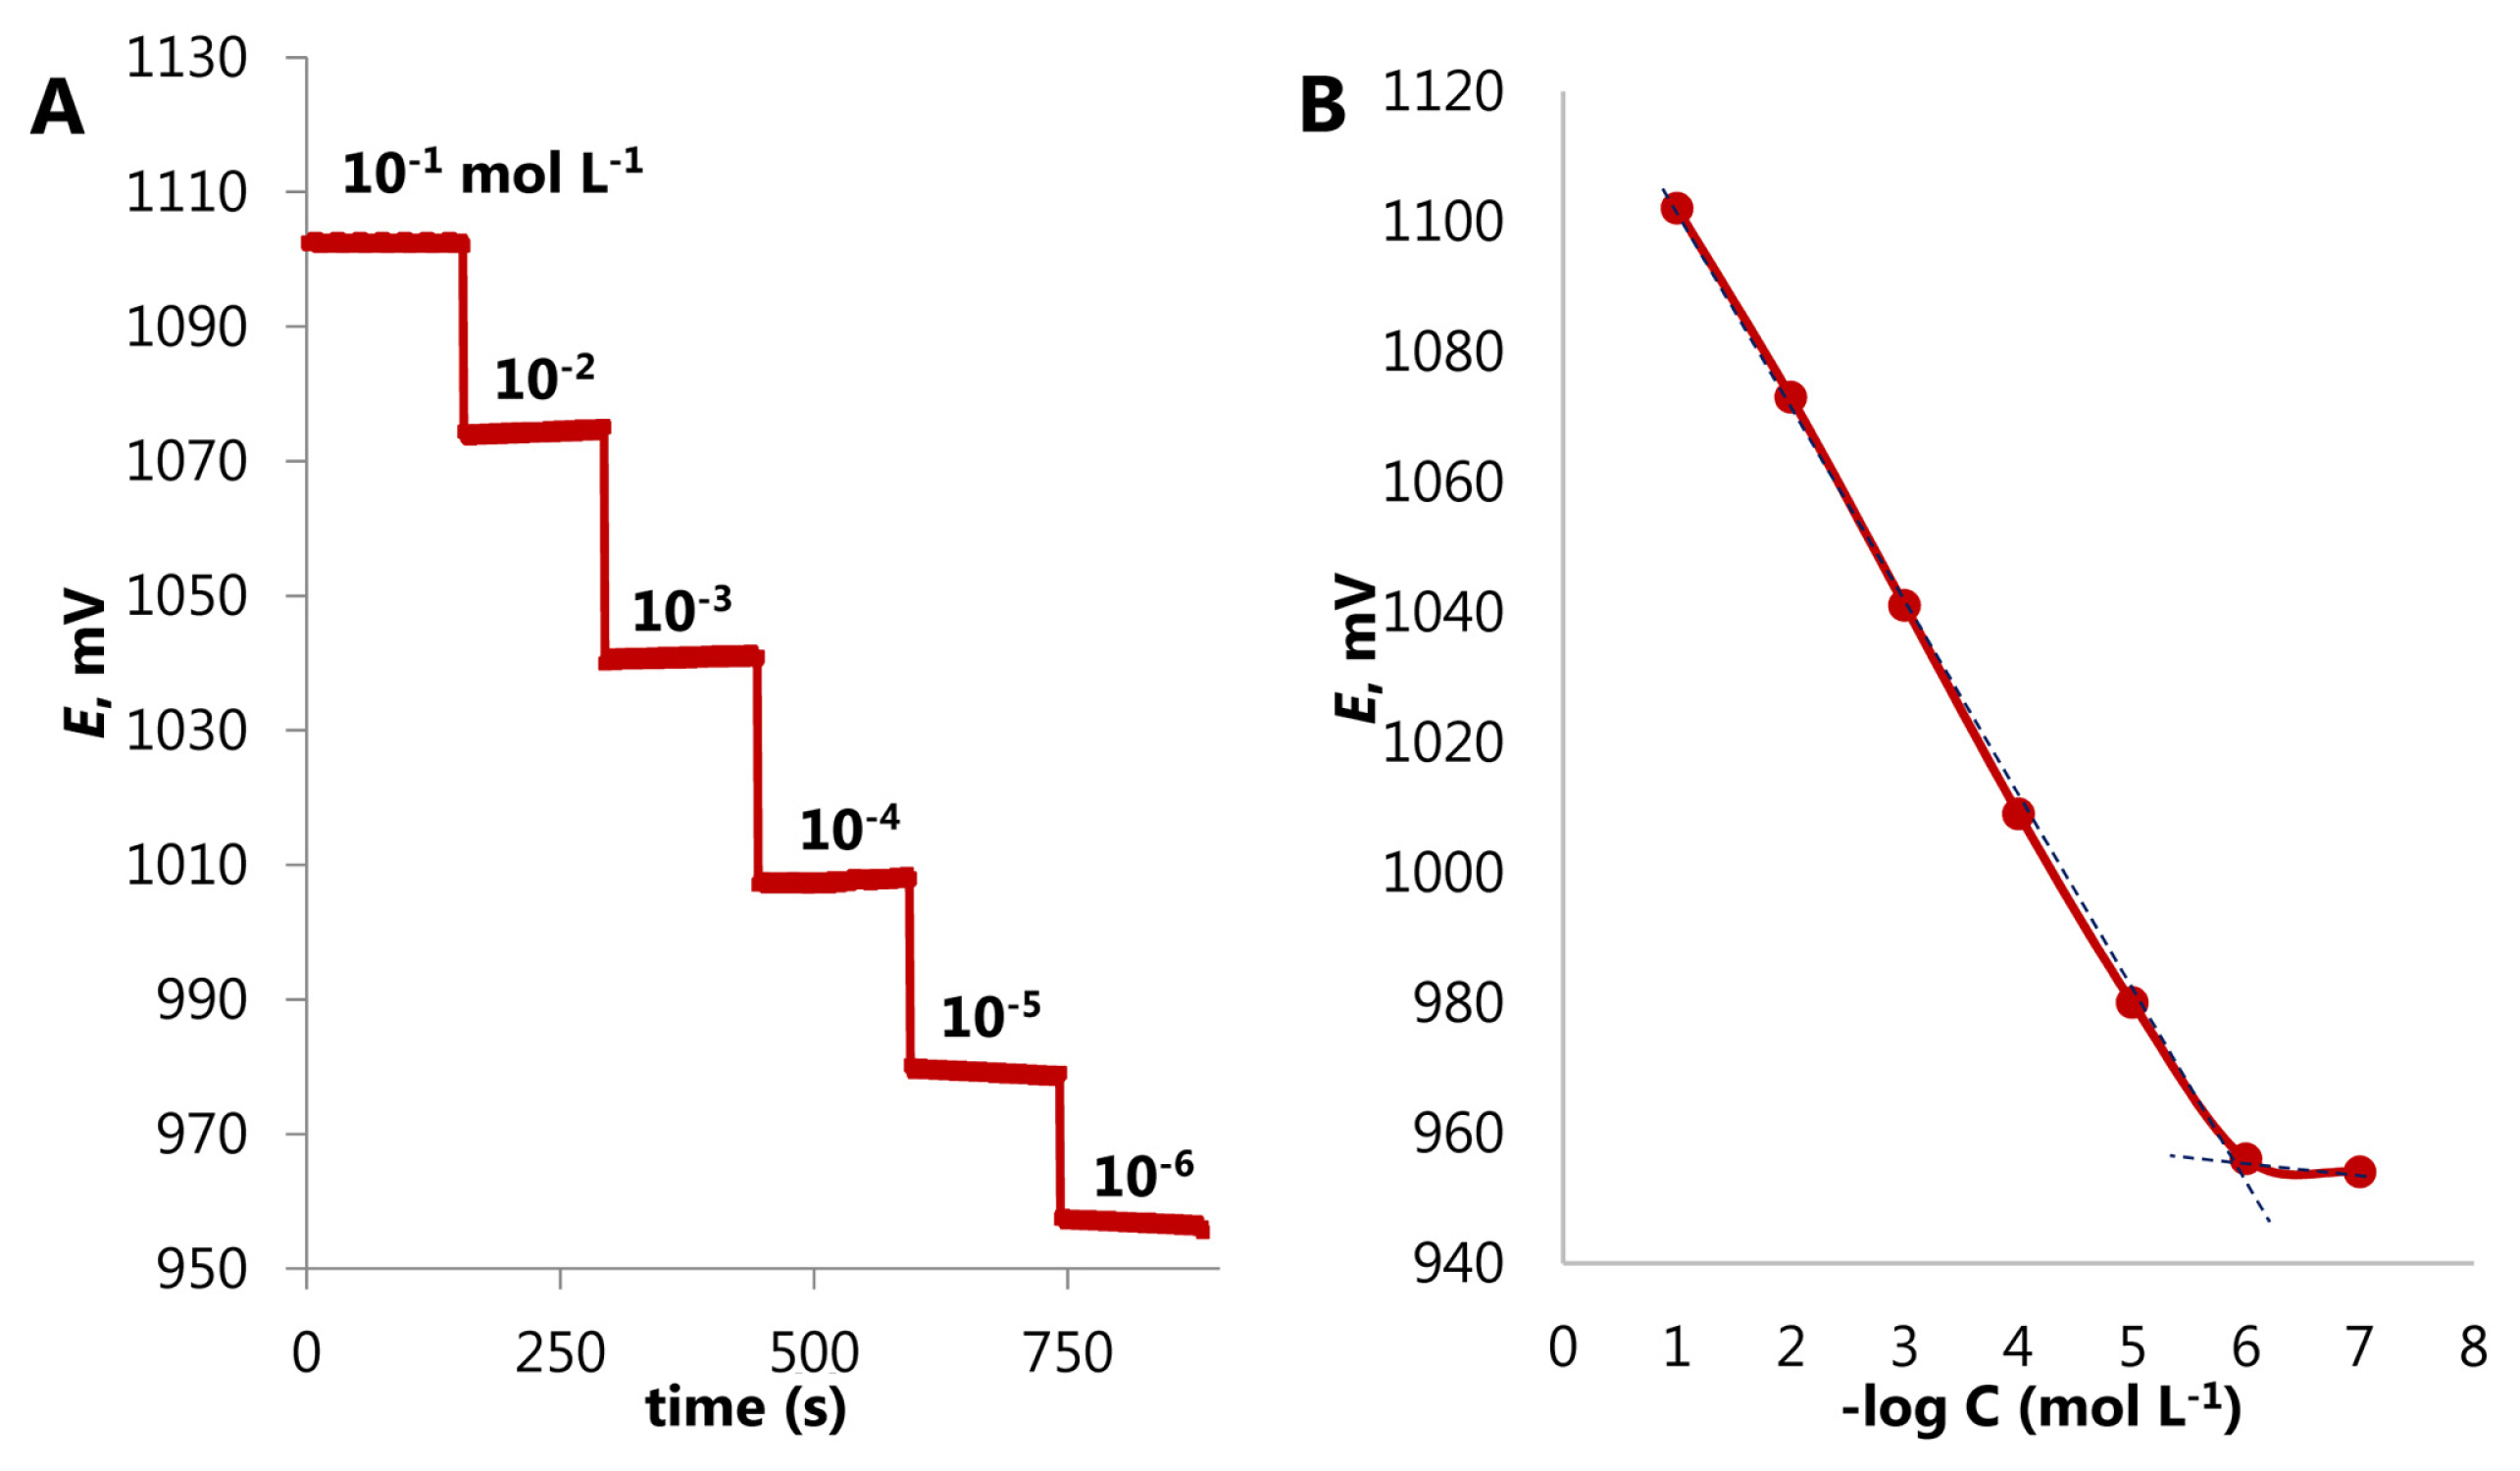
(a) The potentiometric response and (b) calibration curve of the copper(II)–selective sensor.
3.2. Ionophore effect
In this study, we examined the potentiometric response of the all–solid–contact electrode and the PVC membrane electrode without ionophore to demonstrate the effect of the ionophore. The potentiometric response of the ionophore–free PVC membrane electrode and solid-contact electrode to copper(II) ion solutions is given in Fig. 3. As seen in this figure, PVC membrane electrode without ionophore and all-solid-contact electrode do not show a potentiometric response to Cu(II) ions, while PVC membrane electrode containing ionophore is selective towards Cu(II) ions and exhibits an ideal potentiometric response.

Effect of ionophore on the potentiometric response of the novel copper(II)-selective sensor.
3.3. Repeatability
We tested the repeatability of the developed copper( II)–selective sensor using copper(II) solutions at three different concentrations. The sensor was immersed in Cu2+ solutions at 10−1, 10−2 and 10−3 mol L−1 concentrations, respectively, and then repeated measurements were taken. The measurement results and data of the potentiometric repeatability study are given in Fig. 4 and Table 2. The data shown indicates that the developed sensor has a good potentiometric stability and reusability with standard deviations of ±2.2, ±2.5 and ±2.3 mV, respectively.

Repeatability of the copper(II)–selective sensor.

The repeatability data of the copper(II)–selective sensor
3.4. Potentiometric selectivity
One of the most important features of ion-selective electrodes is their selectivity against the analyte ion of interest. An ion-selective electrode can respond to more than one ion in any matrix medium, but exhibits selectivity for only one ion. In this study, the prepared sensor exhibited selectivity towards copper(II) ions. The potentiometric selectivity coefficient is a numerical measure of how well the ISE can discriminate against the other interfering ions. The selectivity coefficients were calculated according to the equation below using the separate solution method (SSM) recommended by IUPAC [34]:
The calculated selectivity coefficients are given in Table 3 and Fig. 5. The selectivity coefficients are interpreted as follows:
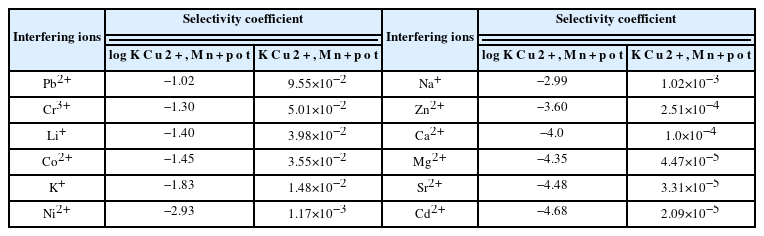
The potentiometric selectivity coefficients of the copper(II)-selective sensor
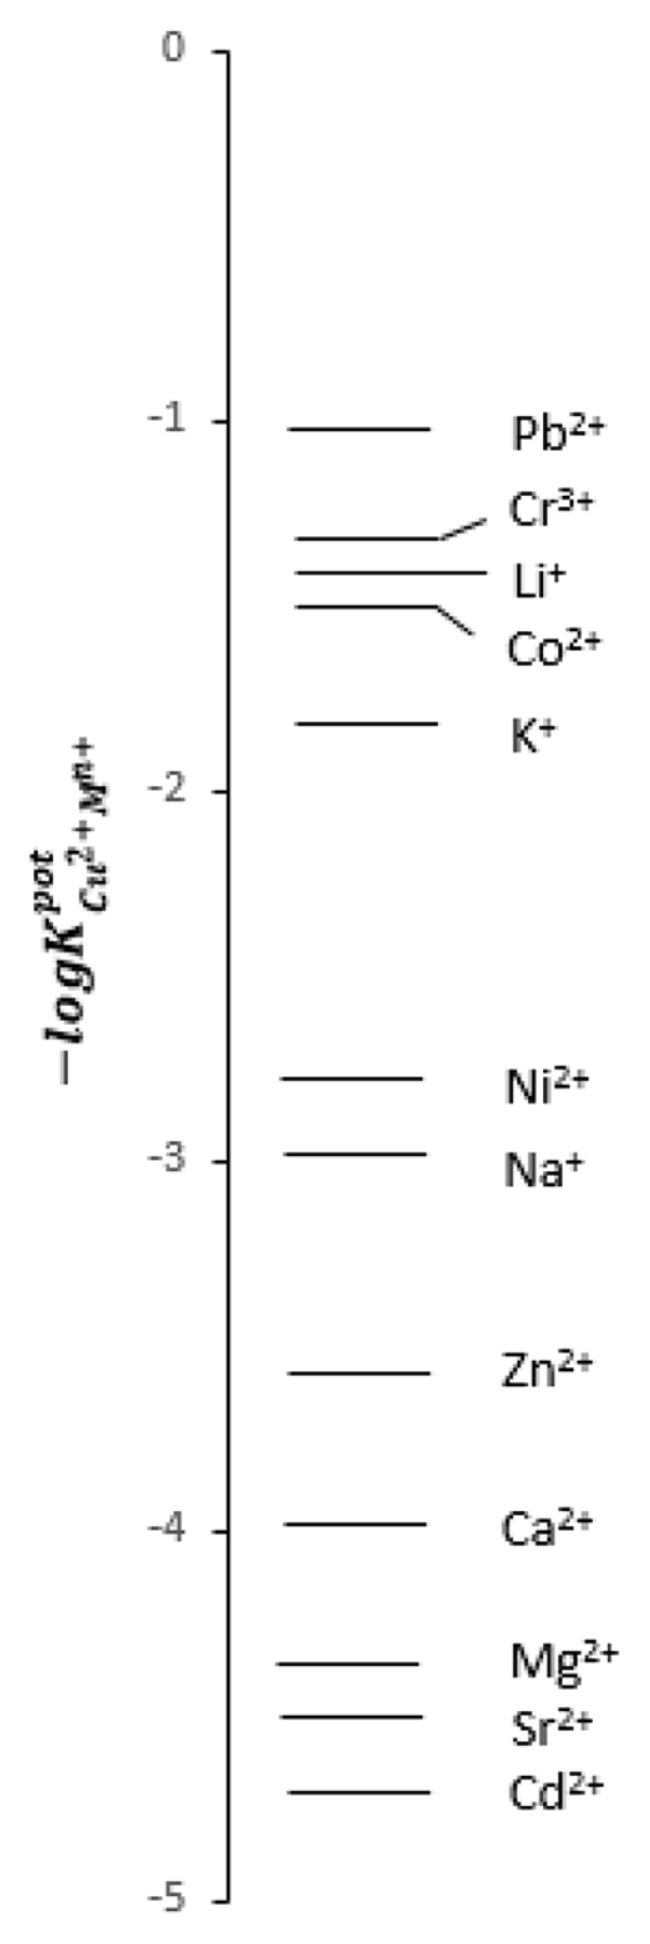
The potentiometric selectivity coefficients of the novel copper(II)–selective sensor.
If an ion–selective electrode has equivalent responses to two different ions, then
If
If
The smaller the
3.5. Response time
The response time of the copper(II)–selective sensor was determined using the method recommended by IUPAC [35]. For this purpose, the equilibration time of the proposed sensor at ten-fold concentration transitions was examined, and subsequently it was determined that the response time of the sensor is approximately 8 seconds (Fig. 6). As a result, it can be stated that the sensor has a very fast response time.
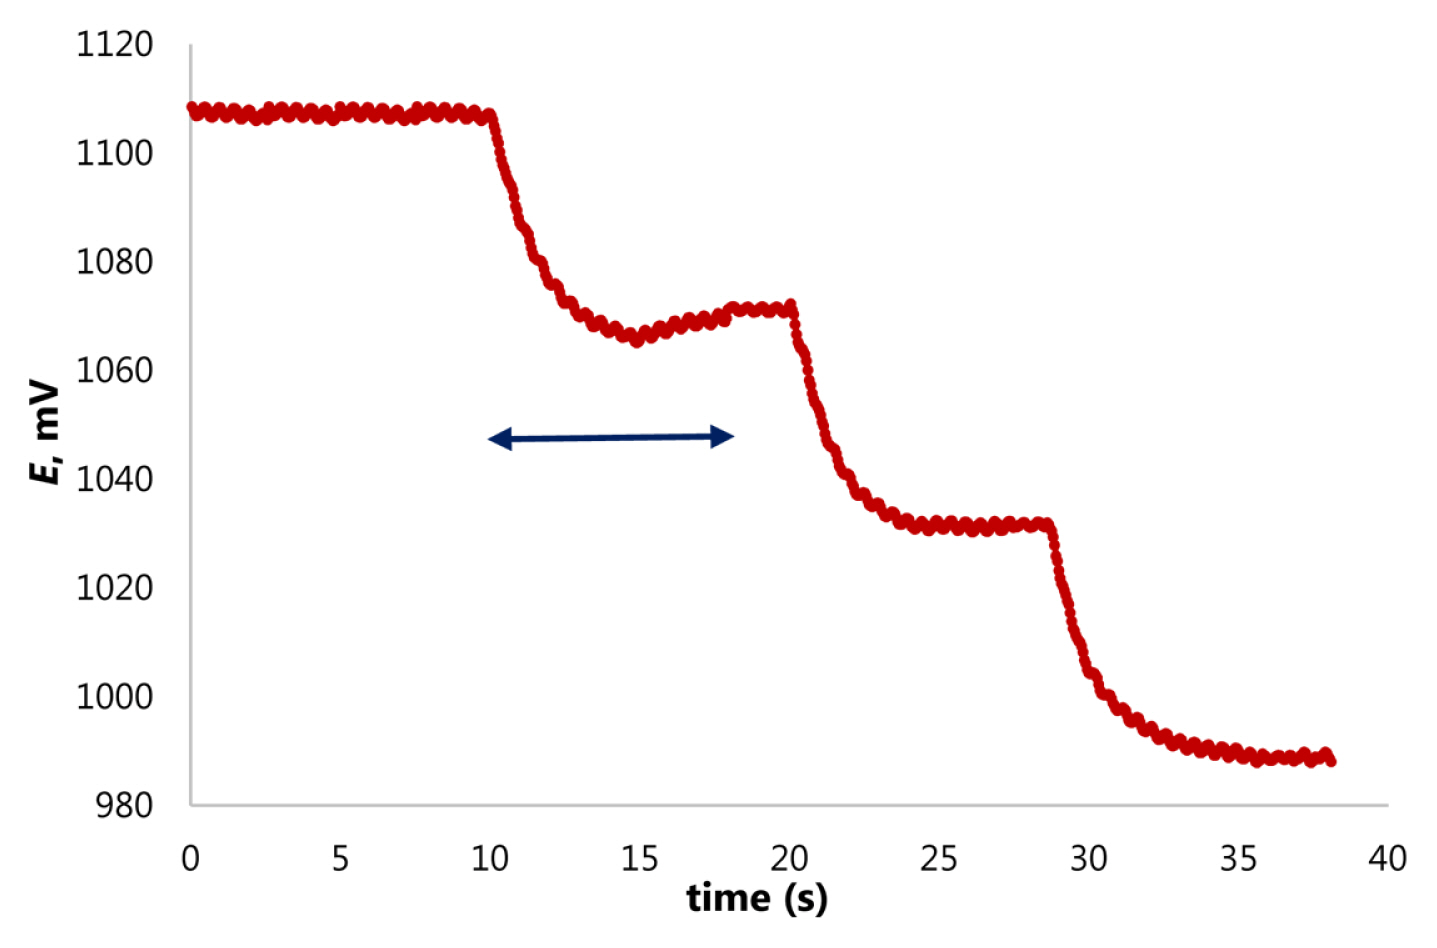
The response time of copper(II)–selective sensor.
3.6. pH effect
In this study, we determined the pH working range of the developed copper(II)–selective sensor using HNO3 (for pH 2.0–7.0) and NaOH (for pH 8.0–12.0) solutions. 1.0×10⁻² and 1.0×10⁻³ mol L−1 Cu(NO3)2 was added to the prepared acid and base solutions, and a direct potentiometric measurement was taken with the sensor. The potential response of the sensor in the pH 2.0–12.0 range is given in Fig. 7. Data given in this Fig. shows that at both concentrations the potential of the sensor remains constant in the pH 5.0 to 9.0 range, and that there are potential deviations at pH < 5.0 and pH > 9.0. The high potentials at pH < 5.0 may indicate that the sensor is responding to the hydrogen ions. On the other hand, the decrease in the sensor potential at pH > 9.0 might be due to the formation of Cu(OH)2 in the solution.
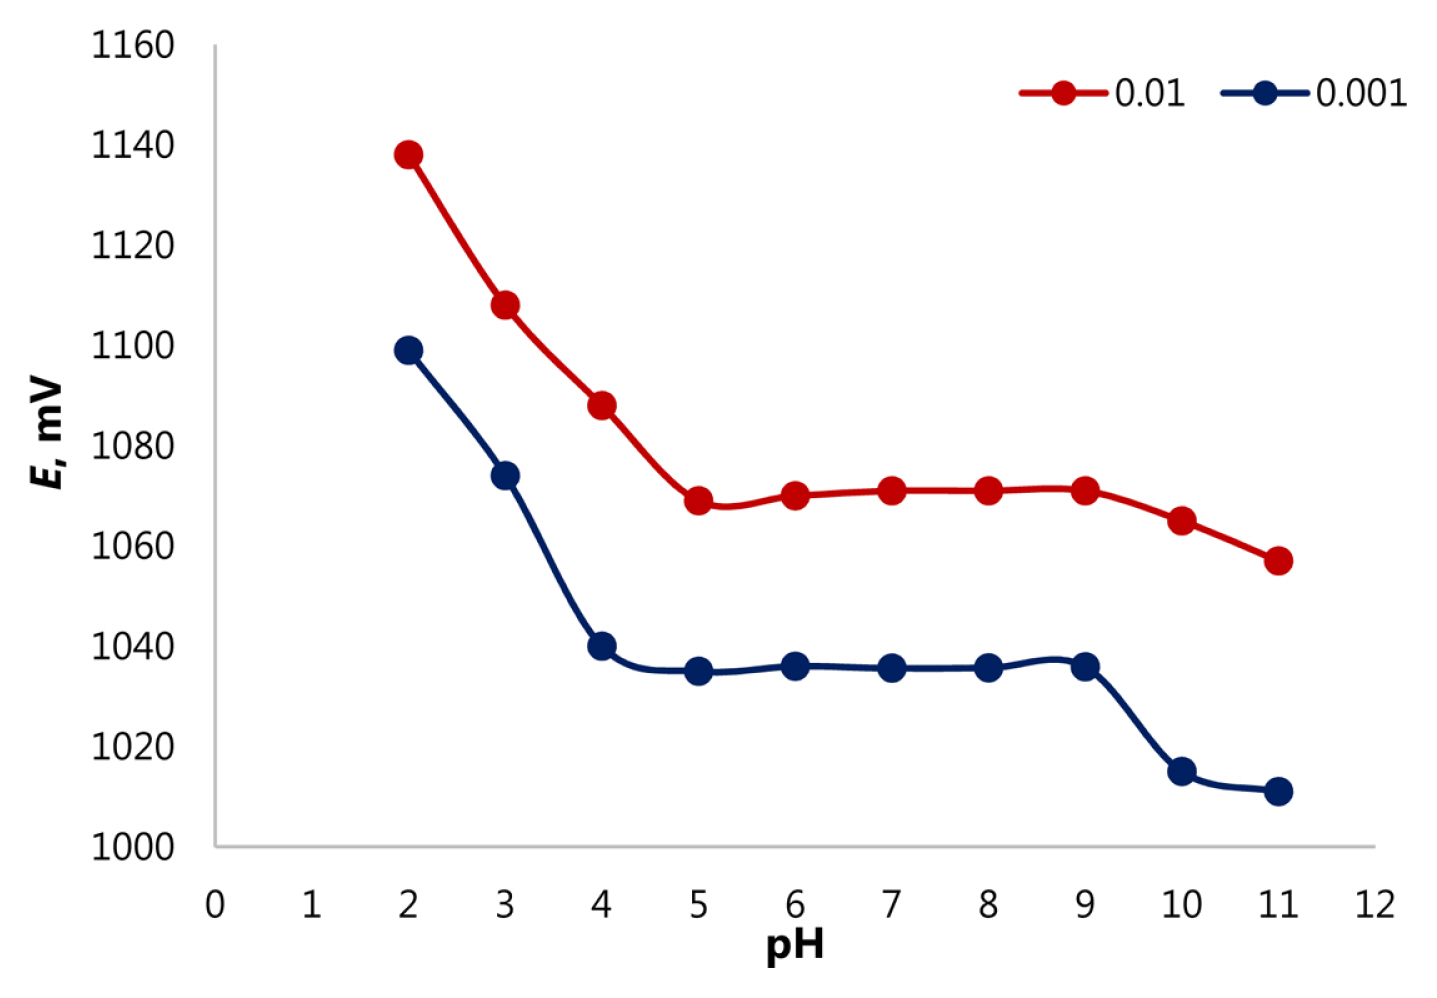
Effect of pH on the response of the copper(II)–selective sensor.
3.7. Analytical applications
In the first analytical application of the developed copper(II)–selective sensor, we performed copper(II) analysis on real samples. For this purpose, we added certain amounts of copper(II) to tea and water samples, and then measured their potentials with the developed sensor. Subsequently, we substituted the potential values obtained for each sample in the linear equation obtained from the calibration curve and determined the copper(II) amounts measured by the developed sensor. For real samples, the amounts of copper(II) added to the samples and those determined by the sensor are given in Table 4. Data given in this table clearly shows that the developed sensor can detect the presence of copper(II) ions in various samples with high recoveries.

Applications of the developed copper(II)–selective sensor in real samples
As another analytical application of the proposed sensor, we performed the potentiometric titration of copper(II) ions with EDTA at pH 4.5. Here, we investigated the usability of the developed sensor as an indicator electrode. Data showing the potentiometric titration of 1.0×10⁻³ mol L−1 Cu(NO3)2 with 1.0×10⁻² mol L−1 M EDTA is given in Fig. 8. As can be observed in this figure, there is a decrease in the electrode potential due to the complexation with the addition of EDTA. The end point corresponds to the 1:1 stoichiometry of the Cu(II):EDTA complex. As a result, we can propose that the proposed copper(II)–selective sensor can be used as an indicator electrode for the determination of copper(II) ions.
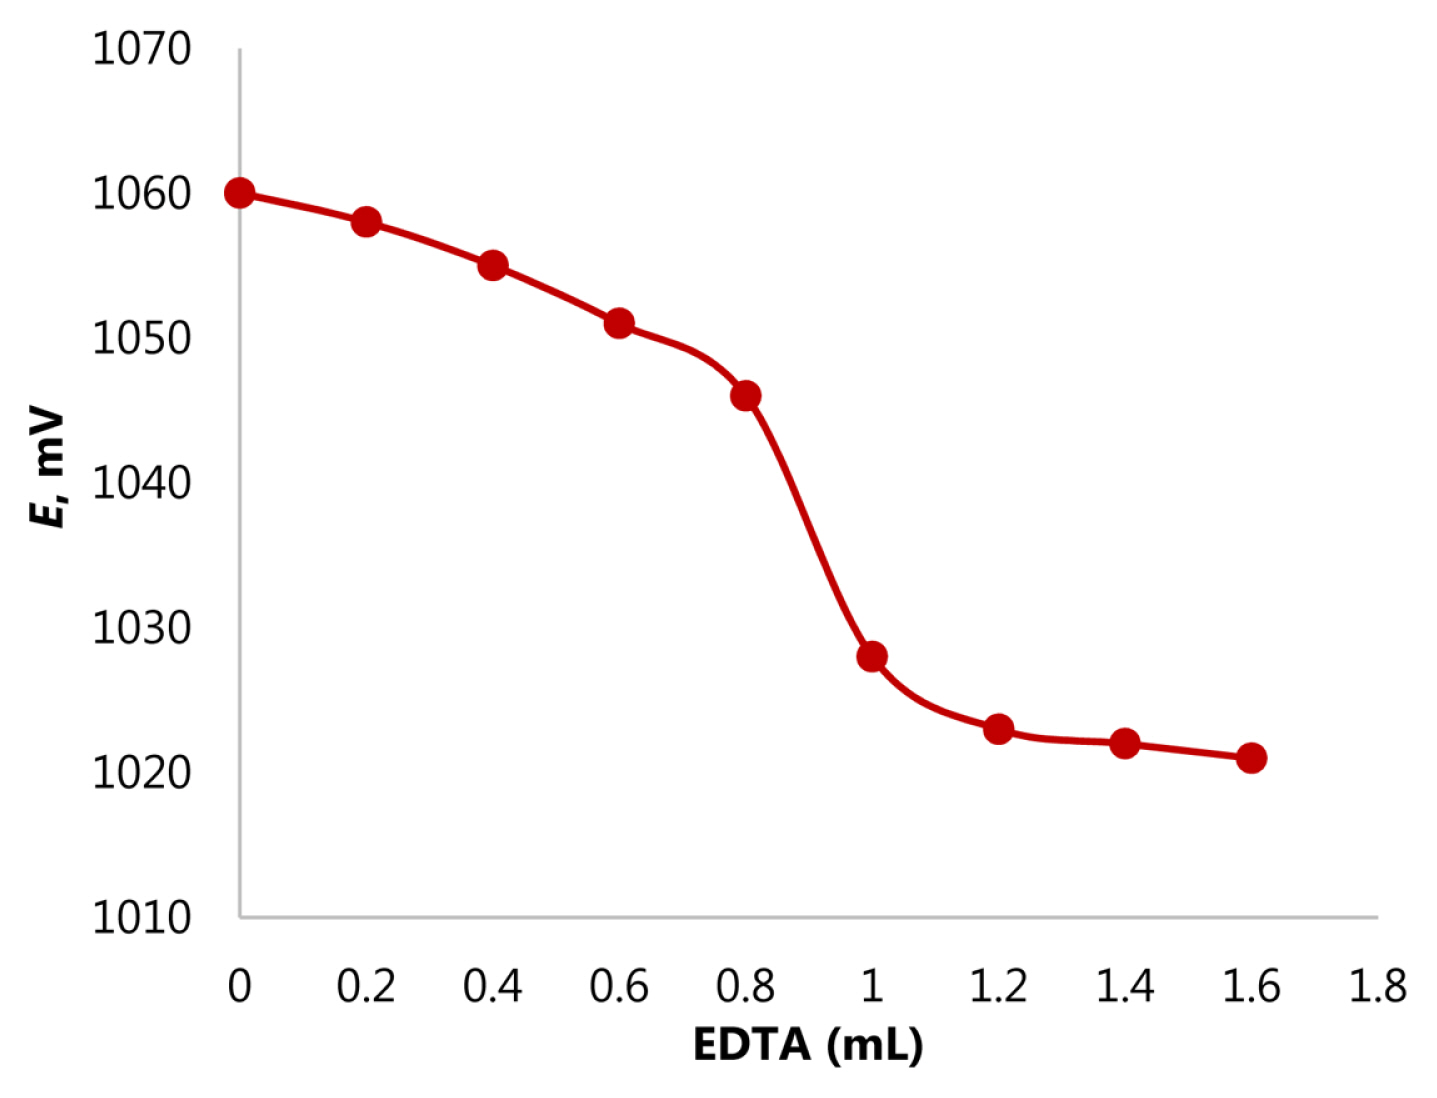
Potentiometric titration of Cu2+ ion with EDTA at pH 4.5.
3.8. Comparison study
The comparison of the developed copper(II)–selective sensor with the copper(II)–selective potentiometric ISEs previously reported in the literature in terms of concentration range, limit of detection, slope, pH working range and response time parameters are summarized in Table 5. Based on these data, the proposed novel copper(II)–selective sensor is superior to its counterparts in terms of important potentiometric performance features such as linear concentration range, limit of detection and response time. Considering pH working range, it works in a wider pH range than the most, without being affected by pH changes. Consequently, based on the data shown Table 5, we can state that this newly developed sensor has significant advantages over the potentiometric ion-selective electrodes reported previously in the literature in the determination of copper(II) ions.

Comparison of copper(II)–selective sensor with other potentiometric ISE previously reported in the literature
4. Conclusions
The precise and periodic monitoring of copper ions in the environment and various food products with low cost and compact devices is very important considering its adverse affects on wildlife and public health. In the present study, we developed a simple and low cost potentiometric sensor using (E)-2-((1H-pyrrol-2-yl)methylene)hydrazinecarbothioamide as an ionophore for the selective determination of Cu(II) ions in various samples such as tea and water samples. We evaluated its certain performance parameters and compared them with those of sensors previously reported in the literature, and found that the novel copper(II)–selective sensor is superior to its alternatives in terms of certain parameters including linear concentration range, limit of detection and response time. Based on the data presented in the current study, we propose that the novel copper(II)–selective potentiometric sensor can be utilized in diverse settings such as in resource–limited areas for the precise determination of this trace element. This is of very high importance considering the potential toxicity of copper on organisms above a certain threshold concentration.