Degradation of All-Solid-State Lithium-Sulfur Batteries with PEO-Based Composite Electrolyte
Article information
Abstract
Lithium-sulfur batteries (LSBs) have emerged as a promising alternative to lithium-ion batteries (LIBs) owing to their high energy density and economic viability. In addition, all-solid-state LSBs, which use solid-state electrolytes, have been proposed to overcome the polysulfide shuttle effect while improving safety. However, the high interfacial resistance and poor ionic conductivity exhibited by the electrode and solid-state electrolytes, respectively, are significant challenges in the development of these LSBs. Herein, we apply a poly (ethylene oxide) (PEO)-based composite solid-state electrolyte with oxide Li7La3Zr2O12 (LLZO) solid-state electrolyte in an all-solid-state LSB to overcome these challenges. We use an electrochemical method to evaluate the degradation of the all-solid-state LSB in accordance with the carbon content and loading weight within the cathode. The all-solid-state LSB, with sulfur-carbon content in a ratio of 3:3, exhibited a high initial discharge capacity (1386 mAh g−1), poor C-rate performance, and capacity retention of less than 50%. The all-solid-state LSB with a high loading weight exhibited a poor overall electrochemical performance. The factors influencing the electrochemical performance degradation were revealed through systematic analysis.
1. Introduction
In recent years, rechargeable battery technology has promoted the significant development of energy storage systems including mobile electric vehicles and portable devices [1,2]. Lithium-ion batteries (LIBs), commercialized by Sony in 1991, have played a key role in energy storage systems owing to their high power density in comparison to other secondary batteries. However, conventional LIBs are approaching their energy density limits. Therefore, meeting the needs of upcoming mobile electric vehicles and portable devices has become difficult [3]. In addition, transition metals such as LiCoO2 and LiNi1/3Co1/3Mn1/3O2, which are used in conventional LIBs, are expensive and toxic. Consequently, there is a significant demand for alternative rechargeable batteries that offer high energy density alongside economic viability, while utilizing abundant and environmentally friendly resources [4].
Among the promising alternatives, lithium-sulfur batteries (LSBs) offer a high theoretical specific capacity (1672 mAh g−1) and energy density (2600 Wh kg−1) [5]. In addition, the use of sulfur is beneficial, since it is abundant, cost-effective, and eco-friendly [6]. Despite these advantages, the commercialization of LSBs has been hindered by several inherent limitations. For instance, sulfur exhibits insulating properties that impart low ionic and electrical conductivities (5 × 10⁻³⁰ S cm−1) [7]. A polysulfide shuttle effect, induced by the dissolution of soluble lithium polysulfide species within the liquid electrolyte during the electrochemical reaction, poses another problem. Sulfur exists in the form of large molecules (cyclo-S8); consequently, it cannot be converted to Li2S via a one-step reaction. During the initial discharge process, lithium ions (Li+) from the anode react with the sulfur from the cathode to form soluble lithium polysulfides (Li2Sx, 4 ≤ x ≤ 8). Subsequently, continuous discharge transforms these soluble lithium polysulfides into insoluble Li2S2. Finally, the insoluble Li2S2 is transformed into Li2S. Throughout the discharge process, the soluble long-chain polysulfide anions migrate freely between the cathode and anode. Specifically, the long-chain lithium polysulfides migrate toward the anode and react with lithium, which reduces them to short-chain lithium polysulfides. Subsequently, the short-chain lithium polysulfides migrate back to the cathode to re-form long-chain lithium polysulfides. This continuous phenomenon, known as the “polysulfide shuttle,” induces an irreversible loss of sulfur, resulting in a rapid capacity reduction and poor performance [8–12].
Several studies have attempted to solve these problems through the application of porous nanostructured sulfur electrodes, such as multiwalled carbon nanotubes (MWCNTs) [13], reduced graphene oxide (rGO) sheets [14], hollow carbon nanofiber [15], and mesoporous carbon spheres [16]. These studies were aimed at increasing the electrical conductivity exhibited by sulfur and limiting the polysulfide migration by localizing the sulfur particles within the porous nanostructured sulfur-carbon electrode. Another study introduced solid electrolytes in order to inhibit polysulfide migration and improve safety through the introduction of a physical barrier [17]. Solid electrolytes are primarily classified as solid organic electrolytes and inorganic electrolytes. Poly(ethylene oxide) (PEO) is among the most widely employed polymer-based (poly-ether species) solid organic electrolytes. The chain structure of PEO is rich with ether bonds that promote salt dissolution and ion delivery. Additionally, PEO can reduce the interfacial resistance between the electrodes and solid electrolytes by decreasing the crystallinity between 60 and 90°C [17,18]. With regard to inorganic solid electrolytes, sulfide solid electrolytes have been studied extensively for LSB applications owing to their good interfacial contact with the electrode and high ionic conductivity (10−4–10−2 S cm−1) [19]. The high ionic conductivity with sulfur ions (S2−) is attributed to their polarization capability, which is greater than that of oxygen ions (O2−) [19]. In terms of reactions with lithium, common electrode materials, moisture, and air, oxide solid electrolytes exhibit greater stability than sulfide solid electrolytes [20]. However, oxide solid electrolytes exhibit poor interfacial contact with the electrode material because of their rough and hard surface morphology, which imparts a high interfacial resistance [21]. Recently, the Cui group reported the use of a solid-state composite electrolyte composed of garnet-type Li7La3Zr2O12 (LLZO) and PEO in an attempt to symbiotically combine the advantages exhibited by polymer and oxide solid electrolytes. In PEO based matrix, the garnet-type LLZO acts as: (a) a filler to improve the ionic conductivity and (b) an interfacial stabilizer to reduce the interfacial resistance, in which well known as ‘ceramic in polymer’ structure. The solid-state composite electrolyte exhibited a high ionic conductivity of 1.1 × 10⁻⁴ S cm−1 at 40°C. In addition, the solid-state LSB delivered an acceptable specific capacity of over 900 mAh g−1 at 37°C [22,23]. However, all solid state LSB with solid-state composite electrolyte of the ‘polymer in ceramic’ structure has not yet been investigated.
Herein, we report an all-solid-state LSB consisting of a solid-state composite electrolyte sheet with ‘polymer in ceramic’ structure. When the number of fillers in LLZO increase, the internal structure changes from ‘ceramic in polymer’ to ‘polymer in ceramic’, and the overall Li+ conductivity is mainly attributed to the conductivity of LLZO ceramics [23]. We fabricate a sulfur-carbon composite cathode via a facile physical method by varying the ratio of sulfur and carbon. An all-solid-state LSB was fabricated with a solid-state composite electrolyte, sulfur-carbon composite cathode, and lithium metal anode. The degradation exhibited by the all-solid-state LSB was evaluated in accordance with the carbon content and loading weight within the cathode.
2. Material and Methods
2.1. Preparation of materials
Sulfur powder (99.5%, D50: ~150 μm, NEI Co. Ltd) and carbon black (super P) were prepared as a sulfur-carbon blended powder through a simple dry ball milling process (Planetary ball mill, Fritsch). Sulfur-carbon weight ratios of 5:1, 4:2, and 3:3 were prepared. The obtained sulfur-carbon blended powders were analyzed using X-ray diffraction (XRD).
2.2. Composite solid electrolyte sheet
The LLZO powder (cubic structure, 99.9%, D50: ~10 μm, Toshima) and PEO (Mw=200 K, Sigma-Aldrich) were prepared in a respective weight ratio of 7:3 and subsequently added to PEO:LiClO4 (prepared in molar ratio of 20:1). This mixture was used to prepare a solid-state composite solid electrolyte sheet. The mixture was then dispersed throughout an acetonitrile (ACN) solvent using a Thinky Mixer operating at 1800 rpm for 10 min. The resultant slurry was cast onto a Mylar film (SKC Co. Ltd., coated SiO2) and dried at 25°C (in a dry room) for 24 h. The final composite solid electrolyte sheet was ~150 μm thick. The ion conductivity of composite solid electrolyte sheet was 3.8 × 10⁻⁴ S cm−1 via electrochemical impedance spectroscopy (EIS) test at 70°C. Impedance was measured with an amplitude of 10 mV from a frequency of 7 MHz to 100 mHz through a two-probe method.
2.3. Structural and physical characterization
XRD patterns were obtained using an X’pert Pro X-ray diffractometer (PANalytical) with Ni-filtered Cu-Kα radiation (λ = 1.5406 Å), operating at 40 kV and 30 mA with a scanning angle (2θ) between 10 and 60° (measured in 0.01° steps). Field-emission scanning electron microscopy (FE-SEM, HITACHI S-4700) and energy-dispersive X-ray spectroscopy (EDS) were used to observe the surface morphology and elemental distribution. Additionally, focused ion beam-scanning electron microscopy (FIB-SEM, HITACHI S-4700) was conducted to evaluate the cross-sectional composition exhibited by the cathode before and after cycling.
2.4 Cell assembly and electrochemical measurements
The oxide solid electrolyte LLZO powder (PEO and LiClO4, Sigma-Aldrich) was mixed with the sulfur-carbon blended powder to fabricate the sulfur-carbon composite cathode. The LLZO:PEO weight ratio was fixed at 1:3 and LiClO4 (Li salt) was added to PEO:LiClO4 in a molar ratio of 20:1. The mixture was then dispersed in an ACN solvent using a Thinky Mixer (ARE-310) operating at 1800 rpm for 10 min. The resultant slurry was then cast onto an aluminum foil and dried at 25°C (in a dry room) for 24 h to form the sulfur-carbon composite cathode.
To perform the electrochemical measurements, a solid-state LSB (coin cell, CR2032), consisting of a sulfur-carbon composite cathode, a lithium metal counter electrode, and a composite solid electrolyte, was fabricated in a dry room. Galvanostatic testing (WBCS 3000L, Wonatech) of the assembled cell was performed across the voltage range of 1.0–3.0 V vs. Li+/Li at 70°C with several current densities. To identify any fluctuations in the resistance exhibited by the assembled cell before and after cycling, electrochemical impedance spectroscopy (EIS) was performed (Bio-Logic Science, SP-240) in the frequency range of 100 mHz to 1.0 MHz at 70°C.
3. Results and Discussion
Fig. 1 shows the XRD patterns obtained from the sulfur-carbon blended powders prepared using a simple ball milling method. Fig. 1 (a), (b), and (c) represent patterns for sulfur-carbon weight ratios of 3:3, 4:2, and 5:1, respectively. The intense peaks observed in Fig. 1 (a), (b), and (c) coincide with the pure sulfur powder peaks observed in Fig. 1 (d), which were indexed as S (113), (222), (026), (206), (311), (313), and (044) reflections [24]. These results suggest that no structural change occurred in the powders prepared via physical ball milling; however, the nano-sized carbon particles affected the intensity of the peaks.
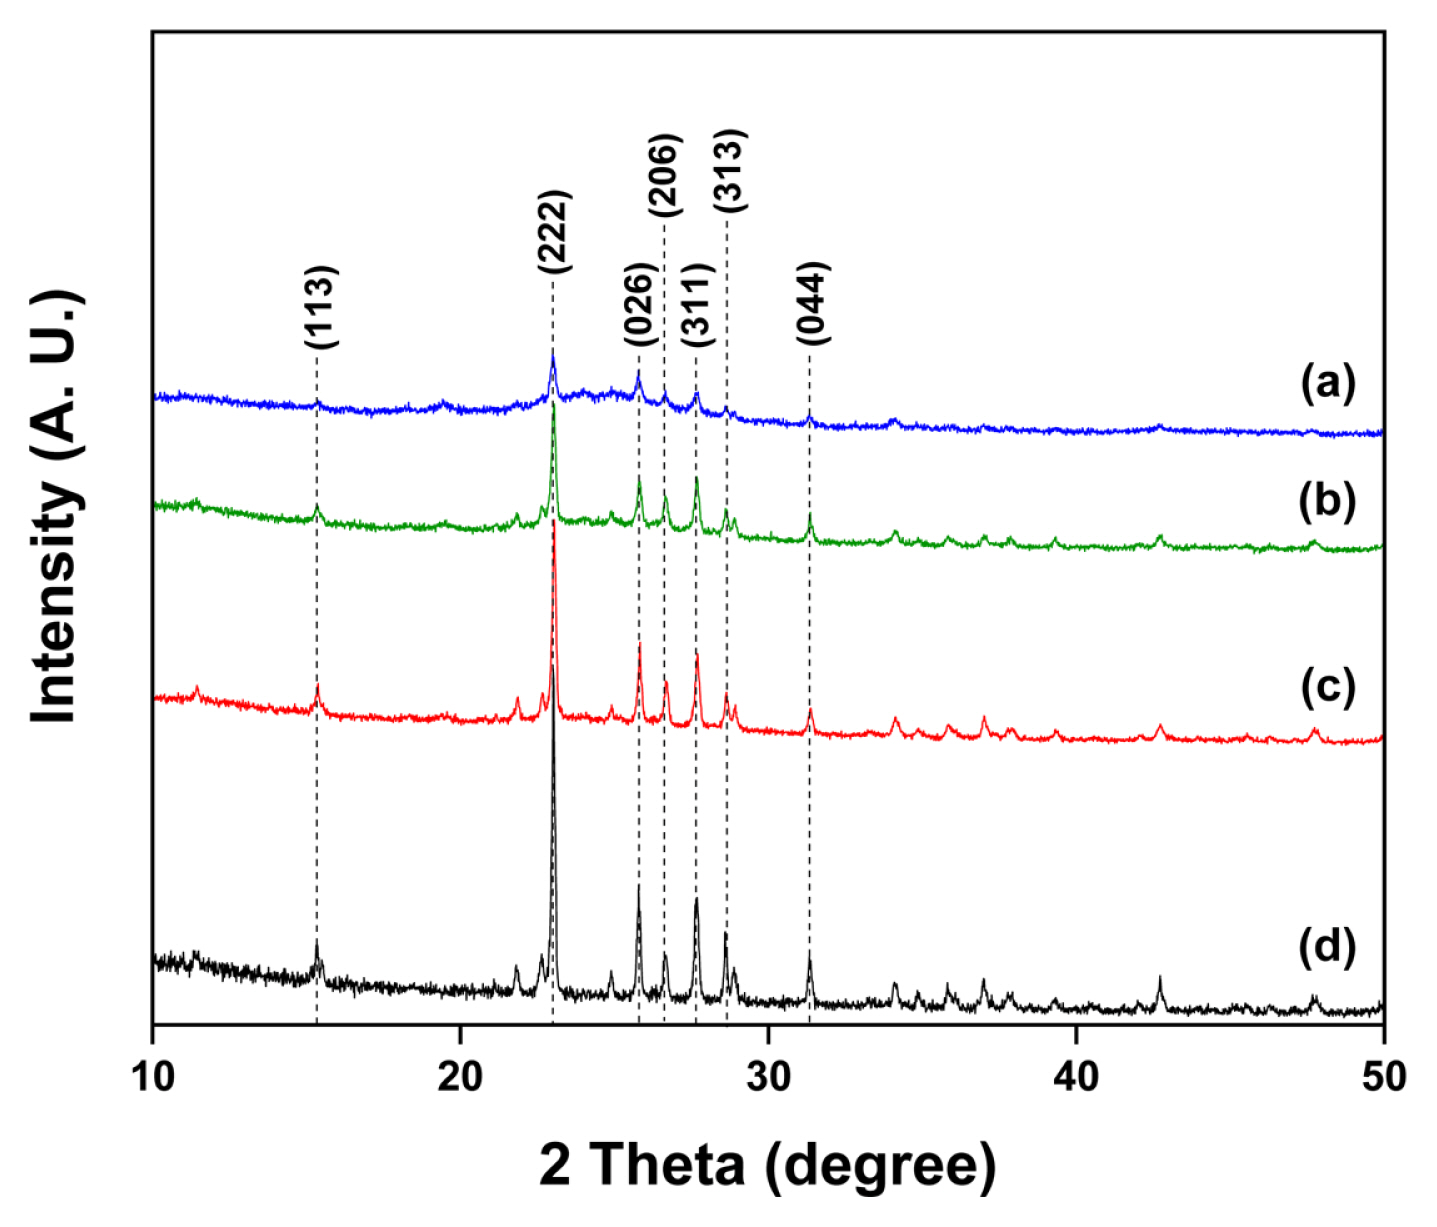
XRD patterns obtained from sulfur-carbon blended powders: (a) S:C = 3:3, (b) S:C = 4:2, (c) S:C = 5:1, and (d) pure sulfur powder.
Subsequently, the surface morphology of the sulfur-carbon composite cathodes prepared via slurry casting was investigated using FE-SEM (Fig. 2). The sulfur-carbon composite cathodes, in which the PEO:LLZO weight ratio was fixed at 3:1, were prepared with sulfur-carbon weight ratios of (a) 3:3, (b) 4:2, and (c) 5:1. The active materials such as sulfur and carbon and the solid electrolyte (LLZO) were visually observed through the FE-SEM images. Furthermore, the sulfur, carbon, and LLZO distributions throughout the composite cathode were evaluated using SEM-EDS. The EDS mapping images shows the mapping images obtained for S, C, Zr, La, and O within the composite cathode. S, C, and LLZO were homogeneously distributed throughout the cathode. Cl represents Li salt within LiClO4 at the surface of the sulfur-carbon composite cathode. The EDS mapping images shows that the cathode materials were homogeneously dispersed according to their sulfur-carbon weight ratios.
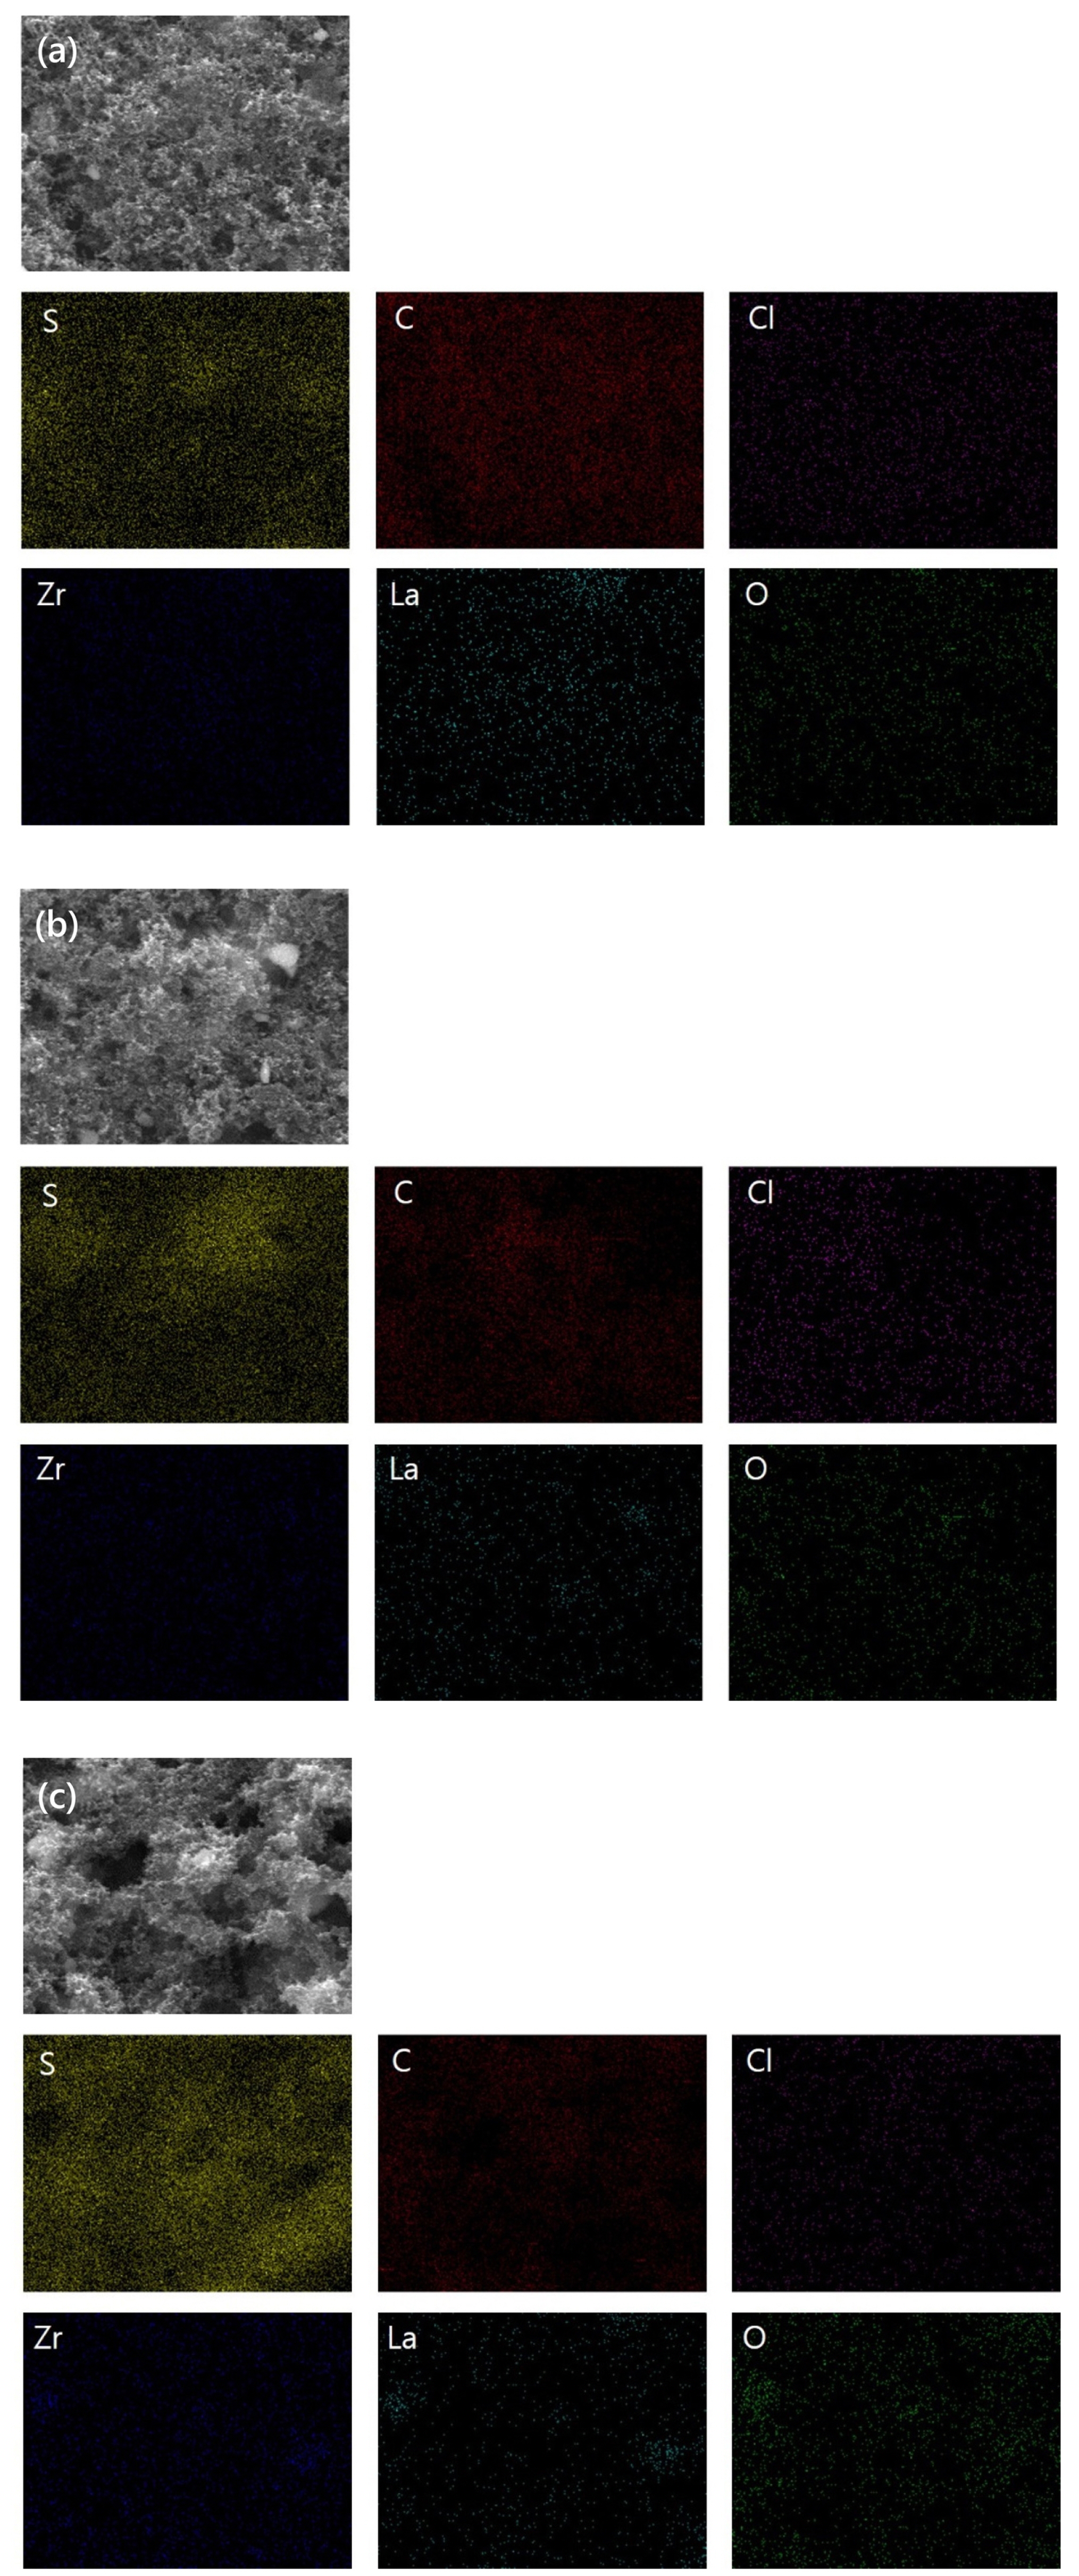
FE-SEM and EDS mapping images of (a) S:C = 30:30, (b) S:C = 40:20 and (c) S:C = 50:10 sulfur-carbon composite cathode surface and showing S, C, Cl, Zr, La and O element.
Fig. 3 presents the galvanostatic initial charge-discharge profiles for the all-solid-state LSBs with composite cathodes. The sulfur-carbon weight ratios for Fig. 3 (a), (b), and (c) are 3:3, 4:2, and 5:1, respectively. The current density, voltage range, and temperature are 0.1 C, 1.0–3.0 V, and 70°C, respectively. The loading weight in all the three cases is 1.5 mg cm−2. The composite cathodes in Fig. 3 (a), (b), and (c) exhibit initial discharge capacities of 1386, 946, and 515 (total weight of electrodes: 415, 388 and 258) mAh g−1, respectively. As shown in the charge-discharge profile, an increase in the carbon ratio enhances the initial capacities while decreasing the voltage discrepancy between the charge and discharge plateaus (ΔE). In other words, the sample shown in Fig. 3 (a) exhibits faster reaction kinetics in comparison with the reaction kinetics of the other samples, because of an enhanced electron pathway.
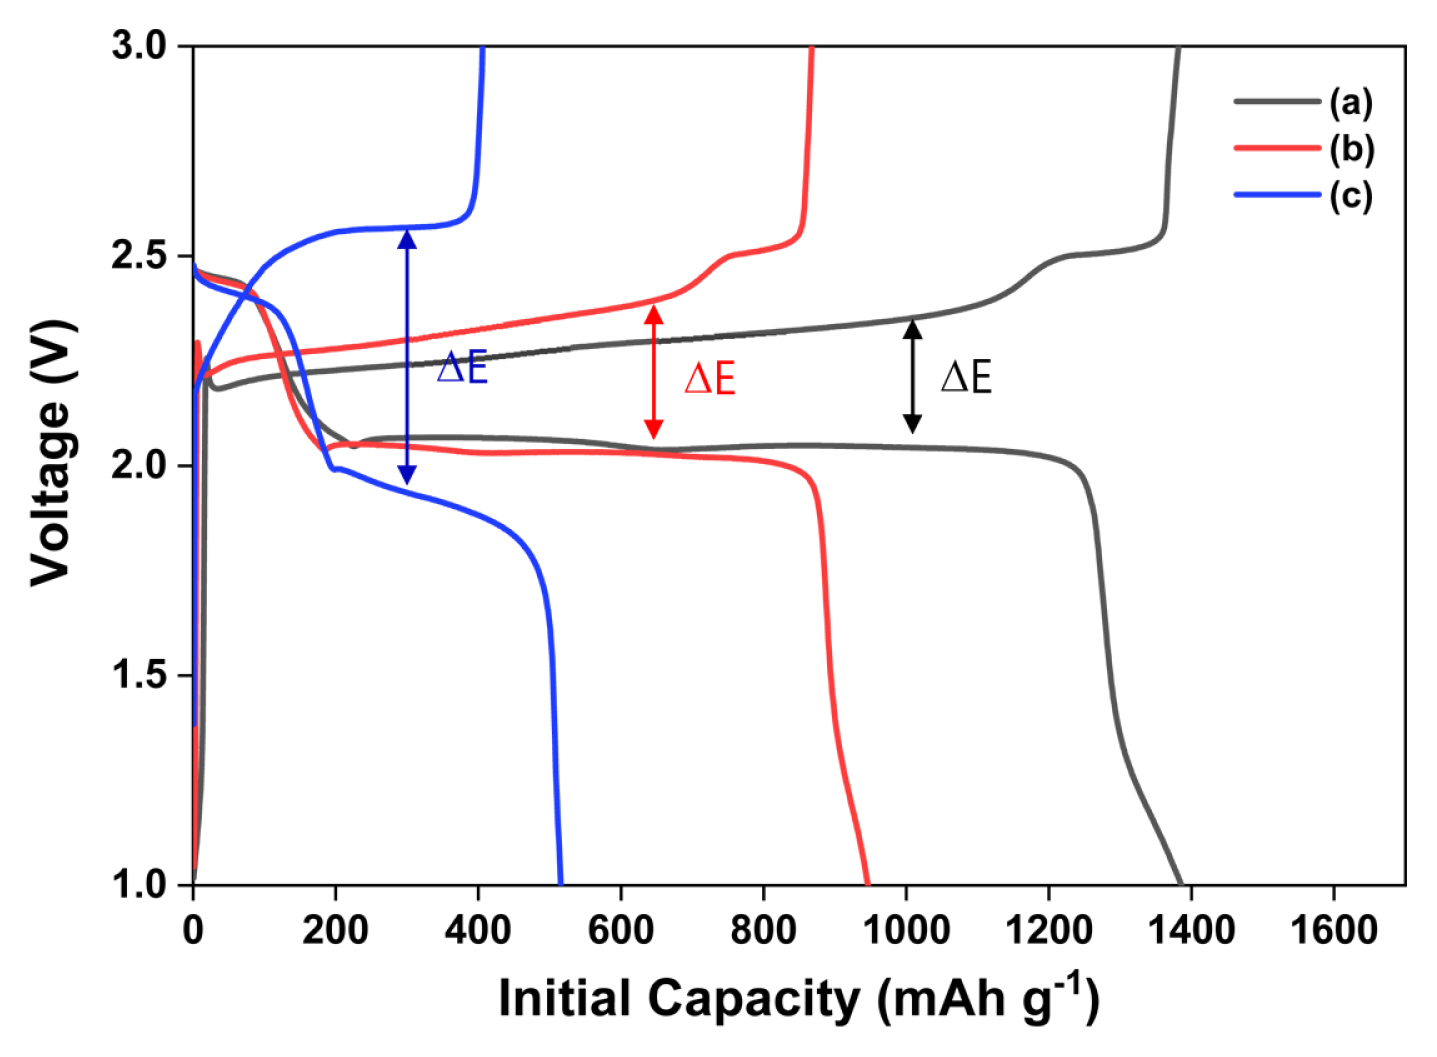
Initial charge-discharge profile obtained from the all-solid-state lithium-sulfur batteries with composite cathodes: (a) S:C = 3:3, (b) S:C = 4:2, and (c) S:C = 5:1; the voltage, current density, and operating temperature are 1.0–3.0 V, 0.1 C, and 70 °C.
Fig. 4 illustrates the rate performance of the all-solid-state LSBs with composite cathodes. The sulfur-carbon ratios for Fig. 4 (a), (b), and (c), are equivalent to the sulfur-carbon ratios for Fig. 3 (a), (b), and (c), respectively. The loading weight in all the three cases is 1.5 mg cm−2. The current densities, voltage, and temperature are 0.1–1.0 C, 1.0–3.0 V, and 70 °C, respectively. As shown in Fig. 4 (a), discharge capacity retentions of 100%, 83%, 42%, and 32% are achieved at current densities of 0.1, 0.2, 0.5, and 1.0 C, respectively. The results in Fig. 4 (b) show discharge capacity retentions of 100%, 83%, 42%, and 32% for current densities of 0.1, 0.2, 0.5, and 1.0 C, respectively. In contrast, the results in Fig. 4 (c) show poor discharge capacity retentions of 100%, 39%, 3%, and 0% at current densities of 0.1, 0.2, 0.5, and 1.0 C, respectively. At higher C rates, the migration of lithium ions through the solid electrolyte is inhibited more significantly in comparison with the inhibition experienced in case of a liquid electrolyte. Hence, the all-solid-state LSBs exhibit poor C-rate performance. In addition, as the weight of carbon decreases, the discharge retention exhibits a corresponding decrease as a result of the degraded electron pathway.
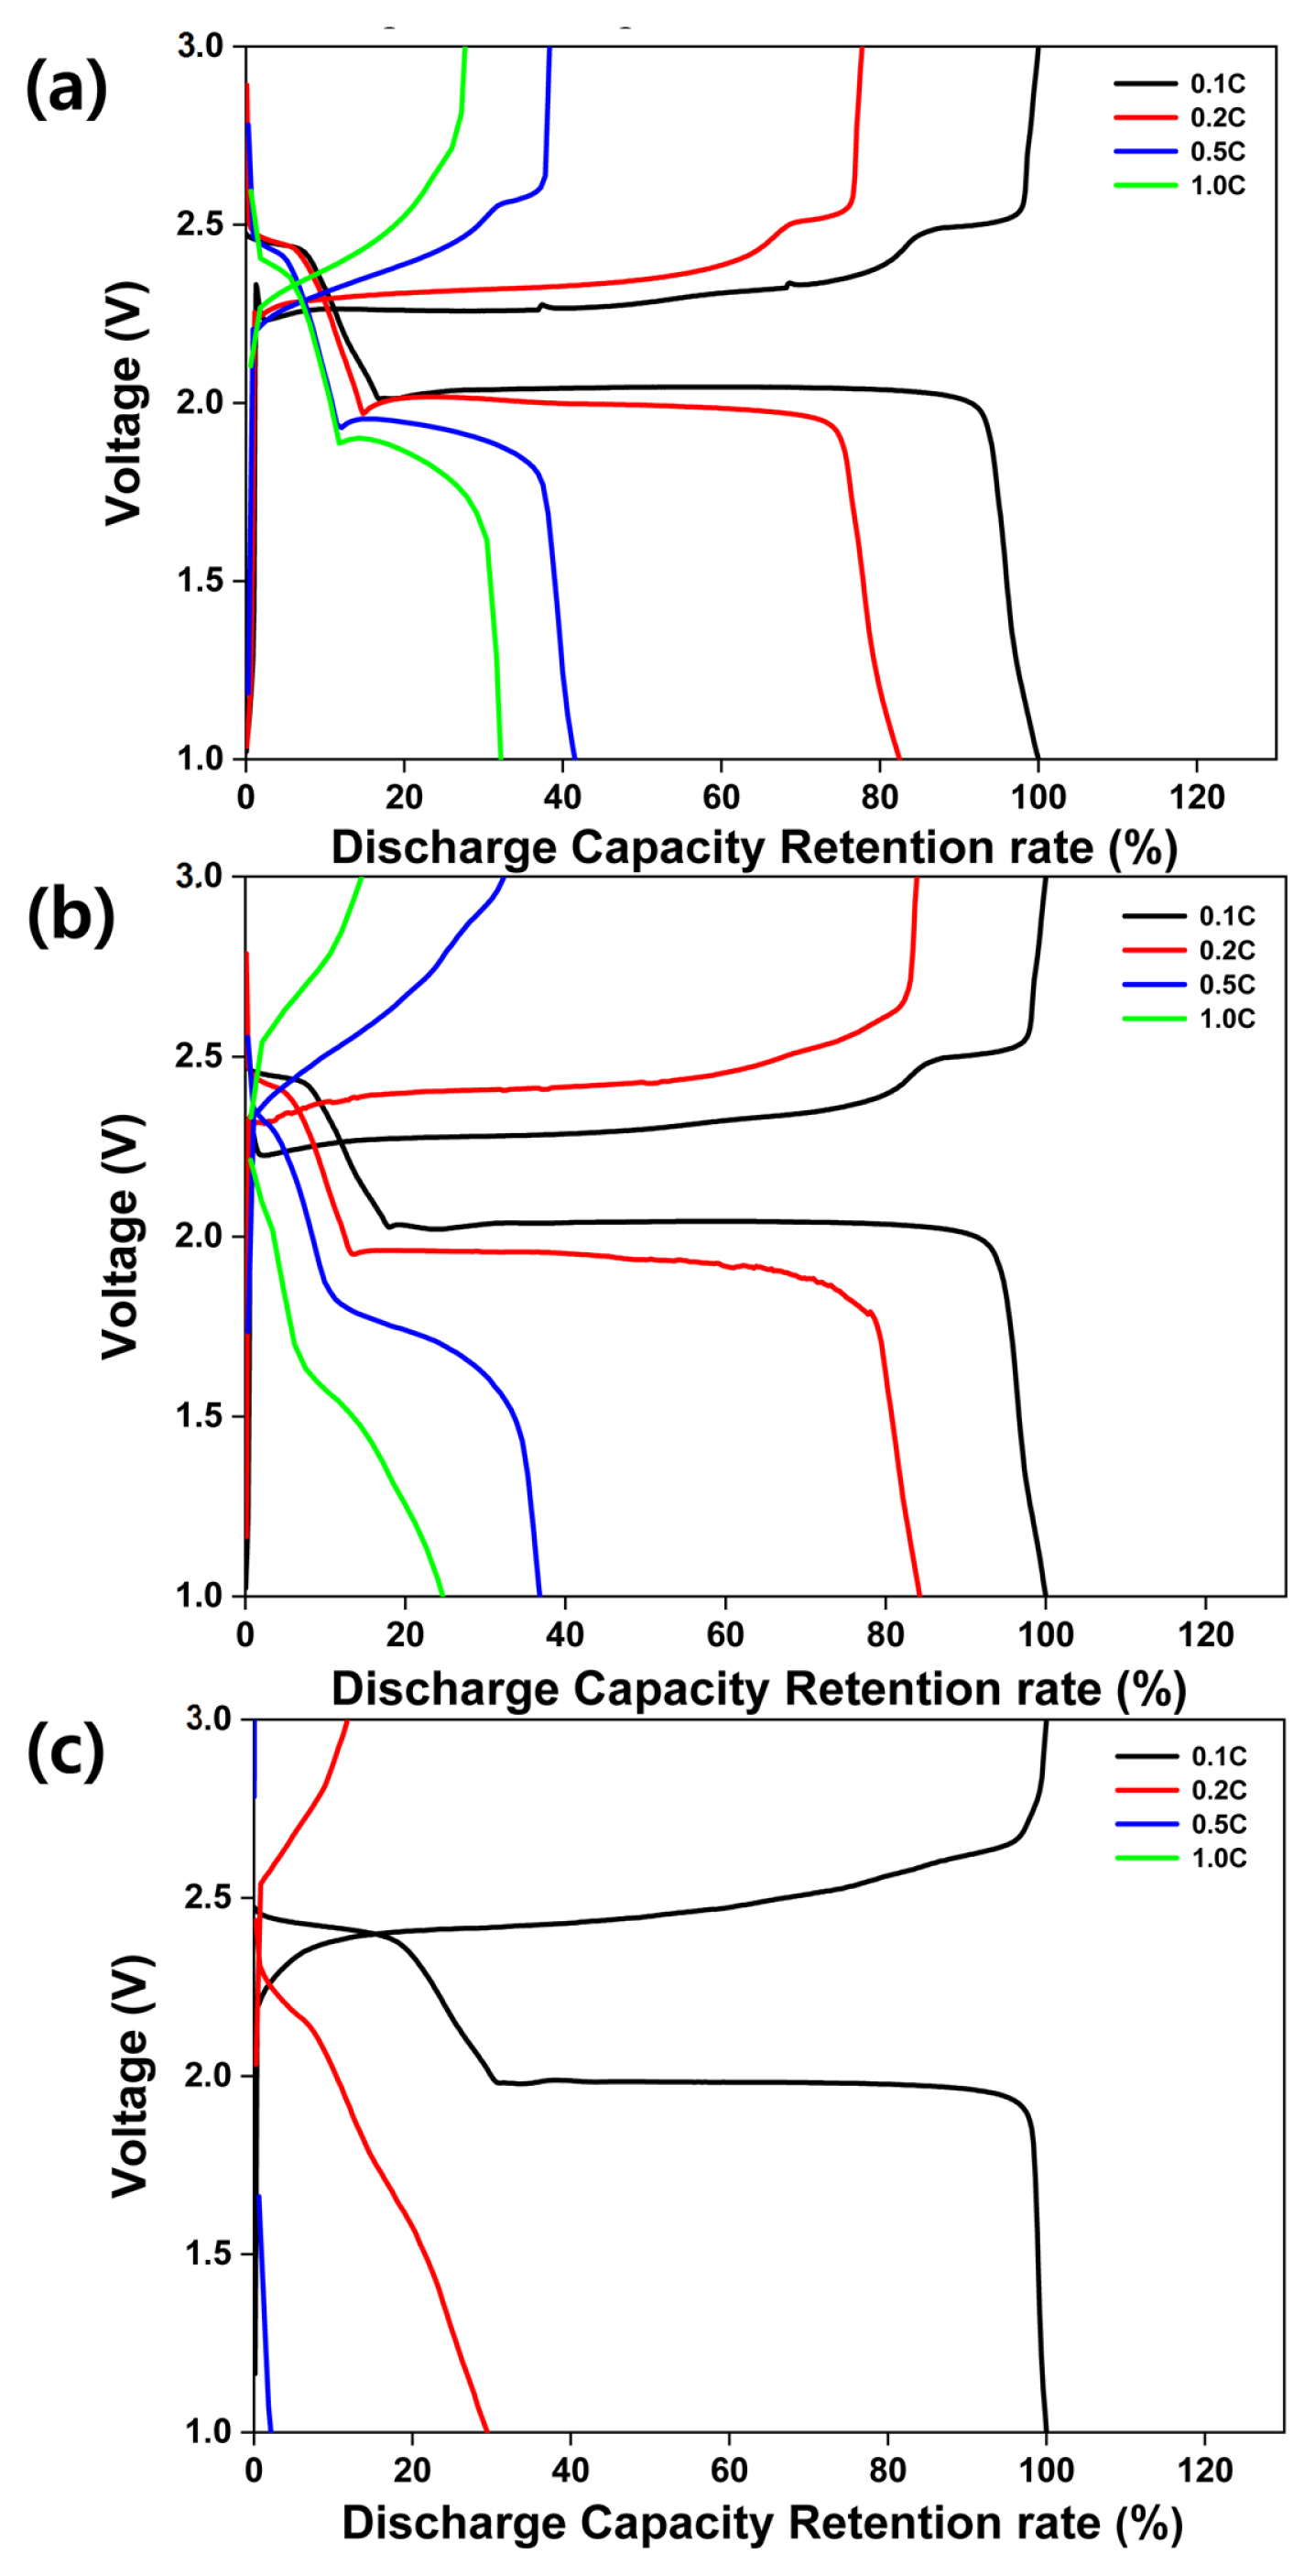
Rate performance exhibited by the all-solid-state lithium-sulfur batteries with (a) S:C = 3:3, (b) S:C = 4:2, and (c) S:C = 5:1 composite cathodes. The voltage and operating temperature are the same as for Fig. 4. Current densities are 0.1, 0.2, 0.5, and 1.0 C.
Fig. 5 presents the cycling performance of the all-solid-state LSB with sulfur-carbon ratios of (a) 3:3, (b) 4:2, and (c) 5:1. The loading weight, current density, voltage, and temperature are 1.5 mg cm−2, 0.1 C, 1.0–3.0 V, and 70°C, respectively. Fig. 5 (a) shows drastic discharge capacity fading between the 1st (1386 mAh g−1) and 50th cycles (452 mAh g−1). The sample exhibits a high initial discharge capacity; however, the discharge capacity drops sharply between the 1st and 30th cycles, beyond which it decreases linearly until the 50th cycle. Fig. 5 (b) shows the discharge capacity fade between the 1st (946 mAh g−1) and 50th cycles (460 mAh g−1). The sample exhibits a linear discharge capacity decrease until the 50th cycle. Fig. 5 (c) shows an unstable charge-discharge curve and a decline in the discharge capacity from 151 to 45 mAh g−1.
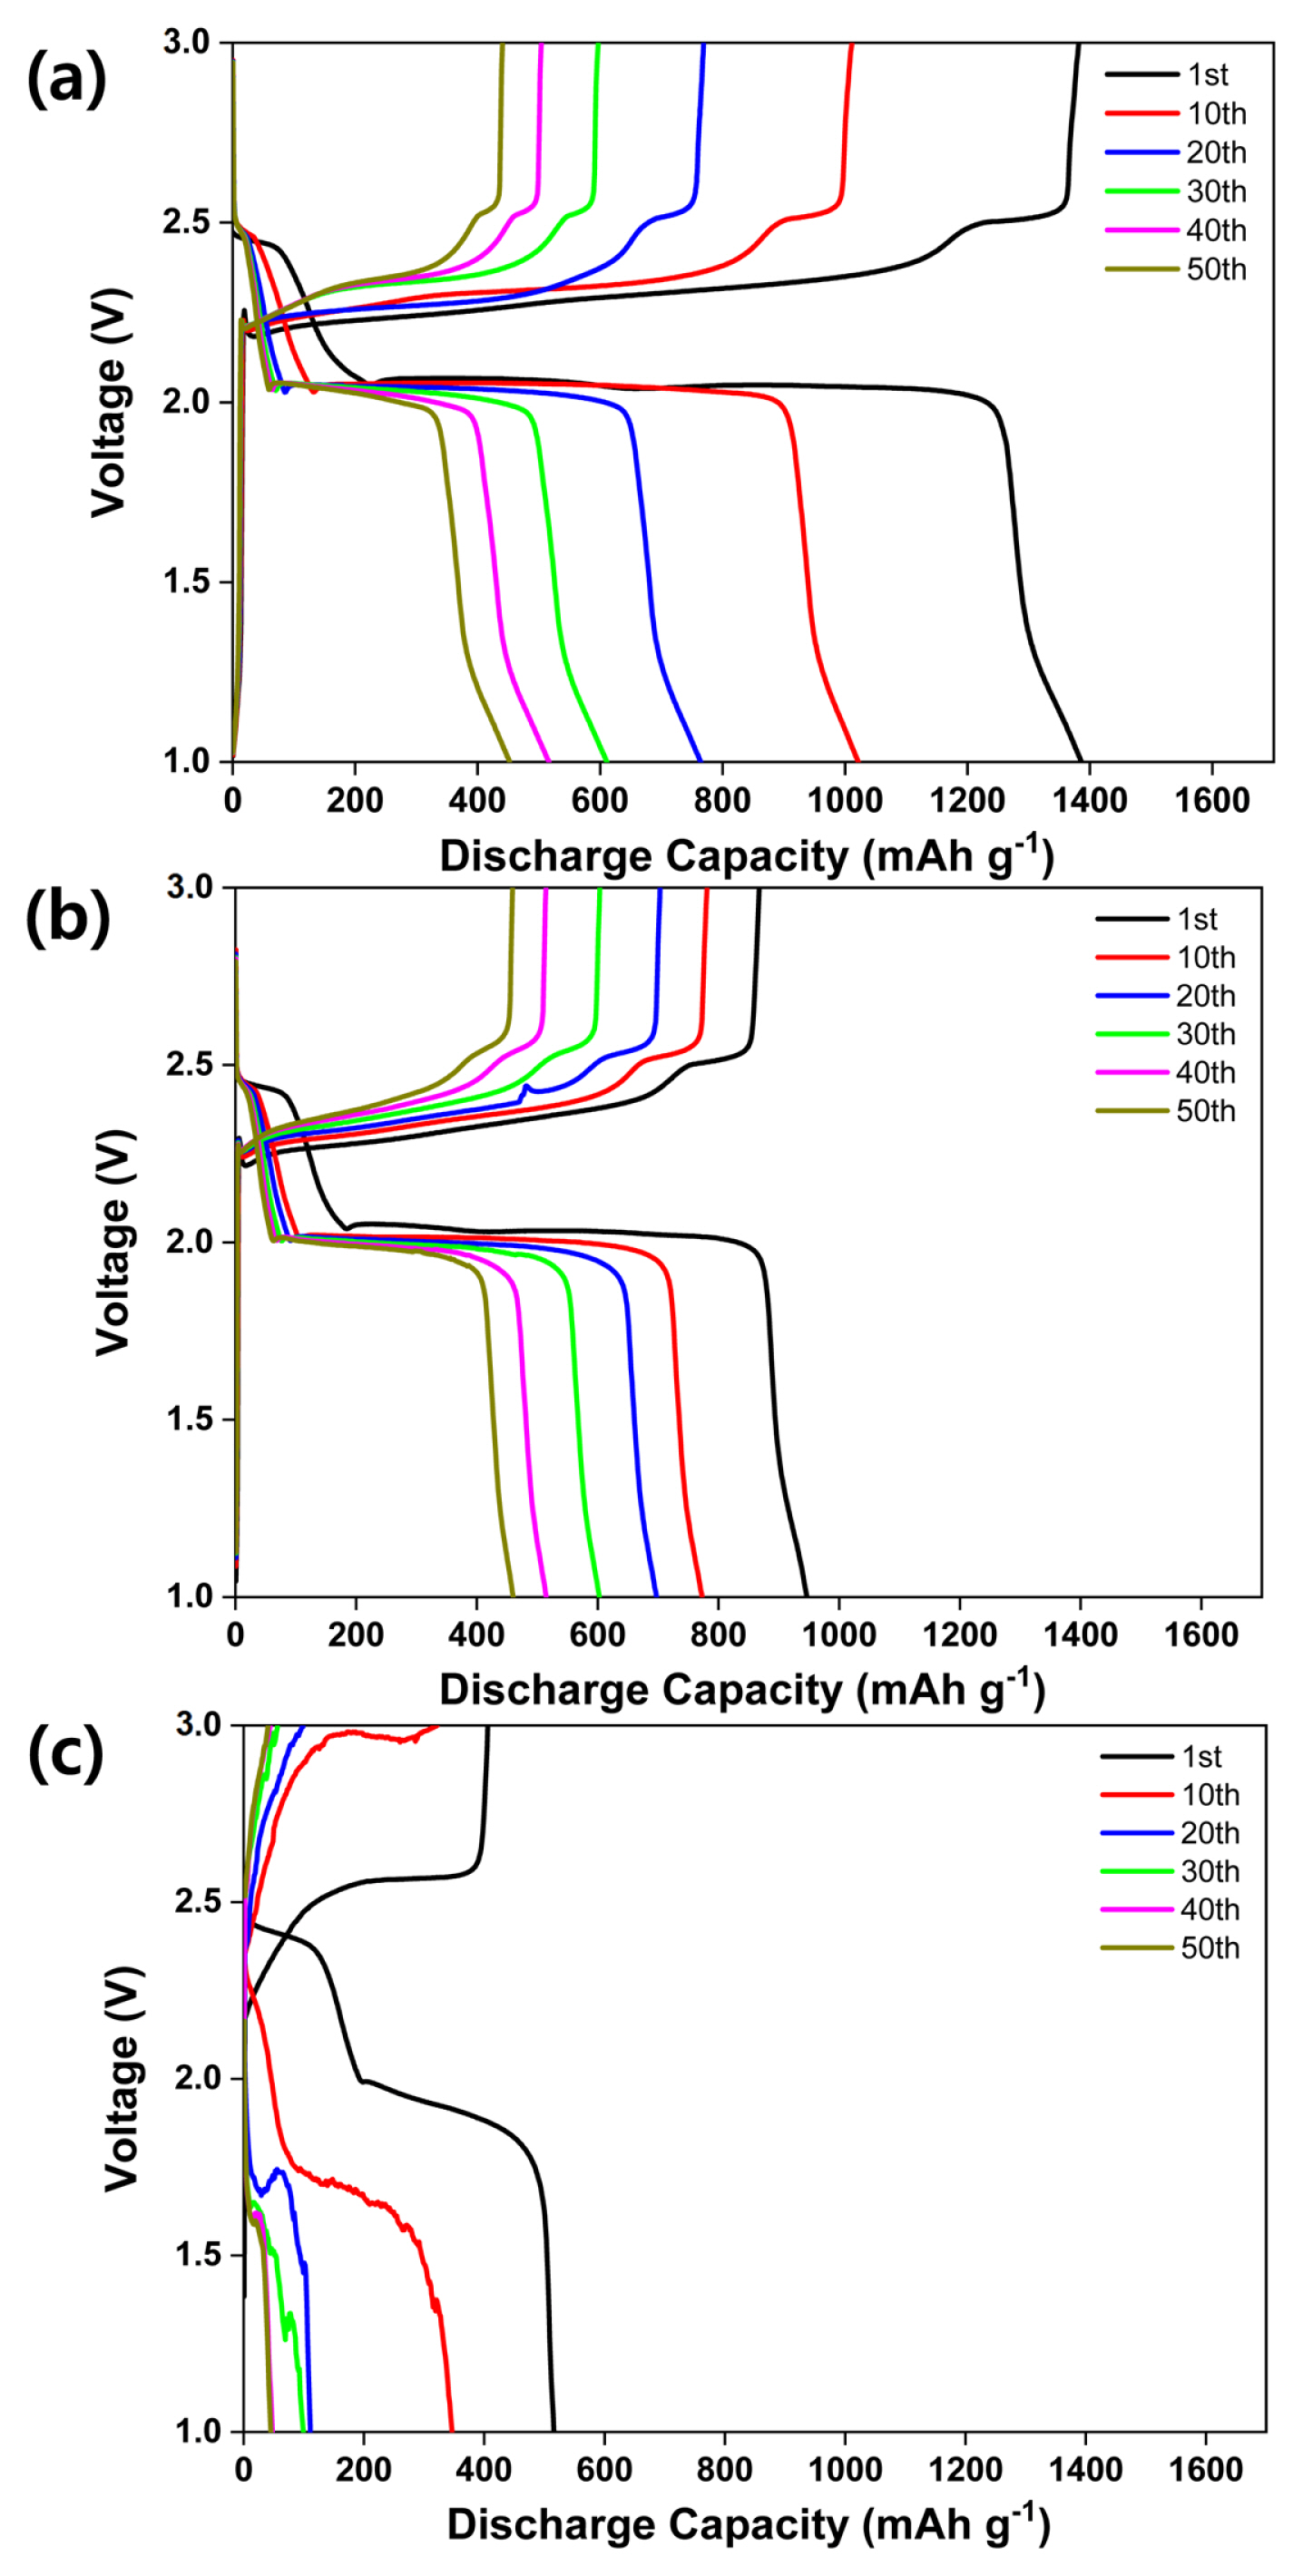
Cycling performance exhibited by all solid-state lithium-sulfur batteries with (a) S:C = 3:3, (b) S:C = 4:2, and (c) S:C = 5:1 composite cathodes; obtained at a voltage range between 1.0 and 3.0 V, a current density of 0.1 C, and an operating temperature of 70°C.
To evaluate the mechanisms that induce capacity fading across each of the all-solid-state LSBs during cycling, EIS tests were conducted at 70°C. The all-solid-state LSB with a sulfur-carbon weight ratio of 3:3 (cathode) was selected as the test sample as it exhibited the most severe capacity fading. Fig. 6 shows variations in the sample resistance before and after cycling (between 1 and 50 cycles). The Nyquist plots are composed of a semicircle in the medium- and high-frequency regions and an inclined line in the low-frequency region. Three resistance components consist of the composite solid electrolyte (CSE) bulk (RCSE), the interface between Li anode and CSE (RLi/CSE), and the interface between sulfur composite cathode and CSE (RS/CSE), respectively [25]. The resistance values was calculated from before cycle and the resistance values for RCSE, RLi/CSE, and RS/CSE were 10, 11 and 15 Ω, respectively. These low resistance values show the advantage of the CSE. After 1 cycle, the resistance values for RCSE, RLi/CSE, and RS/CSE increased 16, 19 and 23 Ω, slightly. But, the resistance values for RCSE, RLi/CSE, and RS/CSE increased 31, 78 and 189 Ω after 50 cycle, significantly. Through increased resistance values obtained before and after cycling, we deduced that several factors, including structural changes within the all solid state LSB during cycling, could induce an increase in the resistance values.
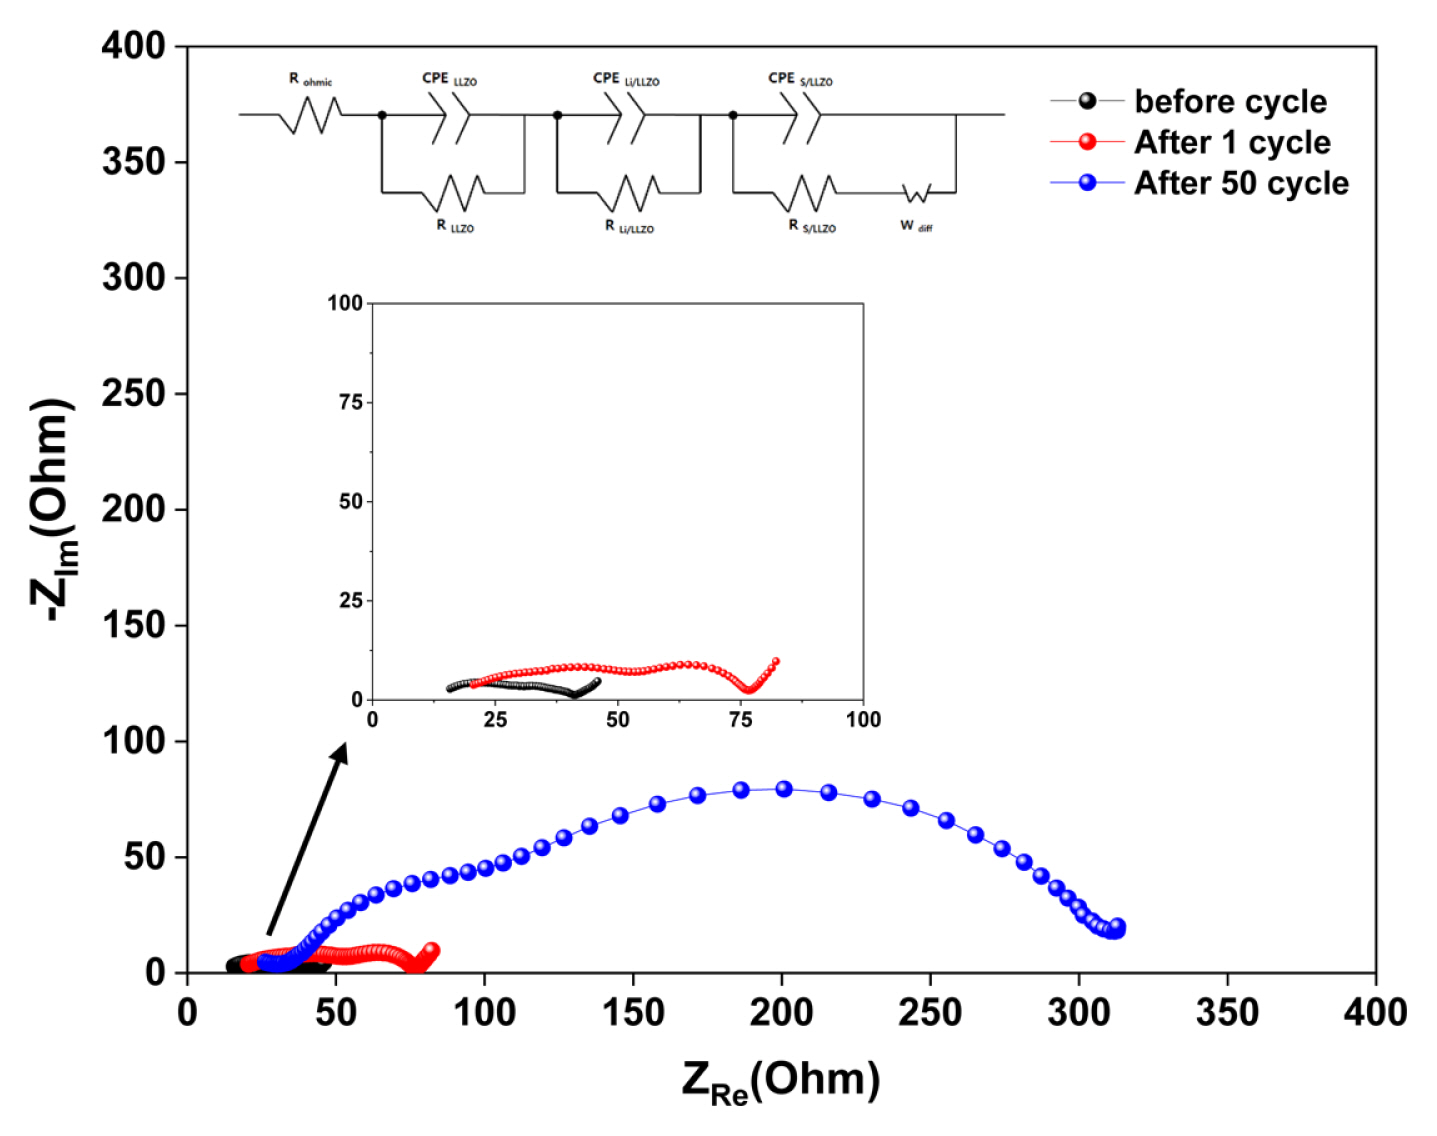
Electrochemical impedance spectra obtained before and after cycling (between 1 and 50 cycles, S:C=3:3, operating temperature = 70°C).
To determine the reasons behind the increased internal resistance, morphological variations within the all-solid-state LSBs were observed using FIB-SEM. Fig. 7 shows cross-sectional SEM images obtained from the composite cathodes before cycling at (a) low and (b) high magnifications, and after 50 cycles at (c) low and (d) high magnifications. In comparison with the sample before cycling (Fig. 7 (a) and (b)), the sample subjected to 50 cycles exhibited significant pore formation within the internal composite cathode and delamination between the current collector and the cathode material (Fig. 7 (c) and (d)). The morphological changes induced in the composite cathode during the electrochemical reaction are a result of a significant volumetric expansion (~80%) that occurs during lithiation (S8 to Li2S) [26,27]. The significant volumetric expansion imparts substantial internal stresses, while reducing the contact between the materials within the cathode as well as the cathode and current collectors [28]. Therefore, we suggest that the morphological changes induced in the composite cathode through the volumetric expansion of sulfur lead to severe capacity fading and poor cycling performance.
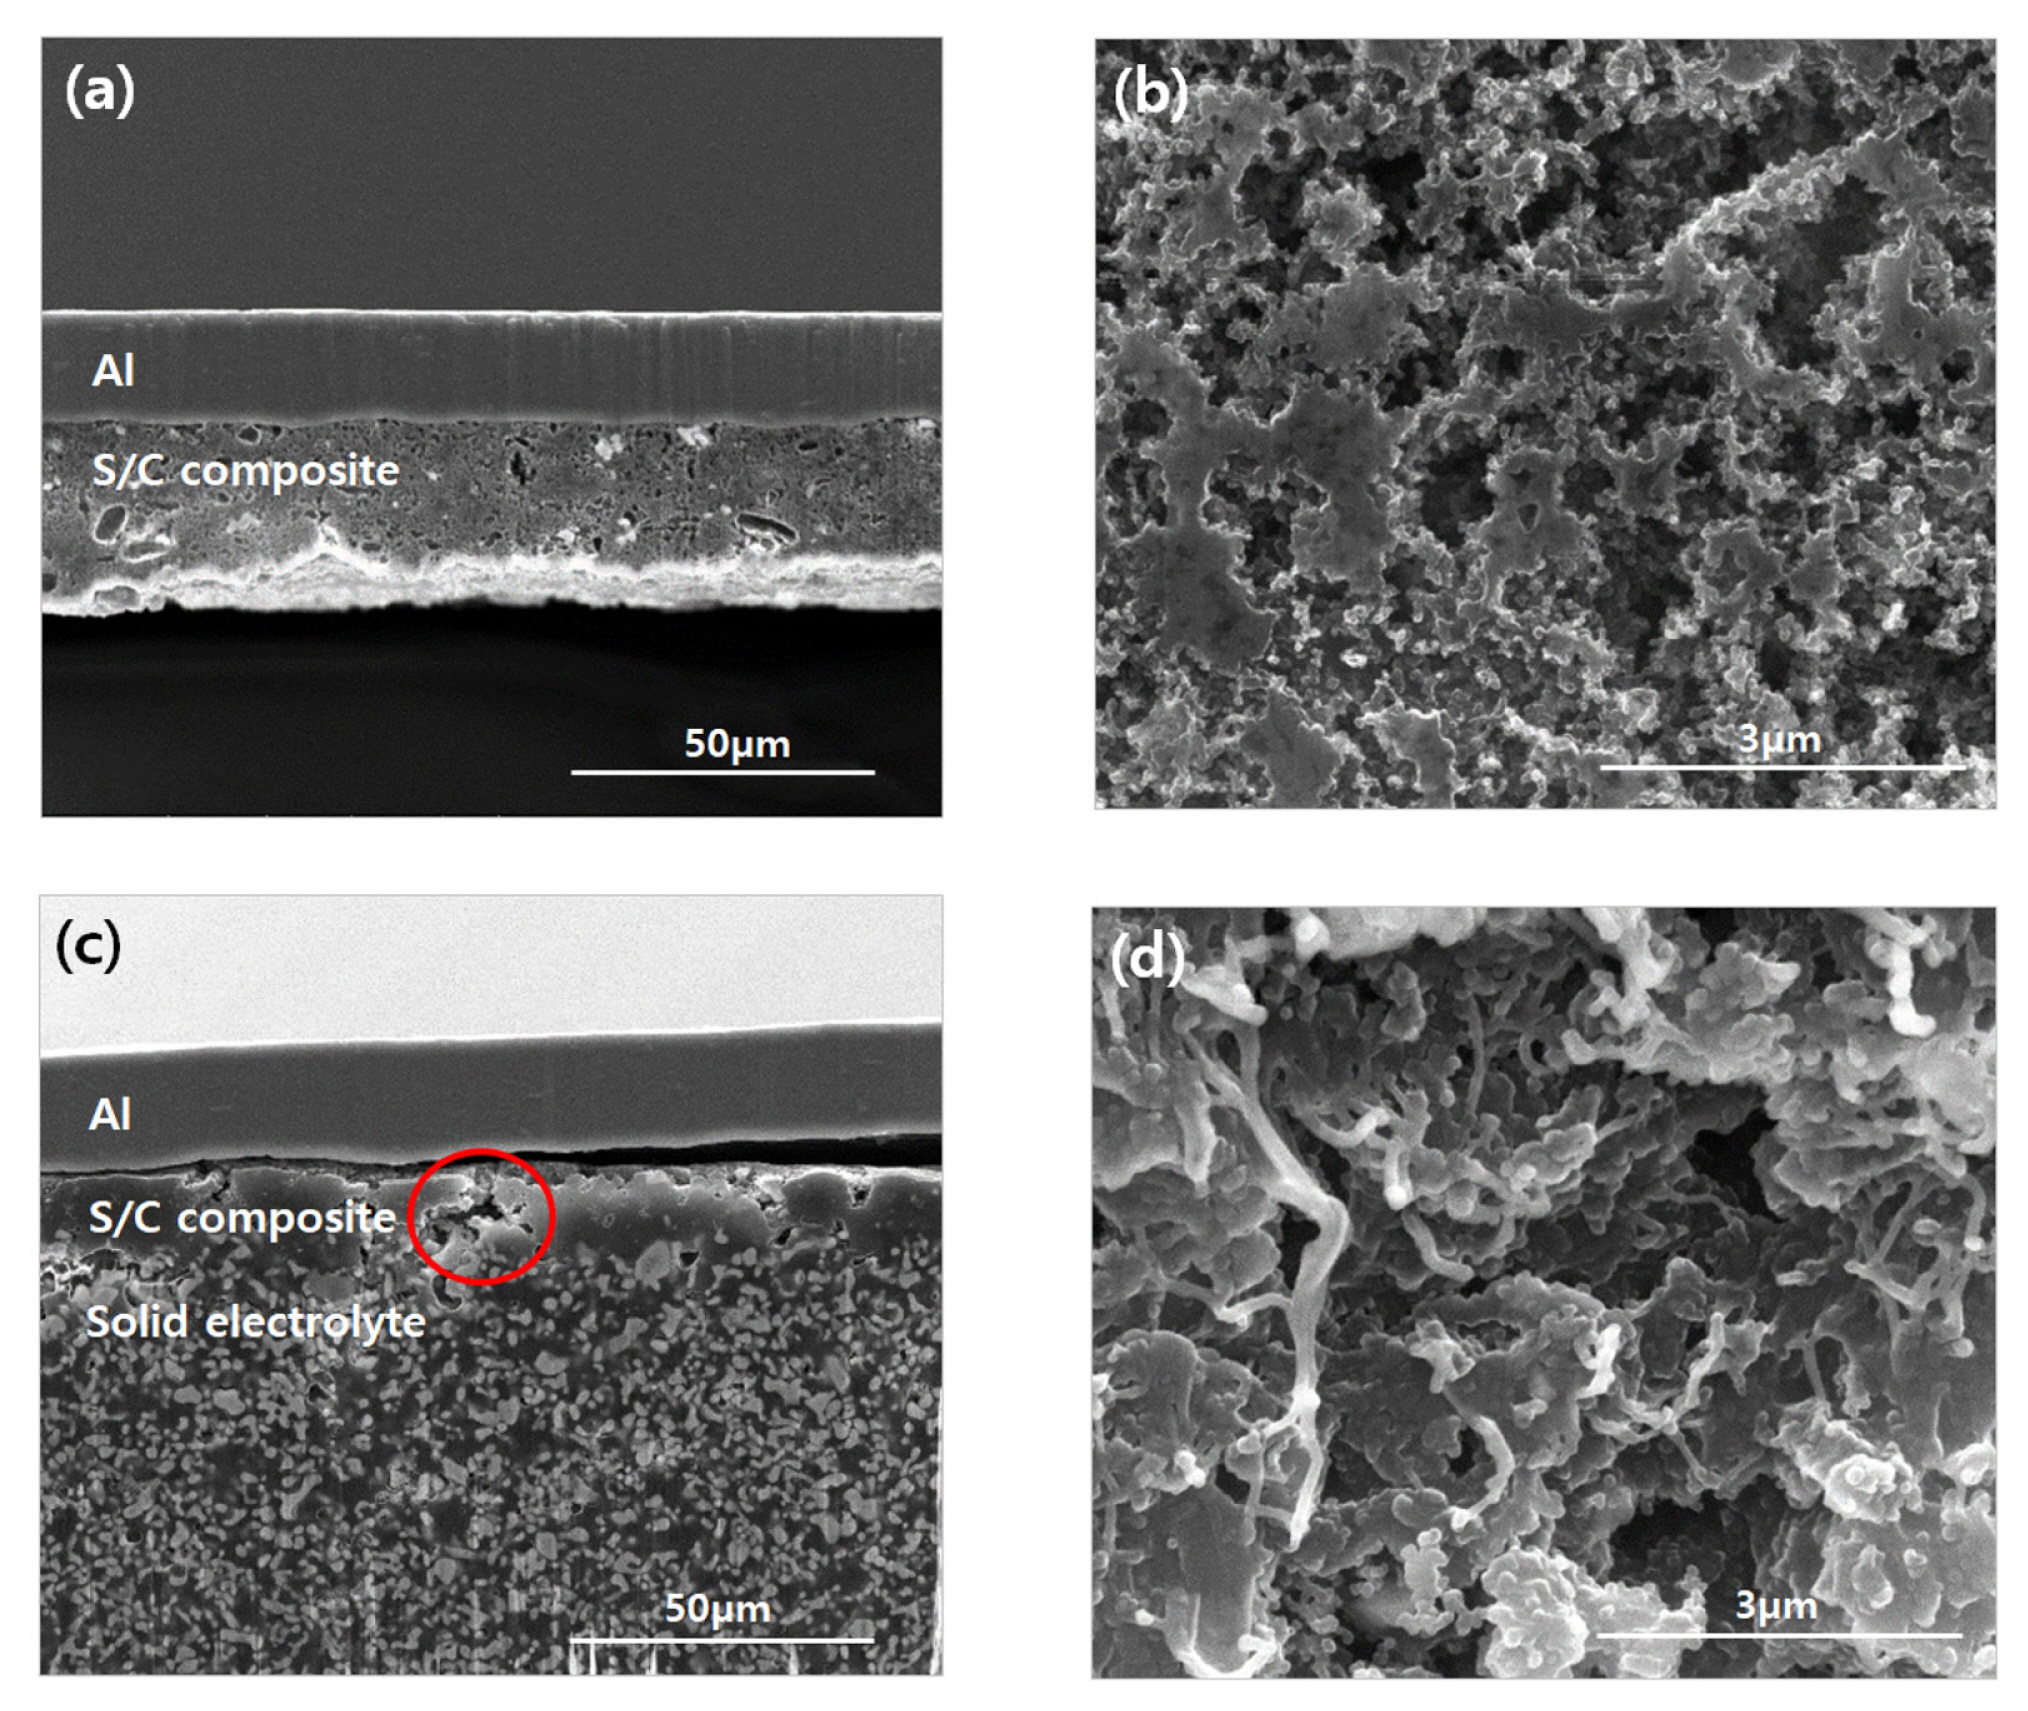
Cross-sectional SEM images obtained from the S:C=3:3 composite cathode before cycling at (a) low and (b) high magnification and after 50 cycles at (c) low and (d) high magnification.
Fig. 8 shows the comparative electrochemical performance exhibited by the S:C=3:3 composite cathode at loading weights between 1.5 and 4.0 mg cm−2. Fig. 8 (a) presents initial capacities of 1386 and 488 mAh g−1 at loading weights of 1.5 and 4.0 mg cm−2, respectively. At a loading weight of 4.0 mg cm−2, the all-solid-state LSB exhibited an initial capacity approximately three times lower than that recorded at a loading weight of 1.5 mg cm−2. At a loading weight of 4.0 mg cm−2, the battery exhibited poorer C-rate performance in comparison to the battery possessing a loading weight of 1.5 mg cm−2, as shown in Fig. 8 (b). Fig. 8 (c) shows the cycling performance exhibited by the all-solid-state LSB at loading weights of 1.5 and 4.0 mg cm−2. At a loading weight of 1.5 mg cm−2, a sharp decrease in cycling performance was observed. However, this reduction cannot be attributed to the linear cycling performance induced at a loading weight of 4.0 mg cm−2. At a loading weight of 4.0 mg cm−2, the low initial capacity, low C-rate, and cycling performance can be attributed to the increased current density, which is caused by an increased sulfur loading. Hence, it is concluded that a higher current density expedites the performance degradation exhibited by LSBs [29].

Comparison of the electrochemical performance of the S:C=3:3 composite cathode for loading weights between 1.5 and 4.0 mg cm−2: (a) initial capacity-voltage profiles, (b) rate performance, and (c) cycling performance.
4. Conclusions
Powder samples, blended via a facile physical method, with sulfur-carbon weight ratios of 3:3, 4:2, and 5:1, were evaluated using XRD analysis. It was found that no structural change occurred across the samples. Subsequently, a solid electrolyte and polymer binder were added to the sulfur-carbon composite cathode, which was then evaluated using FE-SEM and EDS mapping to determine the elemental dispersion throughout the composite cathode. The all-solid-state LSBs were prepared in a coin-type (CR2032) cell configuration to evaluate the electrochemical performance in accordance with the sulfur-carbon weight ratio. The cell containing a sulfur-carbon ratio of 3:3 exhibited the highest initial capacity at 1386 mAh g−1. It should be noted that each of the cells exhibited limited rate performance and poor cycling performance owing to the intrinsic characteristics exhibited by solid electrolytes as well as the insulating properties exhibited by sulfur. It was determined through EIS and FIB-SEM analyses that the sharp decrease in the capacity (during cycling) resulted from an increased impedance and collapsed internal structure of the composite cathode. Cells with higher loading weights exhibited significant electrochemical performance degradation in comparison with the cells with lower loading weights. The results of this study suggest that such a performance degradation is caused by the volumetric expansion within the cathode and the poor electrochemical performance exhibited at high current densities and loading weights. Solutions to the above-described issues should be investigated in future studies.
Acknowledgement
This study was conducted with the support of the Korea Institute of Industrial Technology, as “Development of technology for commercialization of anodes for lithium metal batteries by bonding Li/Cu heterogeneous material (KITECH EM-21-0007)”.