1. Introduction
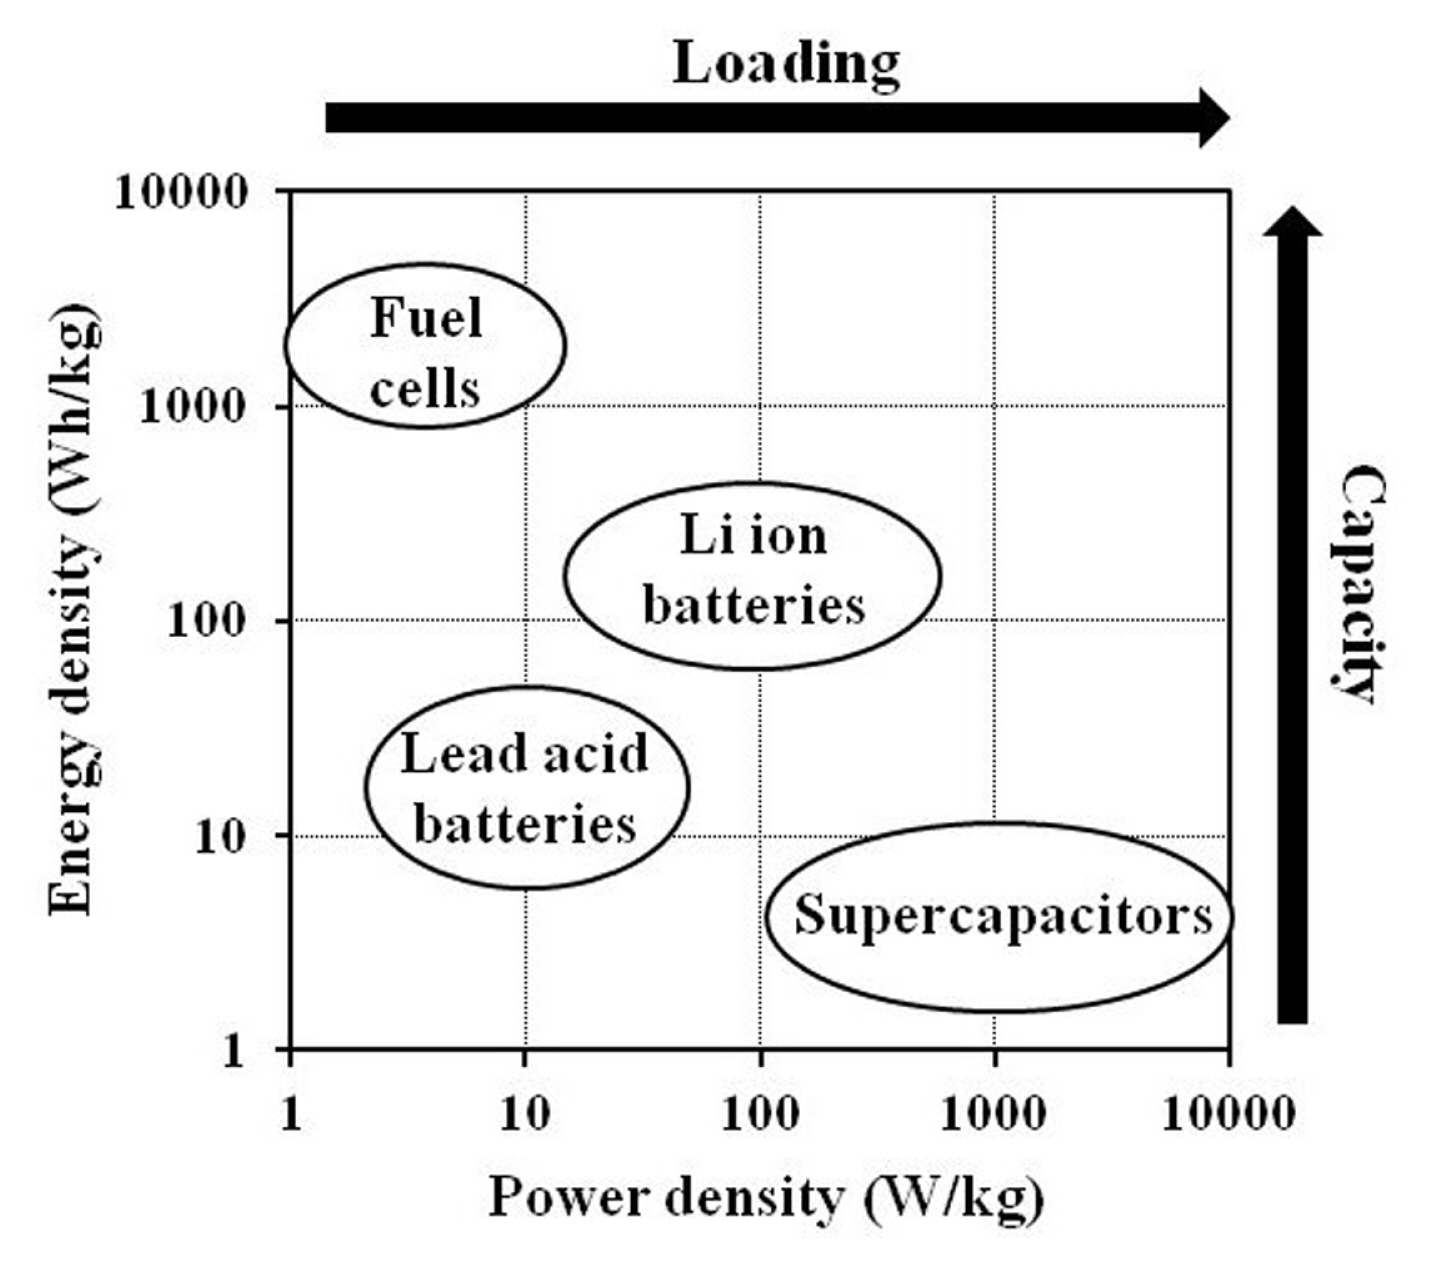
Electricity generated from renewable energy sources such as wind or solar provides a tremendous prospect for fulfilling the energy demands of the future. Despite that, the generation of electricity from these patchy clean sources requires competent electrical energy storage (EES) devices to achieve stable and efficient energy conversion-storage-usage chains. Furthermore, there is an urgent need for better rechargeable EES devices for use in electric vehicles (EVs). The Ragone plot displayed in Fig. 1 illustrates the approximate energy and power densities of several EES devices. Due to the advantages of high capacity and large electrical loading capability, Li ion batteries (LIBs) are considered the most important EES devices in this era and are anticipated to meet the abovementioned demands.
Batteries are electrochemical devices that convert energy in the form of chemical bonds into electricity. Generally, a battery will consist of a cathode and anode that constitute the positive and negative poles of the cell respectively, and an electrolyte that acts as the medium in which ions can pass through and carry current internally. Li ions are removed from the cathode and inserted into the anode when charging for the LIB and the opposite reaction occurs while the discharge is being carried out. Due to the larger Li ion storage capacity of anode materials compared to cathodes, the cathode material is the limiting element in LIB performance.
Layered lithium transition metal oxides, which consist of compounds with the formula LiMO2 (M: Co, Ni, and Mn) that crystallise into a layered structure, may be the most commercially viable class of cathode [1]. LiCoO2 (LCO) was the first layered transition metal oxide to be effectively integrated as a cathode into a commercial rechargeable LIB by SONY in 1991 [2]. Despite being considered a fully developed material at this point, the application of LCO is only limited to portable devices due to its low thermal stability. Another successful layered cathode material is a combination of Ni, Mn, and Co. These transition metals can all be accommodated in the layered metal oxide structure to form LiNi1–x–yMnx-CoyO2 (NMC) [3]. The traits associated with these compounds are higher capacity (Ni), better rate capability (Co), and improved safety (Mn) [4]. Due to these advantages, this particular combination of metals in the cathode material is a choice for the batteries of many global manufacturers, such as Nissan, Tesla, and BMW, to use in their EVs. Mixed lithium transition metal oxides with spinel crystal arrangement have been regarded as potential cathode materials in LIBs [5]. Through partial substitution of Mn for Ni in LiMn2O4, LiNi0.5Mn1.5O4 (LNMO) spinels with operating voltages of around 4.8 V with a capacity of up to 140 m A h g−1 are formed [6]. LNMO attracts attention, thanks to its low cost and environmentally friendly components, as well as excellent rate capability with good safety characteristics.
It is widely known that the variables that determine the rate capability of Li intercalation-deintercalation in cathode materials depend mostly on the bulk properties, such as Li diffusion, electronic conductivity, and the kinetics at the interface [7,8]. As the Li diffusion in cathode materials is a critical step in energy storage and output, it is important to investigate the Li diffusion coefficient (DLi) at different Li concentrations and cell voltage. The galvanostatic intermittent titration technique (GITT), developed by Weppner and Huggins, is a well adopted method for determining the DLi that combines transient perturbation and steady-state measurements [9,10]. GITT enables the differentiation of electroactive species fluxes based on individual kinetic and thermodynamic characteristics of ionic and electronic species, as well as the determination of the variables that influence chemical diffusion under various conditions.
In this work, we focused on the Li diffusion kinetics of the LNMO cathode materials synthesized by the sol gel method. The thermal, structural, and electrochemical aspects of the LNMO were also characterized. DLi of LNMO material at different Li concentration determined by the GITT method were fully discussed.
2. Methodology
The LNMO was synthesized via the sol gel method employing manganese acetate tetrahydrate (C4H6MnO4 ·4H2O, Sigma-Aldrich, 99% purity), nickel nitrate hexahydrate (Ni(NO3)2·6H2O, Sigma-Aldrich, 99.9% purity) and lithium hydroxide monohydrate (LiOH·H2O, Sigma-Aldrich, 98% purity) as raw materials. Tartaric acid (C4H6O6, Friendemann Schmidt) was used as a chelating agent to assure a good end product [11]. All starting materials were dissolved in deionized water in stoichiometric quantities and stirred at 80°C. The pH of the mixed solutions was kept at 9.8 by controlling the amount of ammonia added to the solution. The solution was continuously stirred until it formed a viscous brown gel. This gel was calcined at 400°C for 5 hours. After the calcination, the black substance was crushed into fine powder and transferred back into the furnace for a second calcination at 750°C for 6 hours. Thermogravimetric and differential thermal analyses (TG-DTA) were performed from room temperature to 900°C (10°C min−1) in air flow using the Perkin Elmer STA 6000 simultaneous thermal analyzer. The crystal structure was analyzed by the Malvern Panalytical Empyrean diffractometer in a 2θ range of 10° to 80°. The external morphology and energy-dispersive X-ray (EDX) spectroscopy were characterized by the JEOL JSM-7600F field emission scanning electron microscope (FESEM). The internal structure was examined by the Olympus BTX-324 high resolution transmission electron microscopy (HRTEM).
The electrochemical and kinetic characterizations were carried out using the Neware BTS-3000 battery tester and the CH Instruments 660C electrochemical analyzer in the voltage range of 3.0–4.9 V. The cathodes were comprised of 80 wt% LNMO synthesized by the sol gel method, 10 wt% poly(vinylidene fluoride) (PVDF) binder, 10 wt% acetylene black, and an aluminium foil current collector. Slurry containing the active material and other components was prepared using N-methyl-2-pyrrolidone (NMP). The slurry was sonicated for 40 min and stirred for another 24 h before being uniformly spread onto the current collectors. The cathode was dried in a vacuum oven at 100°C for 12 h before cutting it into smaller circular disks (diameter = 1.6 cm and thickness = 25 μm). The loading weight of the active material on the electrode was about 1.5 mg cm−1. The cathodes were rolled by a calender machine to improve electrical contact and adhesiveness. The cells were assembled in a glove box filled with highly pure argon where the oxygen and water contamination levels were kept below 1 ppm. The glass fiber separator was soaked with a solution of 1 M LiPF6 in an equal volume mixture of ethylene carbonate (EC) and dimethyl carbonate (DMC) that was used as the electrolyte for the cells.
For the application of the GITT method, transient perturbation in the form of a small current (34 μA) was applied through the LNMO half cell for 10 minutes to extract a tiny fraction of Li ions from the LNMO electrode. The cell was then left to rest for 40 minutes to allow the remaining intercalated Li ions to diffuse to a new equilibrium. This cycle was performed multiple times, and the voltage of the LNMO half cell was measured during the experiment. When the current was switched on and off, an IR drop appeared and disappeared.
3. Results and Discussion
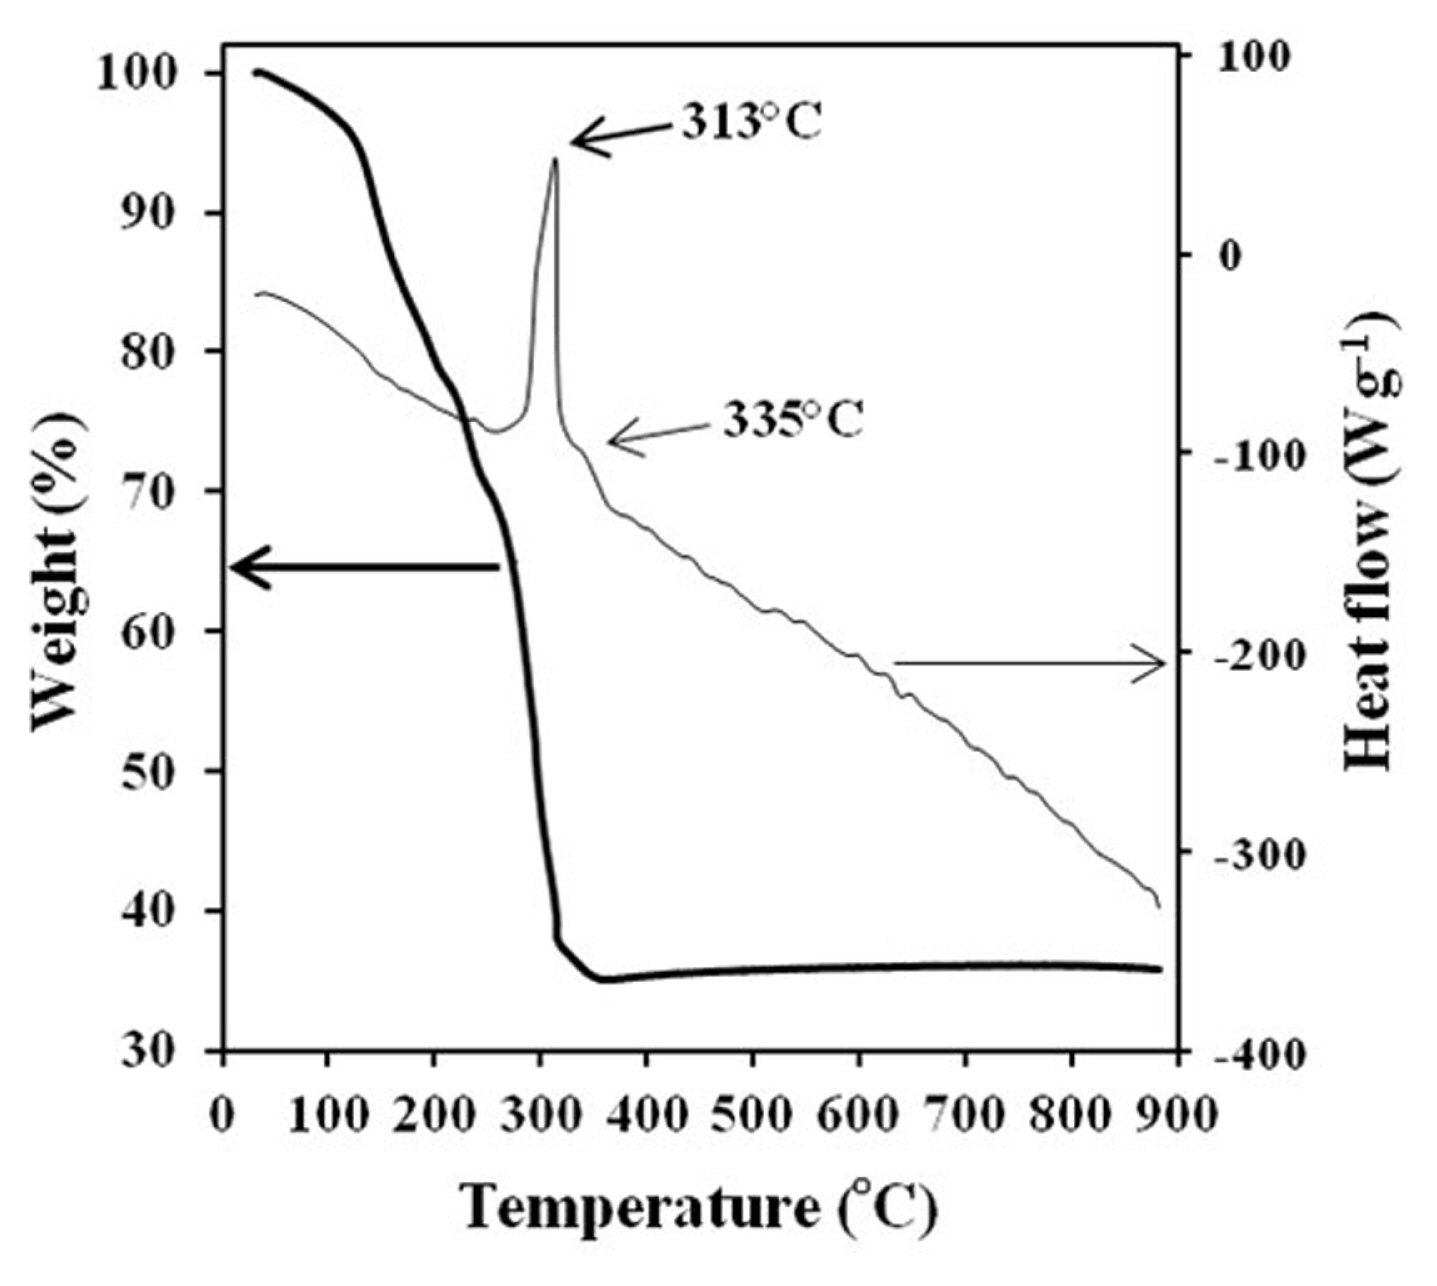
The conversion process from precursor to spinel LNMO was studied using TG-DTA analysis. Fig. 2 shows the TG-DTA curves of the precursor for a temperature range up to 900°C. Weight loss at temperatures below 150°C was associated with the release of residual water. The subsequent substantial loss of weight is due to the conversion of the precursor to spinel LNMO with two exothermic peaks at 313°C and 335°C. The TG-DTA findings show that the synthesis process happened predominantly at a temperature of around 300–350°C. There are no apparent peaks on the DTA curve from 350 to 900°C. A single phase crystalline spinel is produced in this temperature range. Therefore, based on these TG-DTA results, the temperature of calcination was determined at 400°C for 5 hours to generate metallic oxides, and the second calcination was performed at 750°C for 6 hours in order to obtain a good crystallinity material.
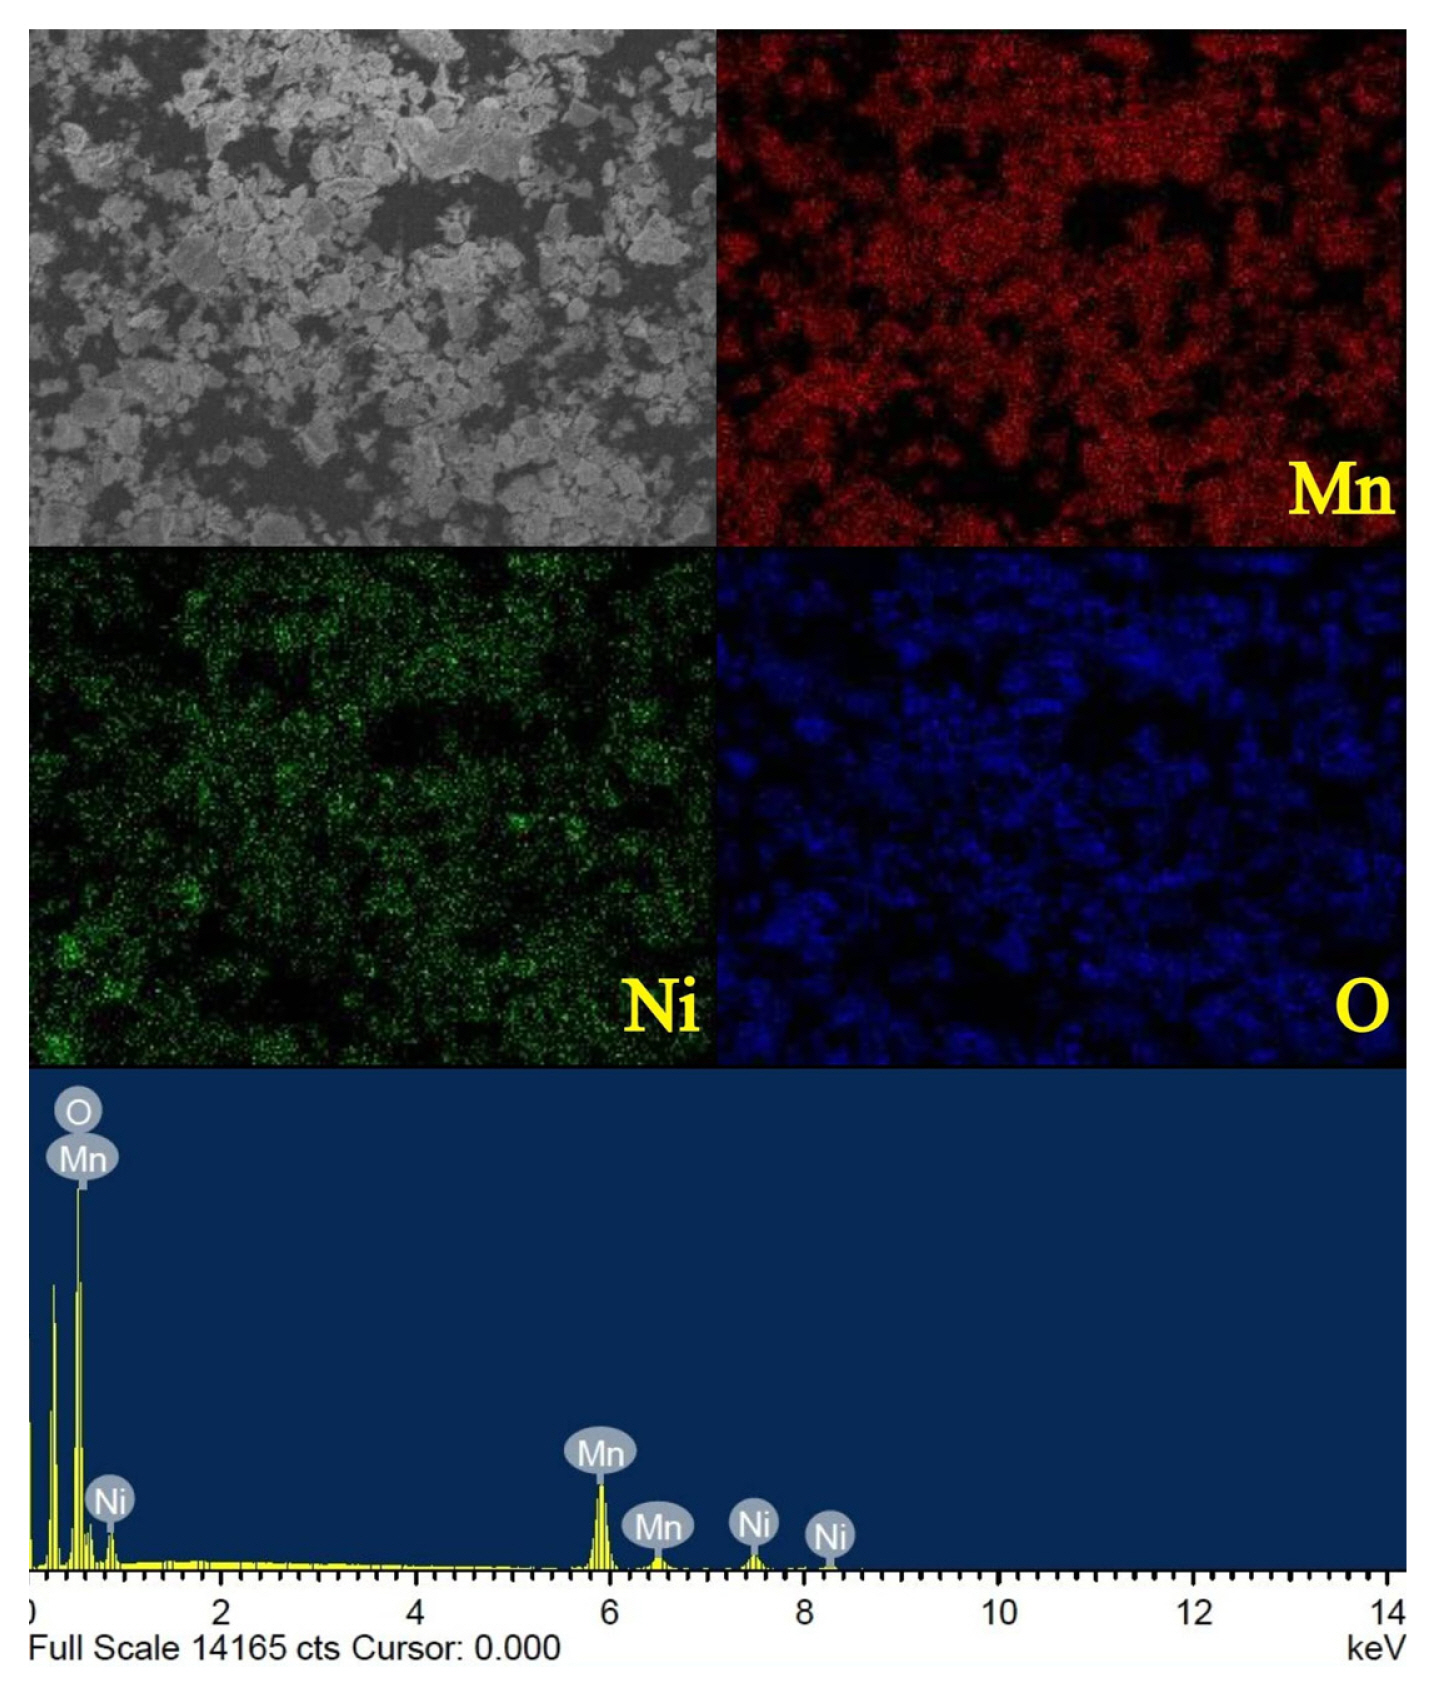
Fig. 3 shows the EDX spectrum and elemental mapping of LNMO powder. Analysis reveals that there are no impurities present in the synthesized LNMO and it is shown that elements Mn, Ni, and O are distributed homogenously. The Ni to Mn ratio of LNMO powders is estimated at around 1.02:3, which corresponds well to the theoretical value (1:3).
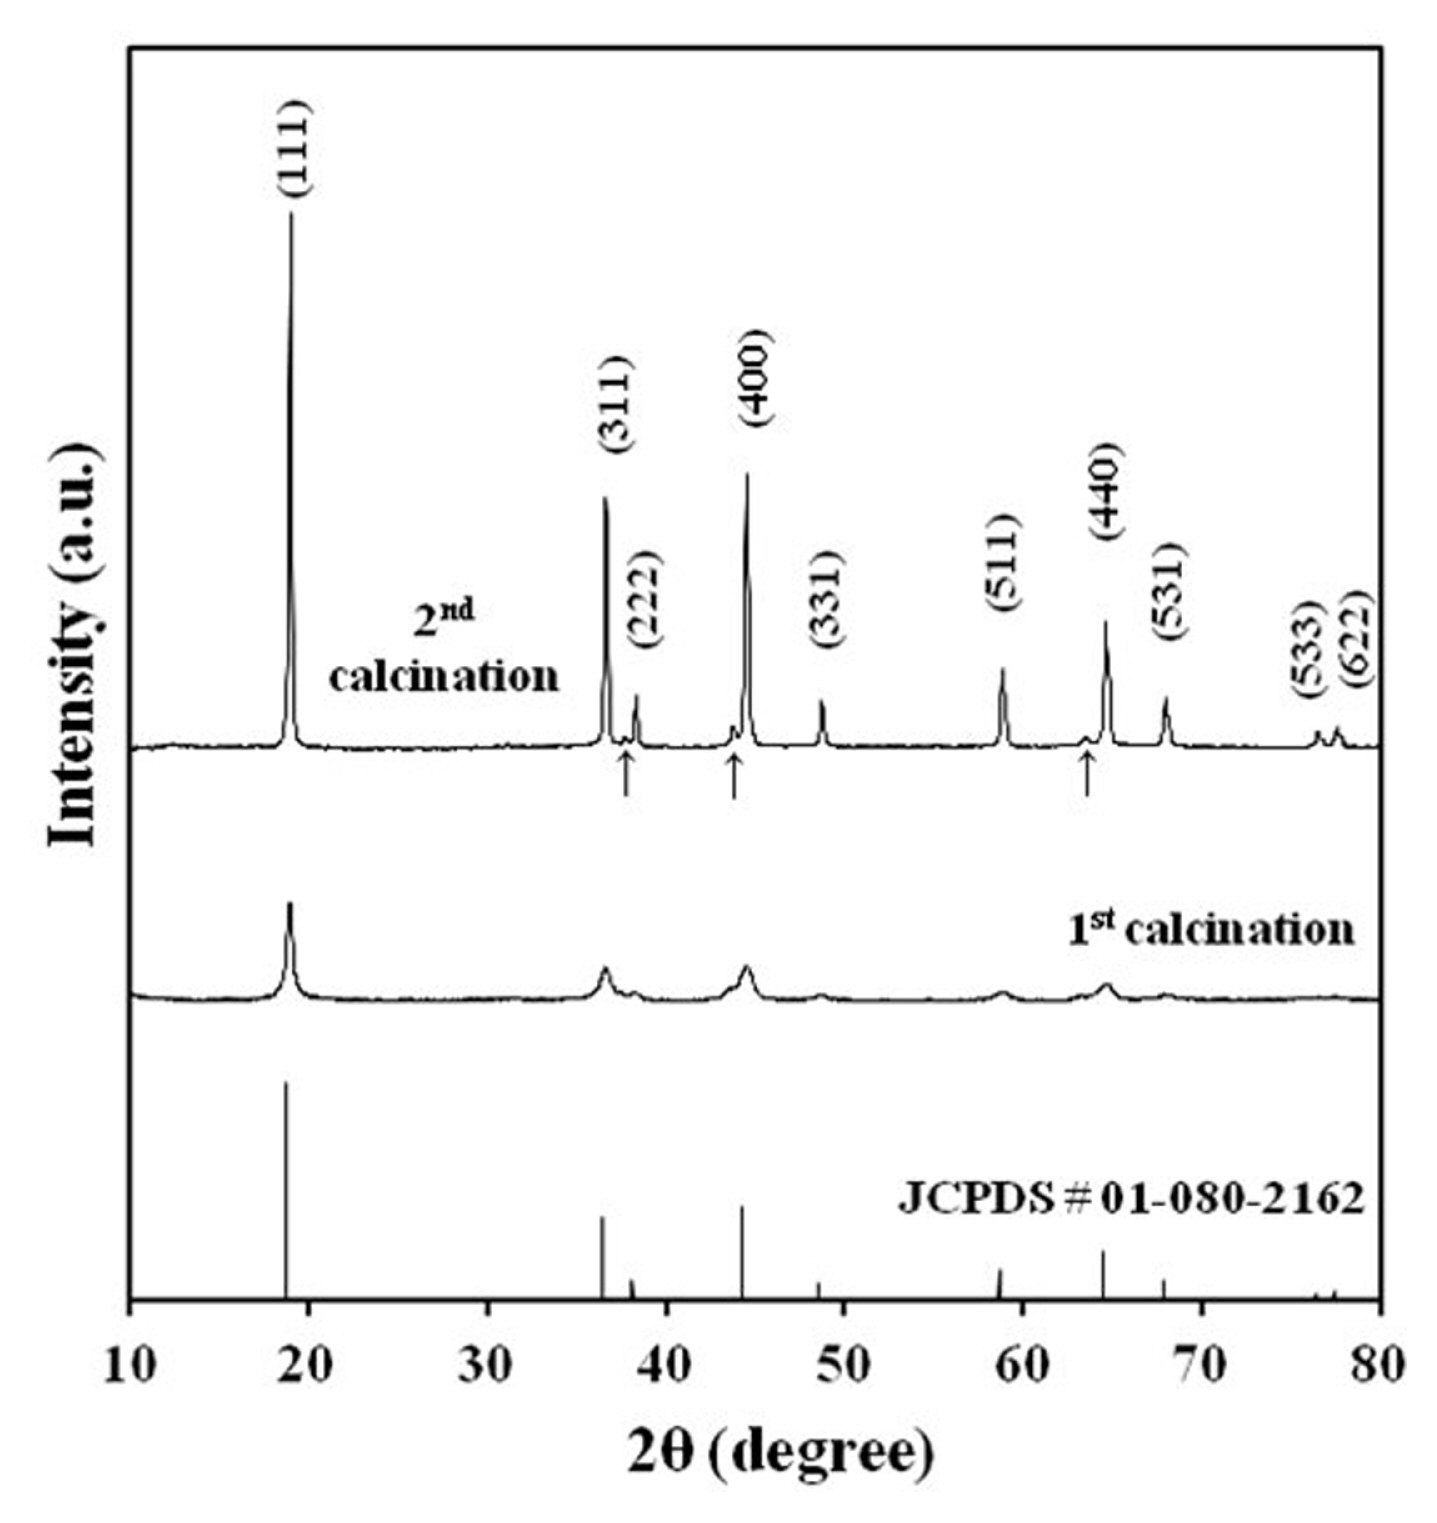
The X-ray diffractogram of the LNMO powder after first and second calcination is displayed in Fig. 4. LNMO spinels have two phases with the space groups Fd3̄m and P4332 [12]. These phases have the same cubic frame, but the distribution of metal ions is different. Li, Mn, and Ni ions occupy 8c, 12d, and 4a sites respectively in P4332 LNMO. In contrast, Li ions occupy 8a sites while Mn and Ni ions are distributed randomly at 16d sites in Fd3̄m LNMO. The synthesized LNMO can be indexed to the Fd3̄m cubic space group (JSPD # 01-080-2162). All the observed Bragg peaks for LNMO powder matched the reference peak position with (111) being the most intense. Three weak peaks at 37°, 44°, and 64°(marked with arrow) are observed in LNMO powder and could be ascribed to a small trace of the LixNi1-xO phase produced by oxygen loss during second calcination [13]. The generalized reaction for the formation of the Lix-Ni1-xO phase is shown below.
where α, β, and γ represent the relative amounts of LixNi1–xO, LiMn1.5+yNi0.5-yO4 and O2 respectively. This oxygen deficiency also reduces the Mn charge state from +4 to +3 [14]. The reflection of Mn3+ can be seen in the charge and discharge curves.
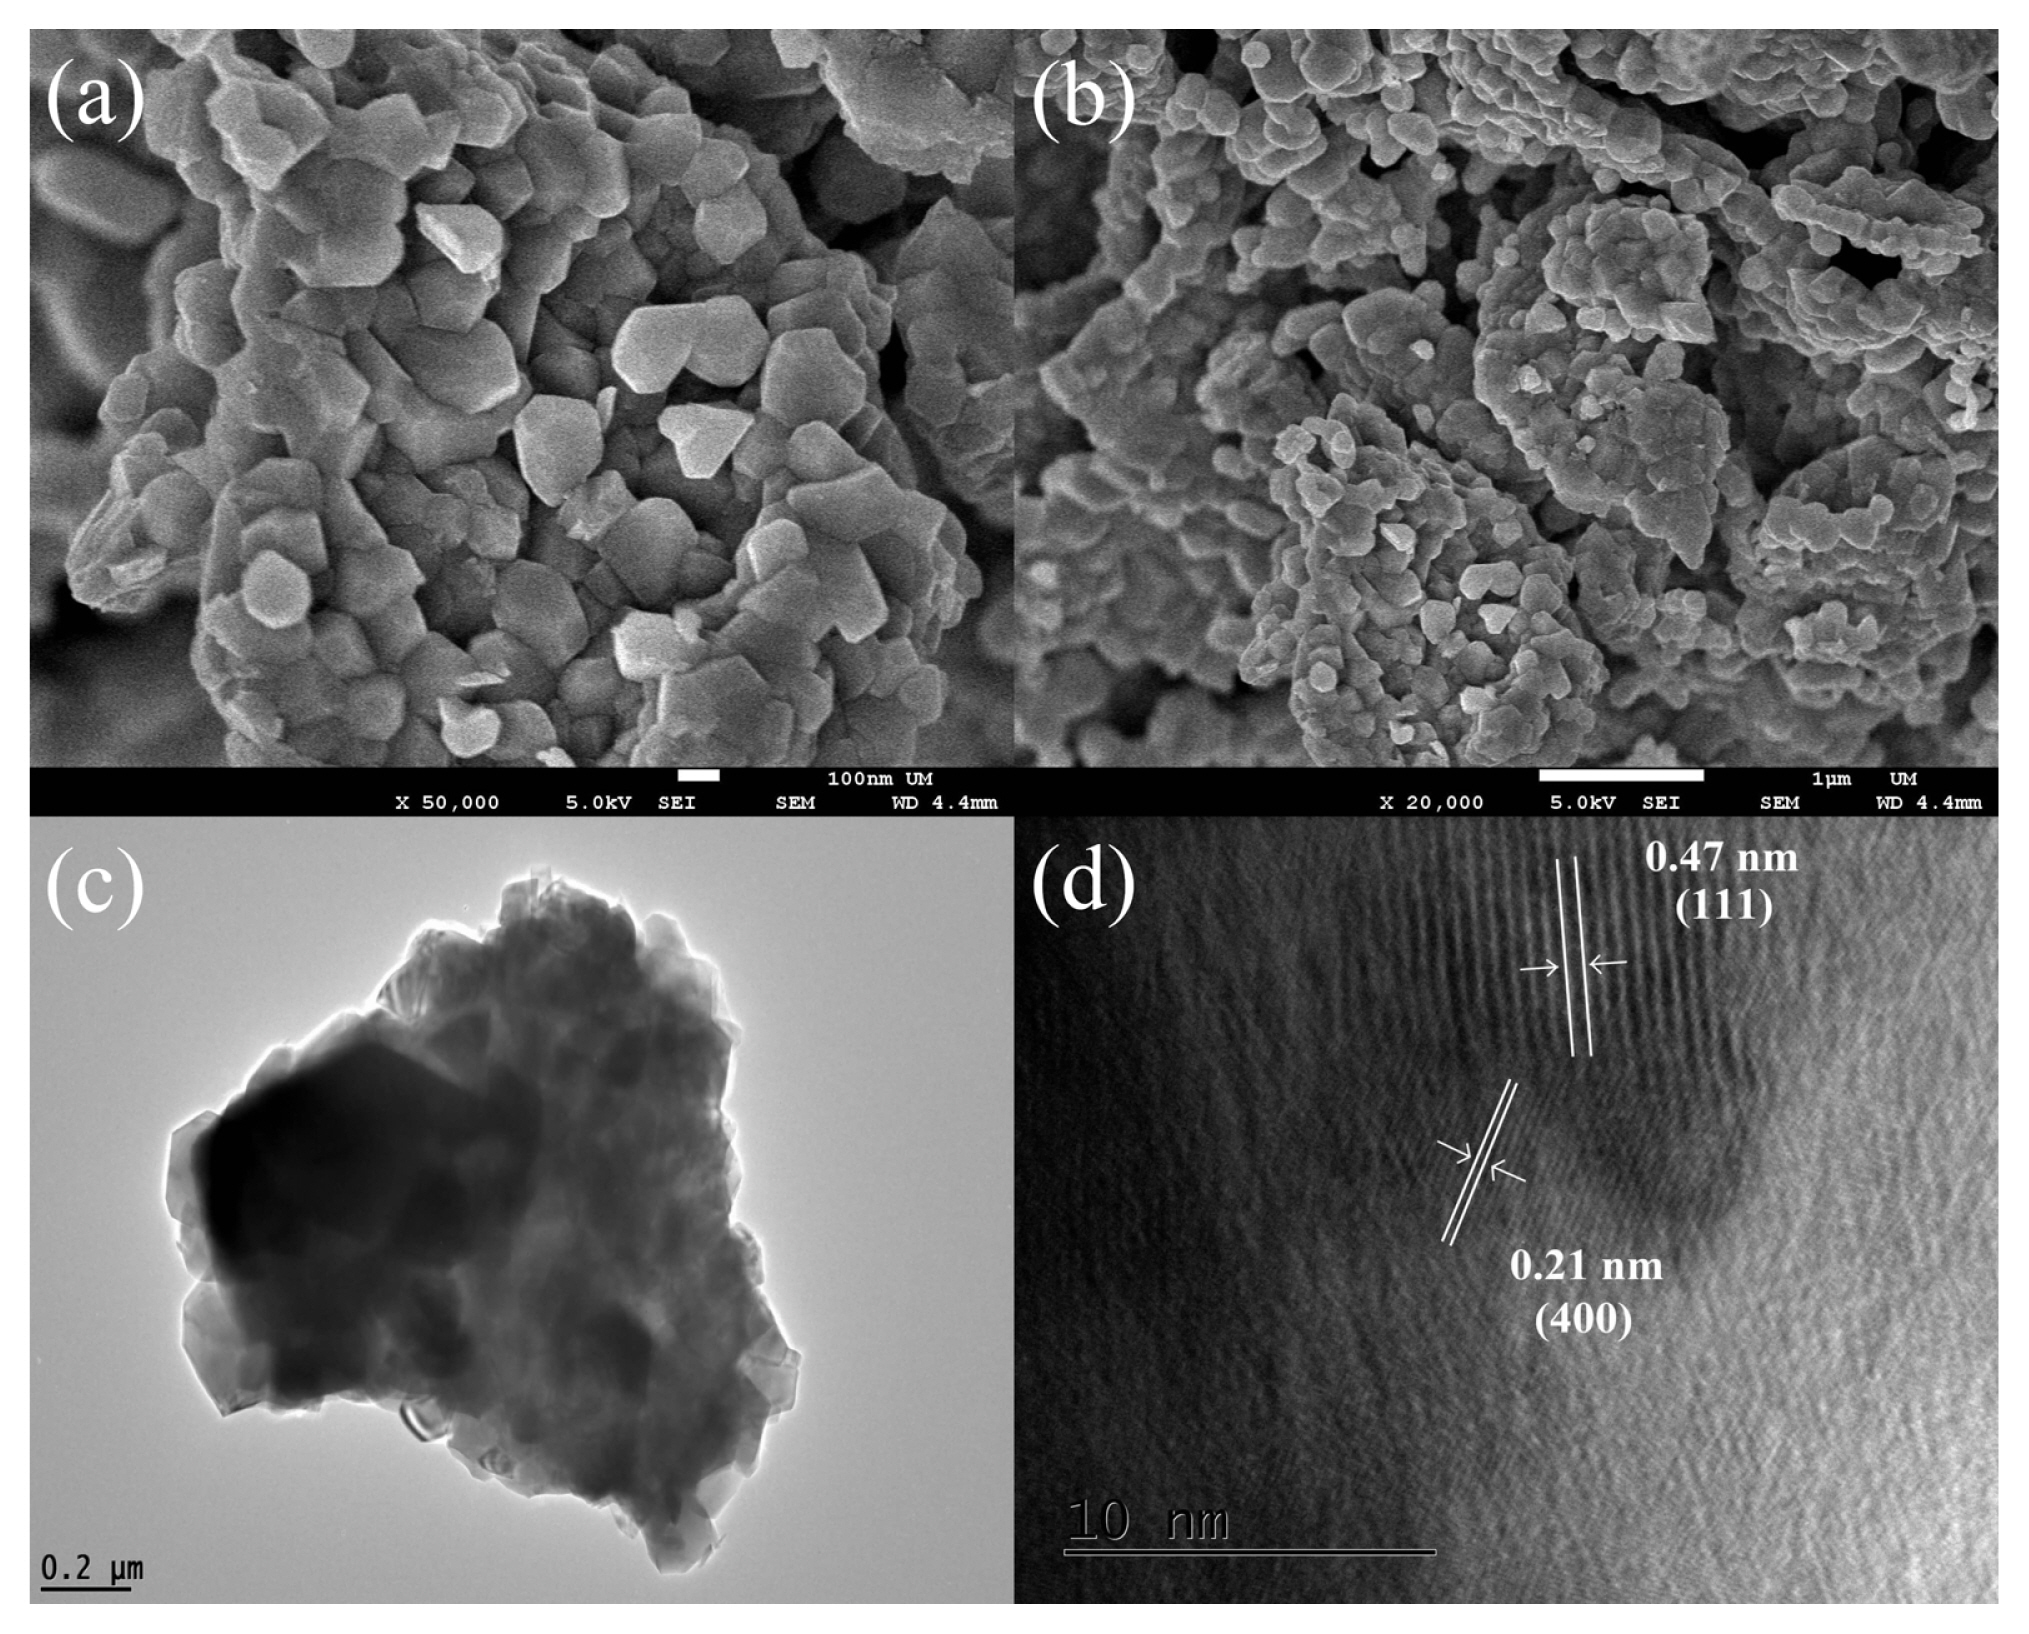
The external morphology and internal structure of LNMO powder were observed by FESEM, TEM and HRTEM. In Fig. 5a, it can be observed that the LNMO powder consists of submicron polyhedral particles. At low magnification (Fig. 5b), the material appears to be made up of huge micrometric clumps. This is consistent with the TEM result. As illustrated in Fig. 5c, aggregated particles were identified instead of individual particles. The HRTEM image in Fig. 5d displays that the particles have been crystallized with lattice spacings of 4.7 Å and 2.1 Å, which correspond to the (111) and (400) planes of LNMO, respectively [15,16].
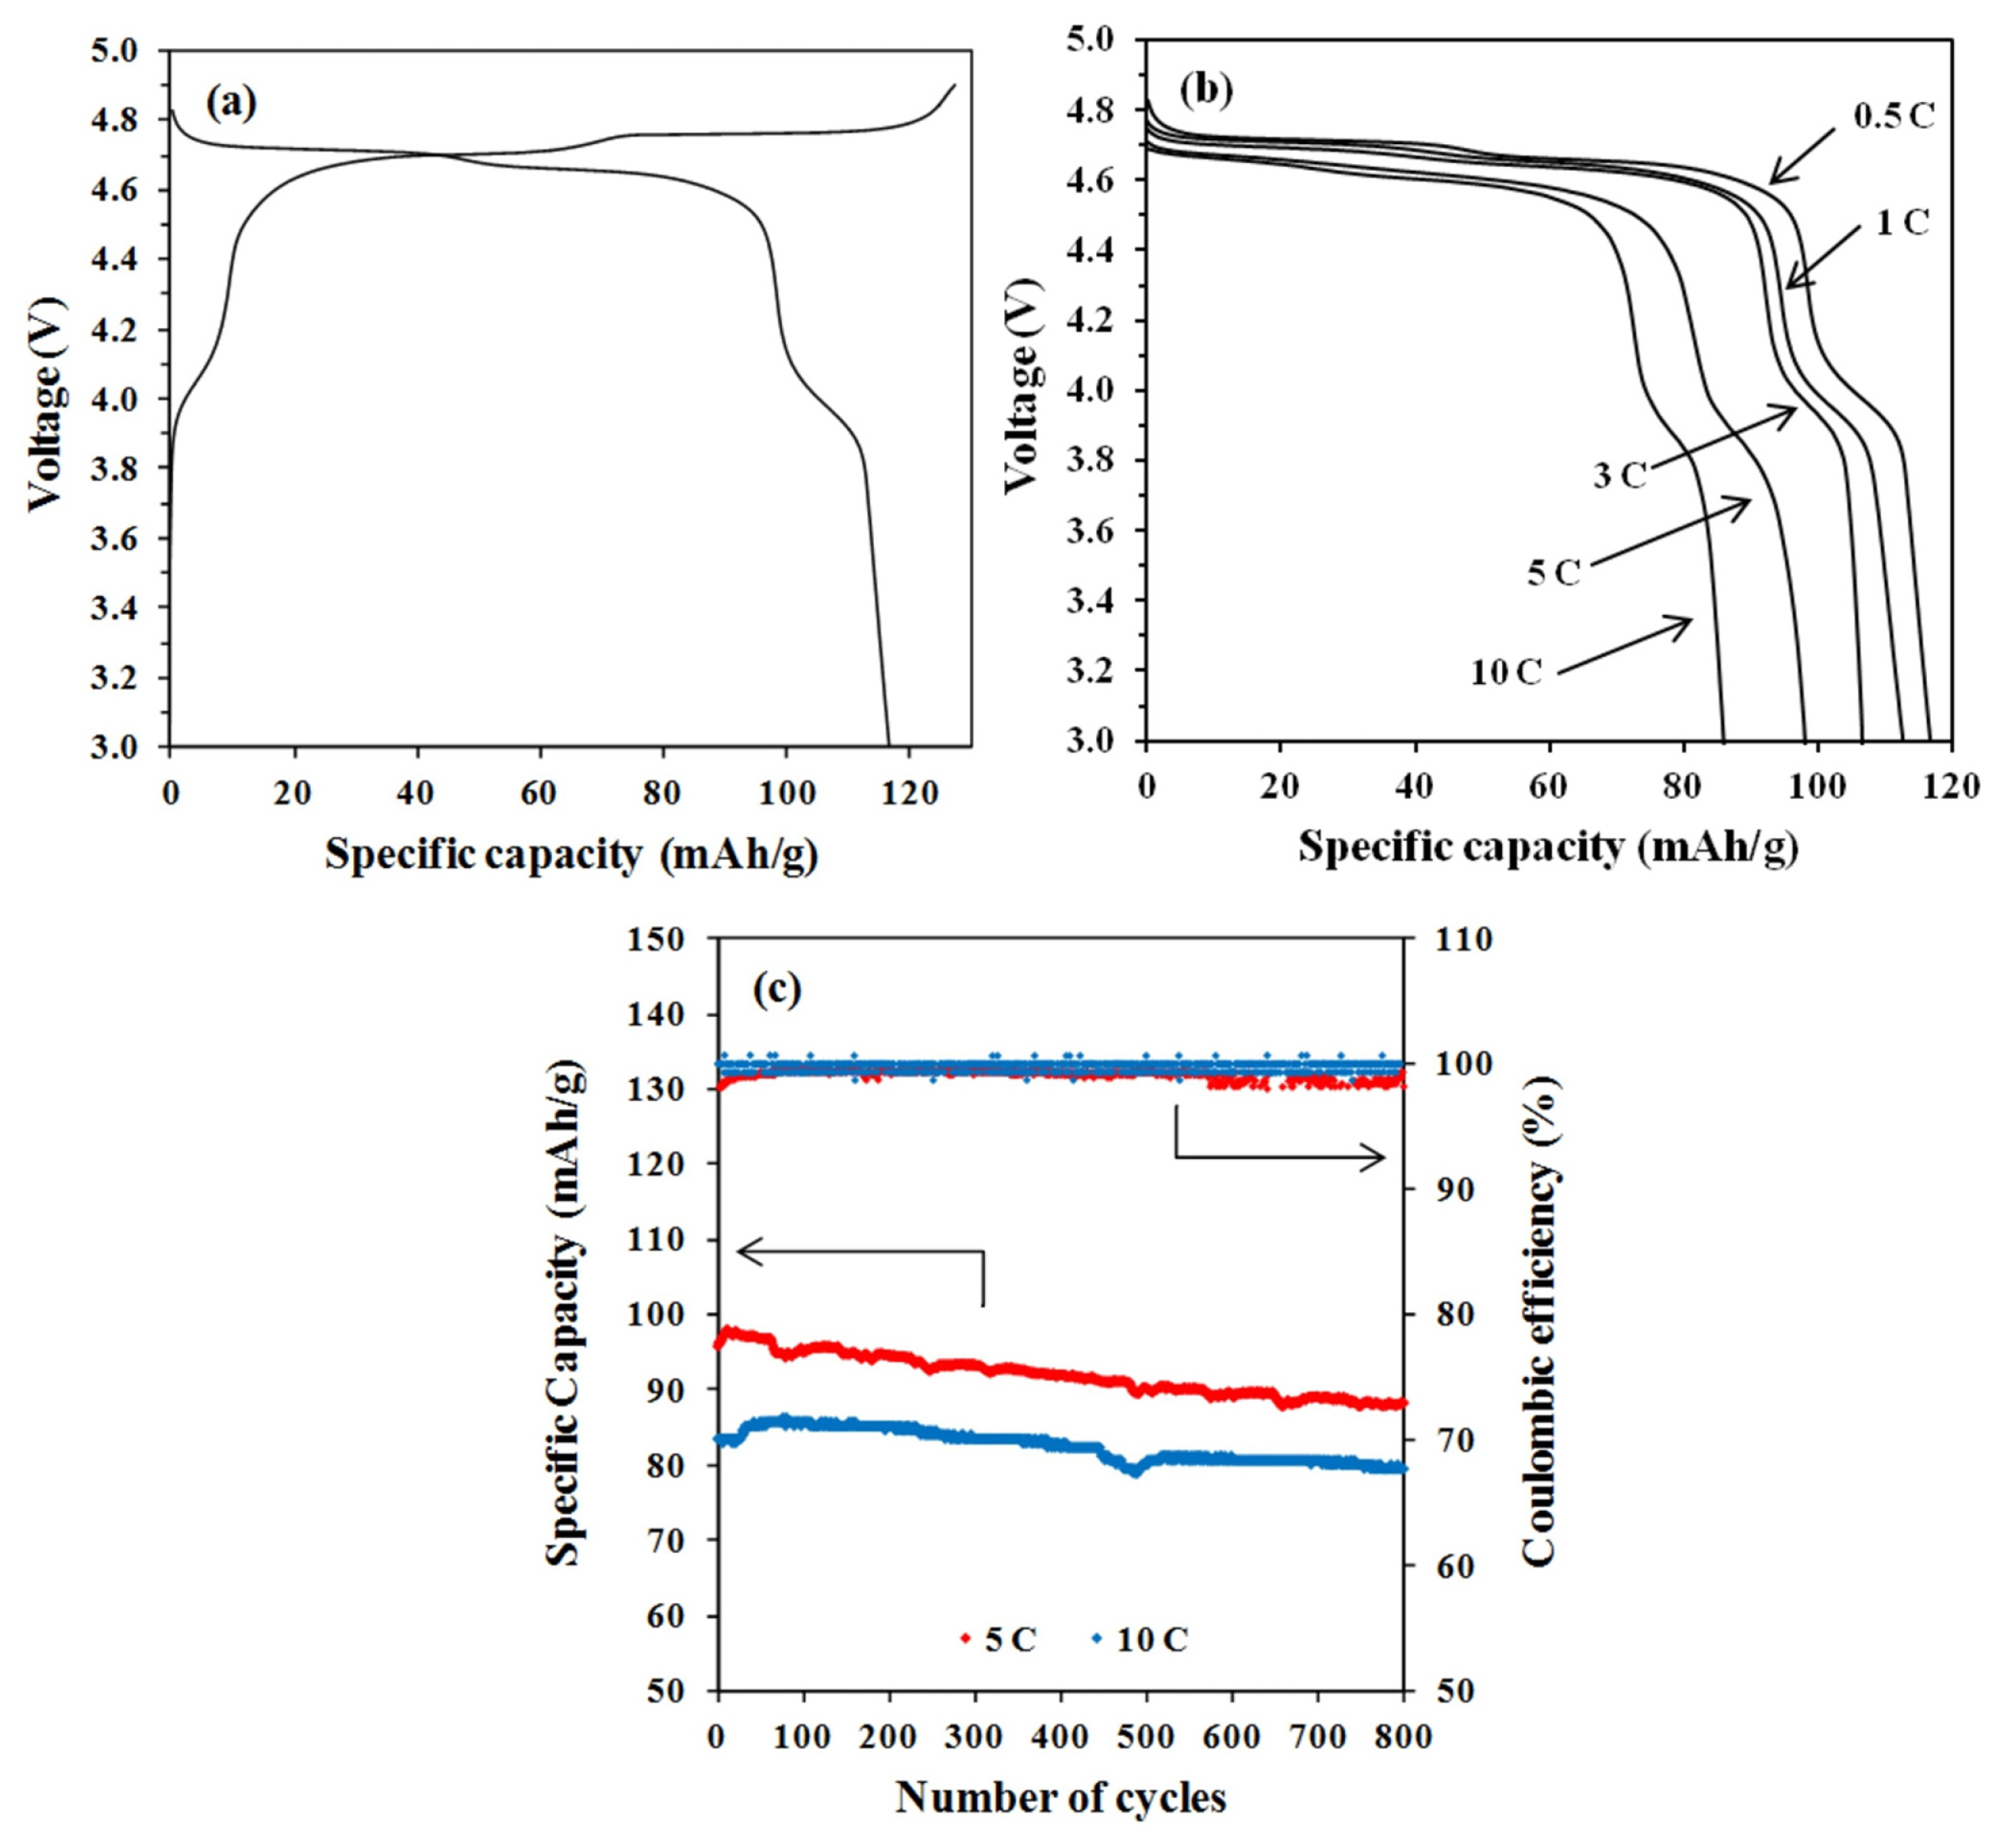
In this work, the charging voltage has been set at 4.9 V in order to prevent any contribution of electrolyte reaction to the charge-discharge performance of the LNMO half cell [17,18]. The charge-discharge curves of the LNMO half cell at 0.5 C are shown in Fig. 6a. The discharge capacity of synthesised LNMO is 117 mA h g−1, which is less than the theoretical capacity of 148 mA h g−1. This reduction in capacity is caused by the formation of secondary phase LixNi1-xO [19]. Nearly 85% of its capacity has been delivered in the plateau region around 4.7 V. Compared to other cathode materials, such as LCO and NMC (4 V), the LNMO can offer a higher energy density when employed in a LIB as a cathode due to its high operating voltage. Fig. 6b shows the discharge curves of the LNMO half cell under various C rates. It can be observed that the discharge voltage plateau decreases gradually with the increase in discharge rate. The rise in the over-potential at high rates can be attributed to it. Nevertheless, a voltage plateau at 4.6 V can be maintained even at 10 C. The spinel structure of LNMO can offer 3D routes for high rate Li diffusion, which results in rapid cathode kinetics. To further strengthen this viewpoint, tests on cycle performance at 5 and 10 C were carried out. As demonstrated in Fig. 6c, the LNMO cathode can retain up to 90% of its capacity after 800 charge-discharge cycles at a high C rate with high Coulombic efficiency. The excellent capacity retention indicates that the spinel framework of LNMO has the ability to withstand high rate charge-discharge throughout long cycle tests.
Fig. 7a illustrates a single step of the GITT curve for an LNMO half cell during the charging process. A current of 34 μA is supplied to the cell, initially at 4.7188 V (E0), for 10 minutes (τ). The voltage of the cell is then increased from E0 to Eτ, followed by 40 minutes of open circuit voltage (OCV) for the cell to relax to a new quasi-equilibrium voltage (Es). Finally, ΔEs denotes the total voltage variation. The process is repeated throughout the 3.8–4.9 V voltage range. The completed GITT curve of the LNMO half cell is shown in Fig. 7b. As shown in the insets, illustrating magnified views of the GITT curve, the cells initially exhibited small ΔEτ followed by larger ones during the progressive charge at 4.0–4.5 V. ΔEτ stabilized when the GITT process continued over the plateau region at 4.7 V. It has been shown that the increase of ΔEτ between titration steps corresponds to a single phase diffusion process, whereas stable ΔEτ corresponds to the occurrence of multiple phases [8,20]. By assuming Li transport in the electrode follows Fick’s second rule, the following equation can be used to determine DLi [9].
Where Vm is the molar volume of LNMO, MB and mB are the molecular weight and the mass of the active material respectively, S is the active surface area of the electrode and L is the thickness of the electrode. If voltage against τ1/2 behaves in a straight line across the whole period of current flow, as illustrated in Fig. 7c, equation 3 can be simplified further.
Fig. 7d shows that DLi values change non-monotonically across 3 orders of magnitude, from 10−9 to 10−12 cm2 s−1. Li diffusion coefficient determined from this work shows great similarities in the range of value and trend with different methods that can be found in other works [21,22]. The logarithmic plot indicates several diffusion minima as a function of the Li ion concentration. The first dip in DLi occurred at the early stage of Li deintercalation when DLi decreased from 1.08 × 10⁻⁹ at x = 1 to 3.51 × 10⁻¹⁰ cm2 s−1 at x = 0.95. As x value was reduced from 0.92 to 0.72, DLi decreased gradually from 1.45 × 10⁻⁹ to 4.32 × 10⁻¹⁰ cm2 s−1. The second dip took place during the Li deintercalation from x = 0.7 to 0.55, where the value of DLi dropped to about 9 x 10⁻¹¹ cm2 s−1. With further progression of Li deintercalation, where x is reduced from 0.39 to 0.19, the third dip can be observed. The depletion of DLi is more severe as the value diminished to about 6 × 10⁻¹² cm2 s−1. Finally, upon 95% of Li deintercalation, a DLi value of 2.32 × 10⁻¹⁰ cm2 s−1 is recovered.
During electrochemical cycles, any modifications in the crystal arrangement or chemistry of the electrode material will have an impact on the electrode’s Gibbs free energy and Li chemical potential, and consequently on the voltage of the cell. Because of the direct relationship between a measured voltage curve and the Gibbs free energy, phase transformations caused by changes in Li concentration will leave distinct fingerprints on the voltage curve [7,8]. For an electrode material such as NMC, that forms a solid solution during charge-discharge, the voltage curve will exhibit a smooth sloping region [23]. If charge-discharge is coupled with a first order phase transition, as occurs in Li4Ti5O12 (LTO) and LiFePO4 (LFP), it will possess a free energy curve exhibiting two local minima [23,24]. Because the free energy of the two phase mixture occupies the same tangent, the Li chemical potential inside the phase transition region (the miscibility gap) remains constant. As a result, a voltage plateau appears in the charge-discharge curve. Steps will emerge in the charge-discharge curve if an intermediate phase is stable [25–27].
The X-ray absorption of LNMO revealed that Ni2+ oxidized to Ni4+ while Mn3+ oxidized to Mn4+ during Li deintercalation [28]. The same study also uncovered that Ni2+ is oxidized to Ni4+ via the Ni3+ state as expressed in the electrochemical reaction below,
(4)
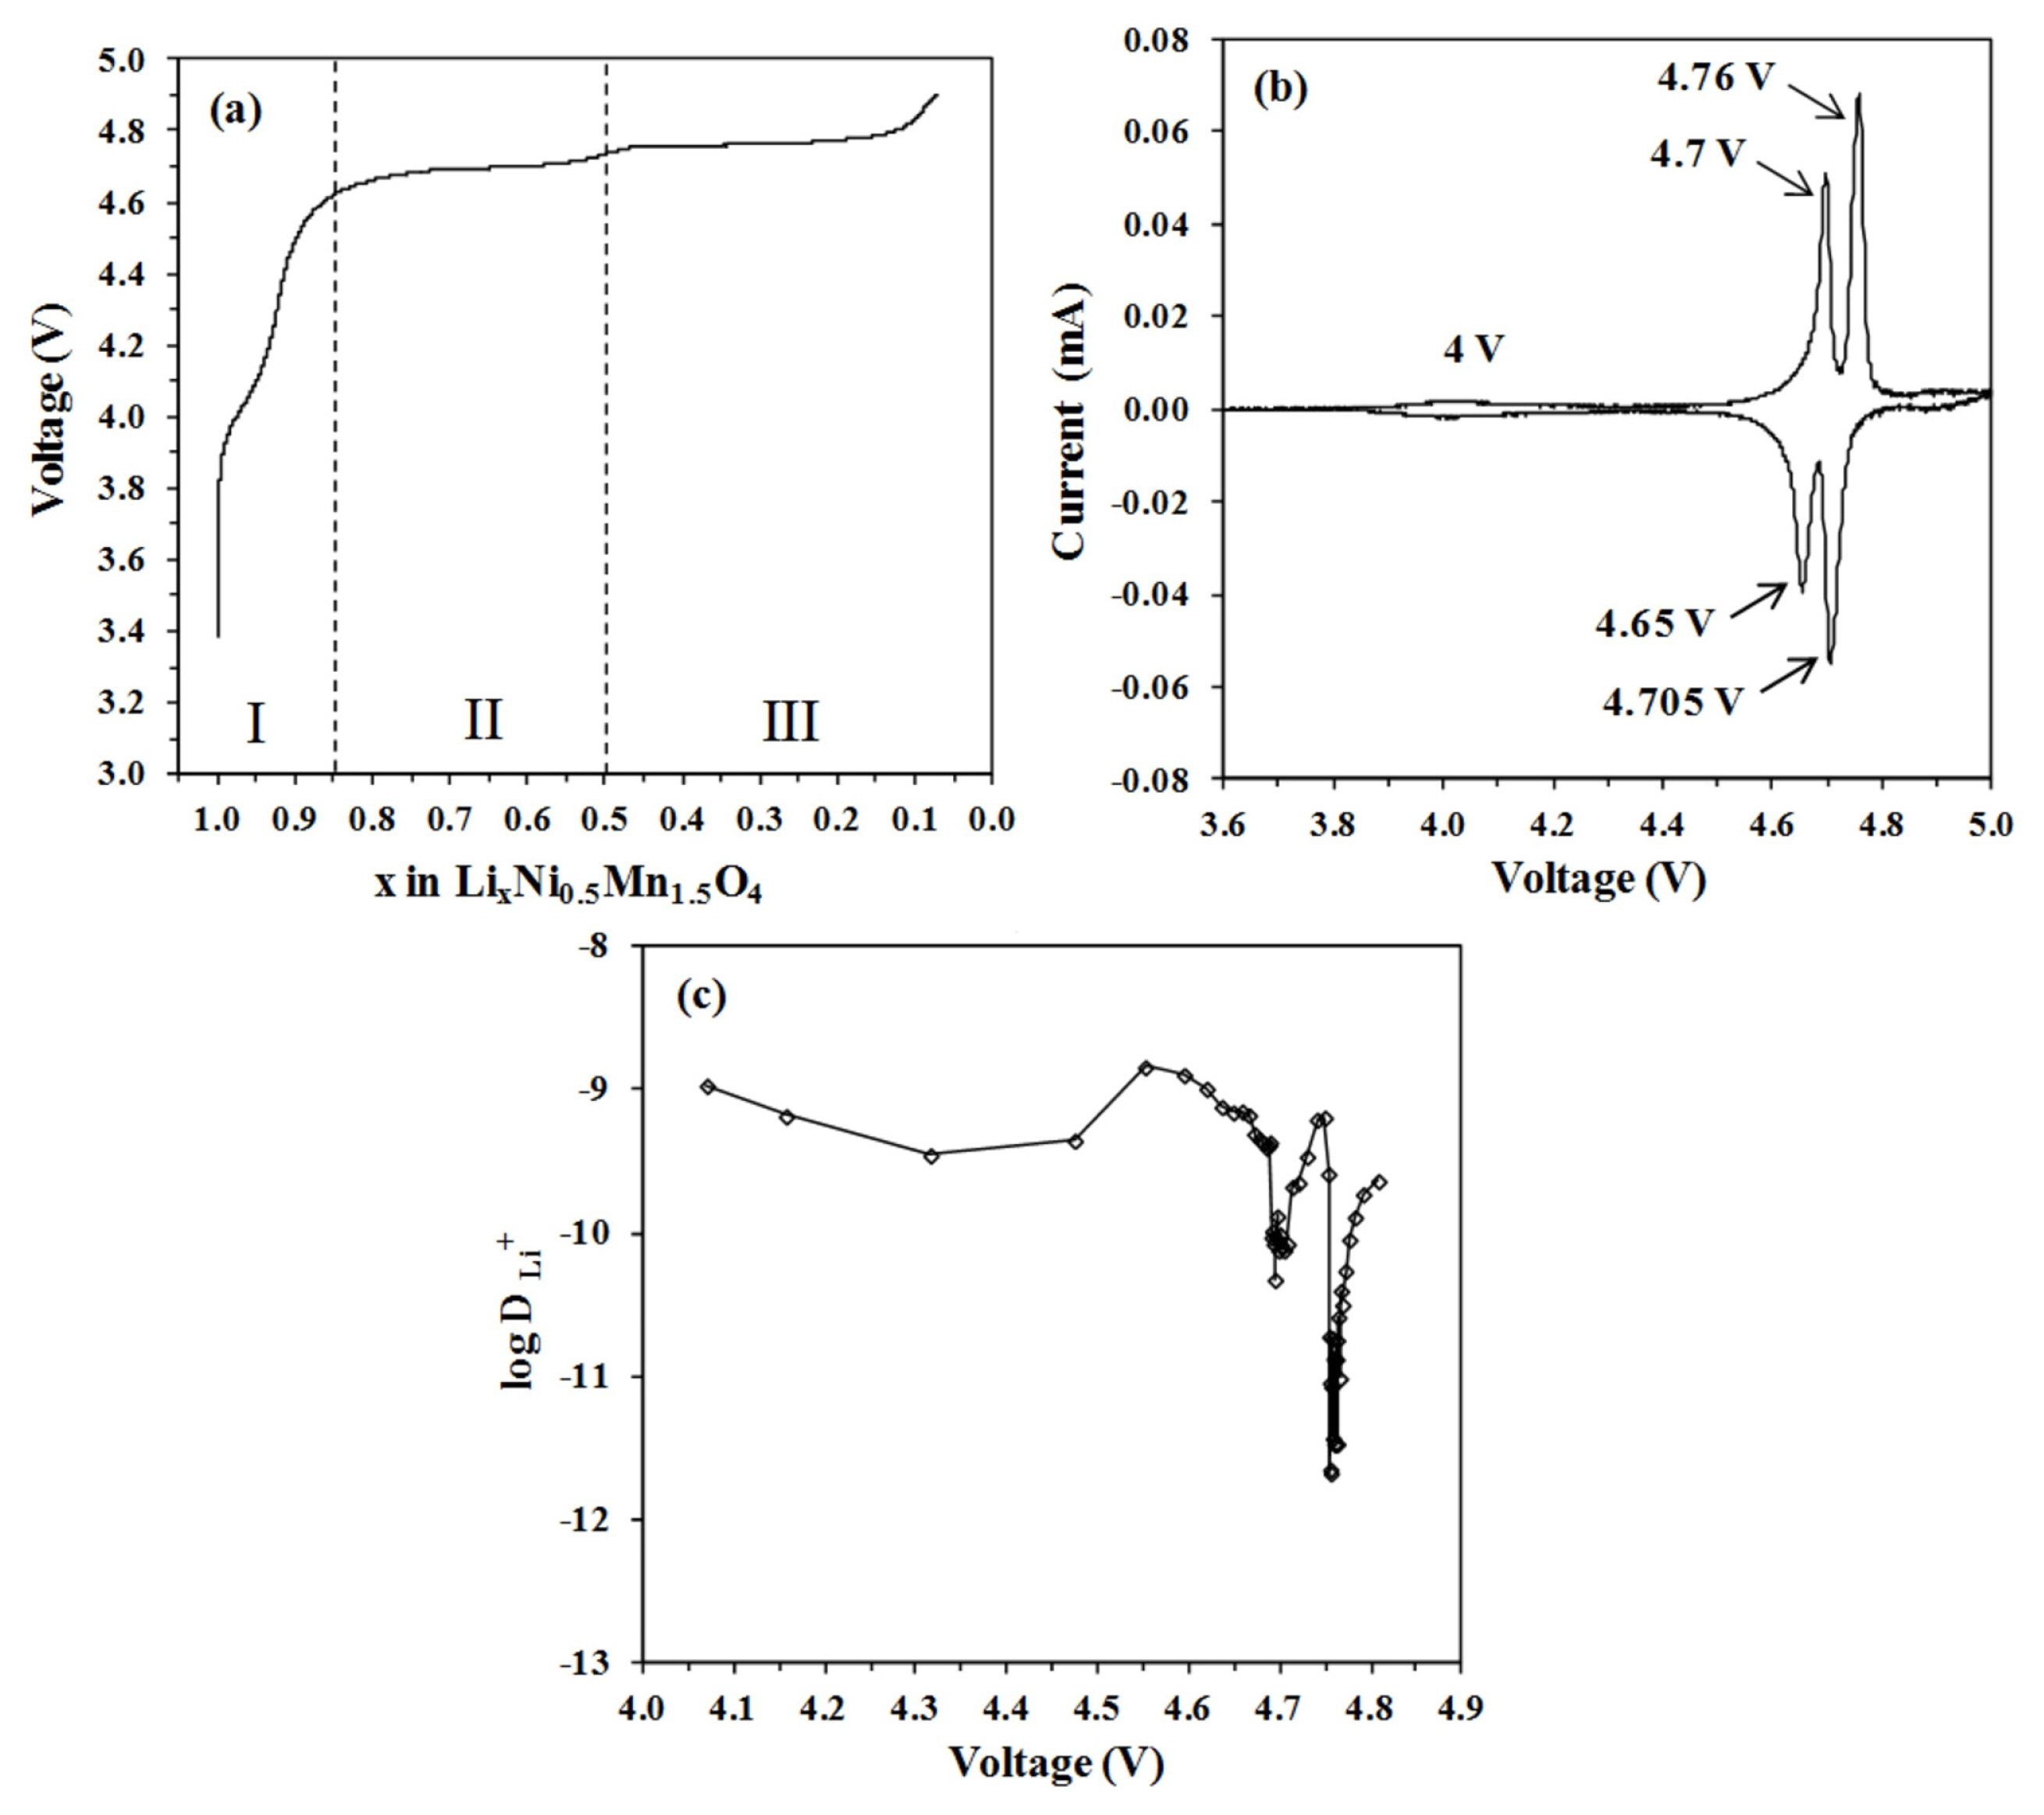
The charge curve as a function of Li concentration is shown in Fig. 8a. Upon extraction of Li ions, voltage increases continuously with clearly defined steps. A short quasi-plateau at 4.0 V reflected the oxidation reaction of Mn3+/Mn4+, whereas, two plateaus at 4.7 V and 4.75 V were attributed to the oxidation reaction of Ni2+/Ni3+ and Ni3+/Ni4+ respectively [29]. Three peaks that are associated with each oxidation reaction are shown in the cyclic voltammogram (Fig. 8b). The variation of DLi as a function of cell voltage is depicted in Fig. 8c. Three regions can be clearly distinguished in the charge curve: x > 0.85 (I), 0.85 > x > 0.50 (II) and x < 0.5 (III). These three regions represent structural transformation throughout the full Li deintercalation process [25–27]. When the degree of Li extraction is low (region I), the voltage rises steadily. It can be classified as a solid solution reaction. A second phase then develops, beginning at x = 0.85 (region II), which corresponds to the emergence of the first plateau. The second phase has the same space group as the first, but a smaller lattice constant. Finally, in the region x < 0.5 (region III), the second plateau can be seen, which indicates the transition of the second phase into the third cubic phase. The lattice constants of the first, second, and third phases were refined to be 8.17, 8.08, and 8.00 Å, respectively [27]. The second phase serves as a buffer, accommodating the disparity between the first and final phases during Li deintercalation [30]. The reduced size in lattice dimensions is directly linked to lower Li content [27] as well as a higher average Ni oxidation state [28].
Based on the results from Figs. 7 and 8, DLi minima appear to be strongly correlated with charge states. The elimination of Li in the region I is accompanied by the oxidation of Mn3+ to Mn4+. Upon slight Li deintercalation, the electronic conductivity of the Fd3̄m LNMO decreased [26,31]. Once all Mn3+ charge carriers are oxidized into Mn4+, electronic conductivity reaches its lowest point. DLi appears to follow a similar pattern. The decline in DLi begins immediately after the Li deintercalation process and reaches its first minimum at x = 0.95. From this minimum, DLi is increased until it reaches about the same value as at the starting point of the measurement. Such a rise in DLi is due to Mn ion valence states. Around 4 V, the LNMO electrode experienced an oxidation reaction of Mn3+/Mn4+. The presence of more Mn4+ ions improves Li diffusion by lowering local activation barriers [32,33]. It is important to note that during Li deintercalation in region I, the LNMO electrode exhibits solid solution reaction. Because several complicated factors, such as phase transition or order-disorder reaction, are absent in such a reaction, the electrode kinetics are rather less sluggish. Starting at x = 0.92, the value of the DLi gradually decreases as more Li ions are deintercalated. This observation correlates with the kinetics of Li ions transport in the spinel structure. Li ions diffuse in this spinel structure by migrating between tetrahedral sites via intermediary empty octahedral sites. Since the intermediary octahedral sites are coordinated with two tetrahedral sites (the initial and final migration sites), Li diffusion takes place by a single vacancy mechanism [34]. Diffusion facilitated by a single vacancy mechanism leads to a significant dependency of the DLi on Li concentration [8,34]. The migration barrier for diffusion increases when more Li ions are removed from the LNMO host, resulting in a gradual decrease in DLi starting at x = 0.92 in region I.
During the charging process, the LNMO electrode undergoes three stages of phase change. Initially, LiNi(II)0.5Mn(IV)1.5O4 (Li1) changes to Li0.5Ni(III)0.5 Mn(IV)1.5O4 (Li0.5) and finally, Ni(IV)0.5Mn(IV)1.5 O4 (Li0). Therefore, unlike the LFP and LTO electrodes, which have a single diphase coexistence, the phase transition reaction of the LNMO electrodes becomes more complex due to two successive phase shifts at almost the same voltage: Li1 ↔ Li0.5 at 4.7 V and Li0.5 ↔ Li0 at 4.75 V. Throughout this high voltage region (regions II and III), GITT measurement reveals almost three orders of magnitude reduction in DLi as a function of the extent of Li deintercalation. This observation implies that the decrease in DLi is linked to the formation of phase boundaries which develop between phases during nucleation and growth processes in multiphasic electrodes. Understandably, the rate of the two phase transition is regulated by the phase boundary migration [26]. This phase boundary migration is sensitive to the concentration gradient of Li ions permitted in the two phases. The cathode material will not be able to retain high Li concentration gradients in the absence of solid solution behaviour, resulting in slower Li diffusion. In battery cycling, the formation of phase boundaries combined with a high lattice mismatch between the phases usually results in low rate capability [20,35]. Despite these, the LMNO electrode may still be cycled at high rates while maintaining good capacity retention and excellent Coulombic efficiency.
The dip in DLi at 4.75 V, which corresponds to the Li0.5 ↔ Li0 transition, is more severe than the dip at 4.7 V, which is associated with the Li1 ↔ Li0.5 transition. As previously stated, in the high voltage region (regions II and III), the three orders of magnitude depletion of DLi results from phase boundary stabilisation and elimination and is not due to intrinsic differences in migration barriers throughout deintercalated phases as exhibited in region I. Although these three phases have the same basic cubic crystal structures, there are significant kinetic differences during the transition between phases. The Li1 phase possesses a thermodynamically stable solid solution region that can attenuate the lattice deformation during the Li1 ↔ Li0.5 transition, while in the Li0.5 ↔ Li0 transition, there is no such region. It is also suggested that this is due to the slower redox reaction of Ni3+/Ni4+ than Ni2+/Ni3+ that might lead to sluggish transitions which eventually impair Li diffusion [28].
4. Conclusion
The spinel LNMO electrode material was synthesized using the sol gel technique and structural, electrochemical, and kinetic properties of the LNMO were investigated. The synthesized LNMO can be assigned to the Fd3̄4 cubic space group. The high capacity retention suggests that the spinel structure of LNMO may withstand high rate charge-discharge during long cycle testing. The DLi changes non-monotonically over three orders of magnitude, ranging from 10−9 to 10−12 cm2 s−1. The DLi variation appeared to be connected to three oxidation reactions that occurred throughout the charging process. The oxidation of Mn3+ to Mn4+ is associated with a small dip in DLi at the beginning of Li deintercalation. While the oxidation of Ni2+/Ni3+ and Ni3+/Ni4+ results in two pronounced DLi minima at 4.7 V and 4.75 V, respectively. The occurrence of two phase transformation reactions can be attributed to the depletion of DLi at the high voltage region.