


1. Introduction
Capacitive deionization (CDI) is one of the promising energy efficient technologies for the desalination of water [1-2]. Adsorption of ions on to electrode surface during the introduction of electrical potential is a basic concept of CDI [3]. The electrosorption is a process in which a known potential is applied to an electrode of an electrochemical cell. As a result the inorganic ions present in the electrolyte moved to the electrical double layer (EDL) of the electrode surface and if the potential is removed, the ions are released back to the solution. This process operates at low cell voltages and hence it is more energy efficient than electrodialysis and even reverse osmosis when the low salt content feed is treated [4-6]. The expensive high surface area carbon aerogel electrodes are used at present in electrochemical treatment procedures and which is a major challenge to be tackled in order to make this process commercially viable [7-8]. Many other alternatives for carbon electrodes such as carbon nanotube composites [9] are being investigated for potential application in CDI. Activated carbon cloth (ACC) is one of the cost effective high surface area electrode material which finds commercial application in wastewater treatment [10].
Preparation and activation methods for improving the surface activity and porosity of ACC materials [11-12] including electrochemical activation [13- 14] are currently under investigation. These materials are also optimized for potential use as electrodes in supercapacitors in energy storage devices [15-16]. Highly porous nanostructured ACC carbon [17-18], titania modified material[19], ordered mesoporous carbon (OMC) [20], carbon naotubes (CNT) and its carbon nanofiber composite [21], zinc oxide [22] and modified ACC electrodes have been found to be applicable in CDI processes. The current initiatives thus indicate that there is a considerable scope for further studies in this area.
In the present research work, the effect of chemical activation of commercially available carbon cloth in 1 M and 8 M HNO3 was studied and reported. The activated carbon cloth (ACC) materials were systematically characterized by scanning electron microscopy (SEM) (JSM-6390, JOEL), X-ray diffraction meter (XRD) (XRD-6000 SHIMADZU), and BET-surface analyzer (Micromeritics ASAP-2020) to understand the physico-chemical surface characteristics of carbon cloth materials. In addition to the above, the untreated and treated carbon cloth materials were subjected to electrochemical studies such as cyclic voltammetry (CV) and Chronocoulometry (CC) with an electrochemical workstation (CHI6038D, CH Instruments, USA) and the results obtained were reported and discussed.
2. Experimental
2.1 Materials
The carbon cloth with a surface area 1000 m2/g and pore volume (0.3-0.4 cc/g) [HEG Limited, India], graphite sheet [Chemapol Industries, India], graphite conductive adhesive [Electron Microscopy Sciences, India], sodium sulphate anhydrous (Na2SO4 99%) [Himedia, India] and concentrated nitric acid (HNO3 70%) [Himedia, India] were used in this study.
2.2 Activation of carbon cloth
The carbon cloth was chemically activated in nitric acid by varying the nitric acid concentration (1 and 8 M) for about 9 h. The activated carbon cloth (ACC) was taken out and thoroughly washed with de-ionized water until the wash solution attained neutral pH (7.0 ± 0.2). The (ACC) samples were then dried at 60℃ for 6 h before fixing it on the graphite paper for electrochemical measurements.
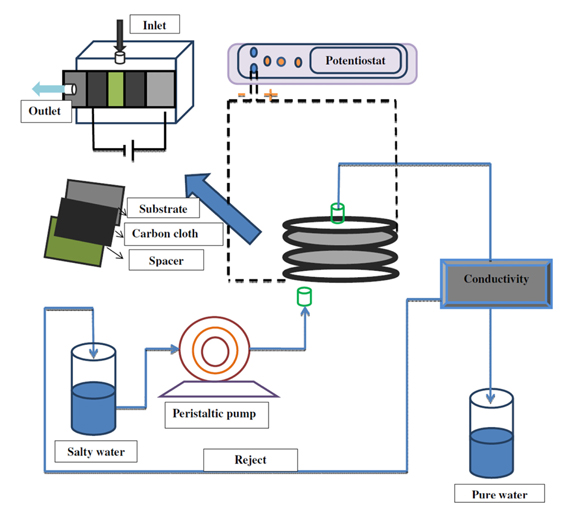
2.3 CDI cell setup
The carbon cloth (untreated and activated carbon cloth) was fixed on a graphite paper through graphite conducting adhesive to ensure good electrical contact. Two identical electrodes facing each other (1 cm2) served as working and counter electrodes in a 25 mL capacity single compartment electrochemical cell. A freshly prepared Ag/Ag2SO4 electrode stored in saturated Na2SO4 solution served as the reference electrode since aqueous Na2SO4 solution was mainly used as the electrolyte in CDI studies. The schematic representation of the cell setup is given in Fig. 1.
3 Results and Discussion
3.1 BET Surface area analysis
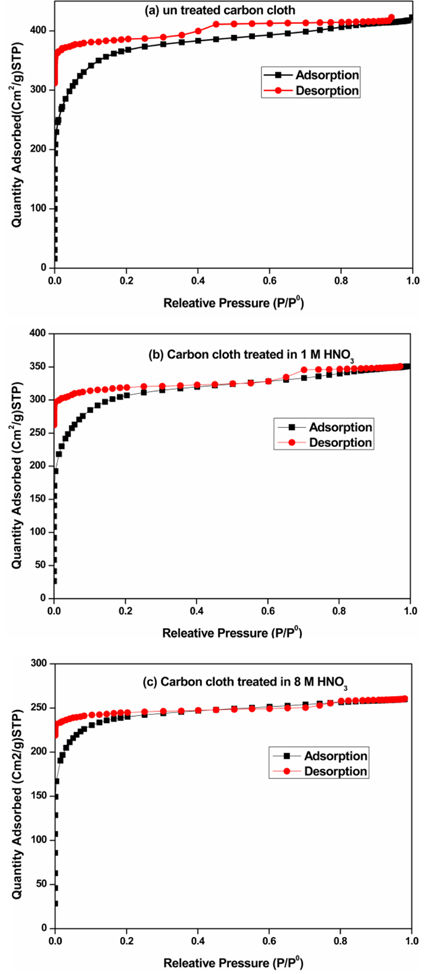
The BET surface area analysis was carried out by N2-adsorption/desorption isotherm at 77 K. All the samples were gassed at 150℃ for 12 h before carrying out the analysis. The obtained N2 adsorption/desorption profile of untreated carbon cloth and activated carbon cloth in 1 M HNO3 and 8 M HNO3 are illustrated in Fig. 2a, 2b and 2c respectively. As shown in Fig. 2a, the observation of extended hysteresis loop appears at high relative pressure range (0.4-0.8) indicates the existence of the macropores size in the untreated carbon cloth. But, the hysteresis loop becomes discrete in Fig. 2b, in which the hysteresis loop appears at lower relative pressure range (0.0-0.4) due to the presence of micropores in the sample. The macropores found in untreated sample was converted into micropores in the relative pressure range (0.0-0.4) because of the chemical treatment in 1 M HNO3 for 9 h. Further increasing the HNO3 concentration (from 1 M to 8 M), the high relative pressure hysteresis loop is completely disappeared and resulted with a clear low pressure hysteresis loop (0.01-0.2) which clearly specifies that the complete formation of micropores the sample. The above study confirms that macropores found in untreated carbon cloth completely has been converted into micropores by the treatment of 8 M HNO3 for 9 h.
Fig. 2.
Adsorption-desorption isotherms of N2 at 77 K for (a) untreated carbon cloth (b) carbon cloth treated in 1M HNO3 for 9 h and (c) carbon cloth treated in 8M HNO3 for 9 h.
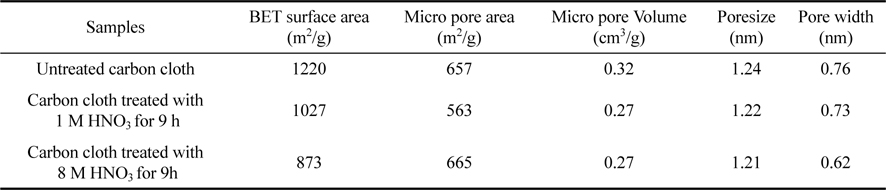
The surface characteristics obtained by BET method on carbon cloth and chemically activated carbon cloths are indicated in Table 1. From the table, it was found that the pore size and the pore width of the treated carbon cloth with HNO3 for 9 h are found to be less than the other samples. This indicates the influence of HNO3 in decreasing the surface area of the samples in an effective manner.
3.2 SEM analysis
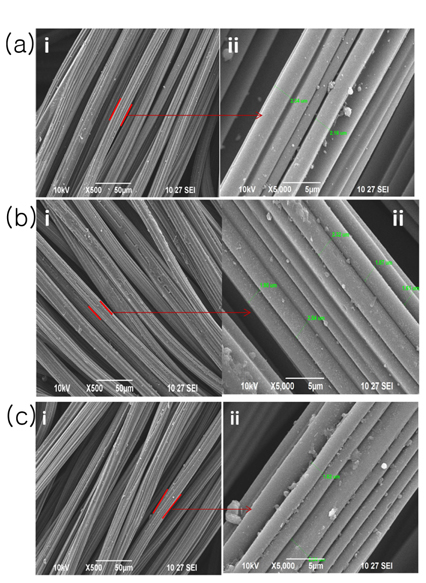
The SEM pictures obtained an untreated carbon cloth and carbon cloth treated in HNO3 are presented in in Fig. 3a, 3b and 3c respectively. SEM images of the untreated carbon cloth material are shown in Fig. 3a (i & ii). Carbon cloth having bundles with fibers having 3 µm in diameter is shown Fig. 3a. The SEM images of untreated carbon cloth material fibers are quite similar to those already in the literature with diameter having 20 µm [19]. The SEM pictures of treated carbon cloth sample with HNO3 (1 M and 8 M for 9 h) are indicated in Fig. 3b (i & ii) and 3c (i & ii) respectively. Fig. 3 (a) and Fig. 3 (b) have shown the reduction in the diameter of the carbon fibers due to the chemical treatment of HNO3 acid. It was reported that the chemical treatment may enhance the electro-adsorption and electro-desorption characteristics of carbon cloth materials [8]. Therefore, the chemical treatment analysis has contributed significantly in the chemical modification of carbon cloth materials which may enhance their performance in the electrochemical studies.
3.3 XRD analysis
The XRD patterns obtained on untreated carbon cloth, treated carbon cloth in (1 M HNO3 for 9 h) and treated carbon cloth in (8 M HNO3 for 9 h) are indicated in Fig. 4 (a), (b) and (c) respectively. From the figures, it was found that the samples exhibited the crystalline behavior. The intense peak appeared at 2θ = 24° and 44° may be attributed to the (002) and (100) crystal planes for graphite as reported in the literature [23]. These graphitic sites may be involved in the electronic conduction as well as electrosorption of ionic species during the electrochemical treatment of water.

3.4 Cyclic voltammetry analysis
Typical cyclic voltammograms (CV) obtained with untreated carbon cloth and chemically treated carbon cloths (in 1 M and 8 M HNO3 for 9 h) at different sweep rates (1, 2 and 4 mV/s) in 0.1 M Na2SO4 are shown in Fig. 5(a), (b) and (c) respectively. In the potential range between −0.5 V and +0.5 V, the CV curves of the untreated sample show a linear resistance behavior along with the capacitance loop (Fig. 5a). From the results, it was found that the resulted current values may be less sensitive to the sweep rate. The specific capacitance values of the untreated and chemically treated electrodes were calculated and indicated in Table. 2. The CV curves obtained for HNO3 treated samples have shown higher capacitance values (Fig. 5b). The increase in specific capacitance values for the chemically modified carbon cloth electrodes may due to the enhancement of electrosorption capacitance in these materials due to the chemical treatment with HNO3 [18]. The CV curves obtained on the treated electrodes [in 1 M HNO3 and 8 M HNO3 for 9 h] at low scan rates show rectangular shaped curve (Fig. 5b and 5c), which indicates the good capacitive properties of the electrodes. The electrosorption of the electrodes is higher at lower scan rates. It is because of the diffusion of ions from the solution to the electrode surface due to adsorption/desorption mechanism [9]. As the scan rate increases, the rectangular shape of the CV curves for the chemically treated samples became more slanting as shown in Fig. 5b and 5c. This may be due to the higher electrosorption behavior of the samples because of the chemical treatment with nitric acid. However, the effective inner surface adsorption of ions was reduced at higher scan rates in all the samples as reported [9]. The difference in anodic (ia) and cathodic (ic) current was used to calculate the approximate specific capacitance in F(C Charge) value as indicated in equation (1).

Fig. 5.
Cyclic voltammetry obtained on (a) un treated carbon cloth (b) carbon cloth 1 M HNO3 for 9 h and (c) carbon cloth treated in 8 M HNO3 for 9 h in 0.1 M Na2SO4 solution at 1, 2 and 4 mV/s.
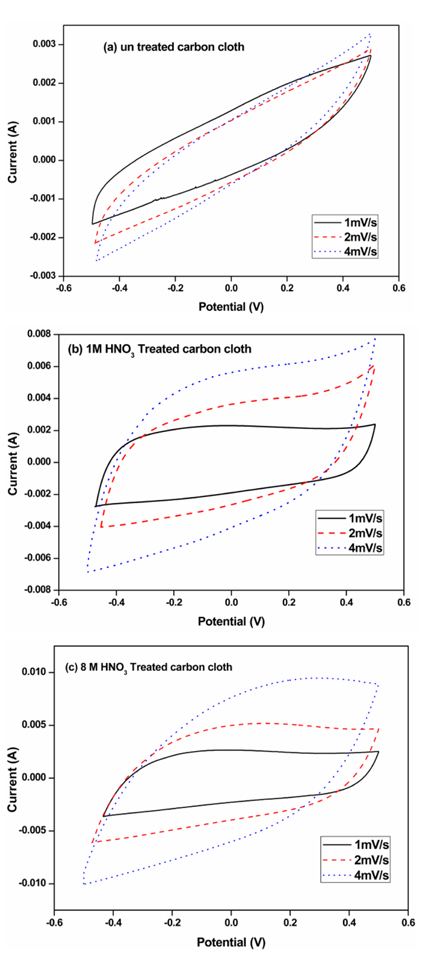
Table 2.
Specific capacitance values obtained for untreated carbon cloth and treated carbon cloth (1 M for 9 h & 8 M for 9 h respectively) by using cyclic voltammetry (CV) and chronocoulometry(CC) techniques
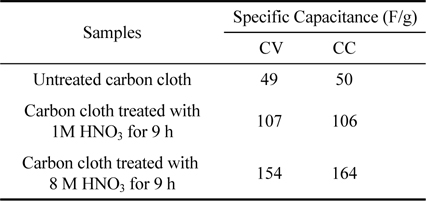
where ‘C’ is the specific capacitance (F/g), ‘dv/dt’ is the sweep rate in V/s, ‘m’ is mass of activated carbon cloth and ‘ia’ and ‘ic’ are the anodic and cathodic current in A respectively. The weight ‘m’ of 1 cm2 electrode material is found to be 0.016 g. From Table 2, it was found that the specific capacitance value of the untreated sample increased from 49 F/g to 154 F/g due to the chemical treatment with 8 M HNO3 for 9 h. The specific capacitance values obtained by CV experiments for the samples are found to depend on the sweep rates due to the time dependence of the ionic charging process [9,18].
3.5 Chronocoulometry analysis
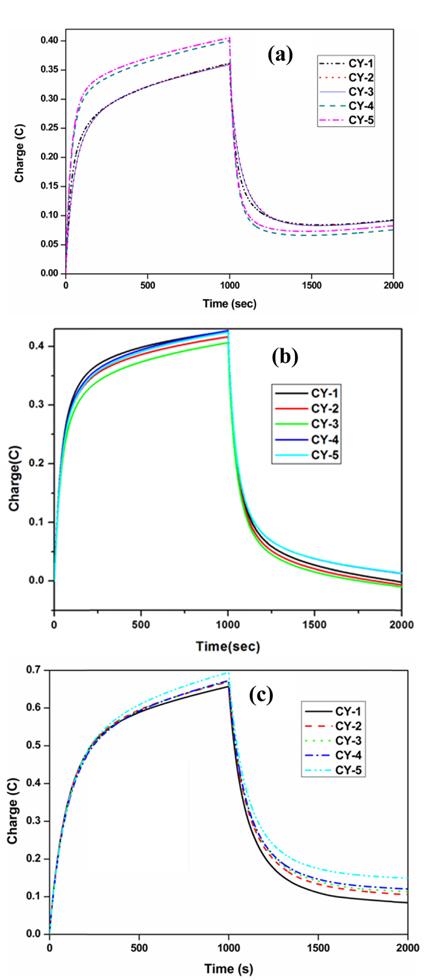
Chronocoulometry experiments were carried out with a charging voltage of 0.25 V and discharging voltage of 0.0 V for 1000 seconds in each step to get the charging (Ccharge) and discharging (Cdischarge) capacitance values at these two potentials respectively. The ratio between these two values provides the charge recovery achieved during each charge/discharge cycle. The charging capacitance is calculated based on the following equation (2).

Where ‘CR’ is charge recovery, ‘Qf’ forwarded charge in coulombs, ‘Qr’ reverse discharge in coulombs respectively. Typical chronocoulometric curves obtained on untreated carbon cloth, treated carbon cloth (1 M HNO3 for 9 h) and treated carbon cloth (8 M HNO3 for 9 h) in 0.1 M Na2SO4 solution are shown in (Fig .6a, b and c). The capacitance values calculated for all the samples are indicated in Table 2. The results indicated that the specific capacity remains fairly high at around 104 and 154 F/g respectively for the samples treated with HNO3 (1 M and 8 M) for 9 h in 0.1 M Na2SO4 solution. The charge recovery ratio was also remained high at around 85% for both the treated samples. These results are also comparable to the specific capacitance values (120 F/g) reported in the literature for the TiO2 nanoparticle coated ACC electrodes obtained using chronocoulometry [19]. However, the specific capacitance obtained for the sample treated with 8 M HNO3 is found to be good when compared with the reported result.
4. Conclusion
A simple study to evaluate the electrochemical characteristics of the carbon cloth material (untreated and treated with HNO3) in the capacitive deionization (CDI) process for the waste water treatment is reported. BET studies obtained on the treated carbon cloth using 8 M HNO3 resulted as a component with micropores which is required for the enhancement of ion-adsorption characteristics in CDI process. The XRD studies revealed the crystalline behavior in both untreated and treated samples. The electrochemical studies based on cyclic voltammetry and chronocoulometry exhibited a better specific capacitance (154 - 164 F/g) values for the treated carbon material (with 8 M HNO3 for 9 hours). The treated carbon cloth materials with HNO3 can be used effectively in CDI process for the treatment of waste water.


