1. Introduction
Layered metal oxide, LiCoO2, is the most attractive cathode material for rechargeable lithium-ion batteries because of its stable electrochemical cycling and ease of production [1,2]. However, the high cost and low discharge capacity of cobalt motivated the study of possible alternatives. High nickel cathode materials have been proposed as an alternative to LiCoO2 owing to their relatively higher discharge capacity and lower material cost [3]. However, they have severe disadvantages such as poor cycle performance, low rate capability, and thermal instability in organic electrolytes [4,5]. Therefore, intensive research has been performed on the Ni-rich cathode materials, which also possess the advantages of LiCoO2. One approach to improve the electrochemical performance is to substitute nickel cobalt manganese oxides partially with non-transition metals, which may stabilize the layered structure without participating in the redox processes and prevent unwanted reactions between cathode and electrolyte. So far, elements such as Fe and Mg have been reported for the partial substitution of Ni to reduce cation mixing and improve the rate capability of cathode materials [6,7]. Hence, substitution of Ni in Ni-based oxides may be a good method to modify the structural and electrochemical performances of these materials. In this study, yttrium ion was selected as a doping element because of its larger binding energy with oxygen than nickel ion, thereby stabilizing the lattice structure by preventing oxygen loss in the delithiated state [8,9]. In addition, extensive studies have been carried out to coat the surface of cathode materials with conductive polymers. The surface modification of cathode materials with a conductive polymer is quite beneficial with respect to the delivery of the original capacity without reduction in the amount of electrochemically active elements present in cathode materials [10]. Among various conductive polymers, poly(3,4-ethylenedioxythiophene): poly(styrene sulfonate) (PEDOT:PSS) is one of the promising coating materials owing to its high electronic conductivity and good electrochemical stability [11–13]. In this study, we report the effects of doping with yttrium and coating with PEDOT:PSS on the structural and electrochemical properties of the LiNi0.8Co0.1Mn0.1O2 system. The changes in the electrochemical characteristics of the material upon doping and coating are explained with the results of our dQ/dV plot and electrochemical impedance test. The safety characteristics of the doped and coated materials in their fully charged states were studied using differential scanning calorimetry (DSC).
2. Experiments
Ni0.8Co0.1Mn0.1(OH)2 precursor was prepared by the co-precipitation method using stoichiometric amounts of NiSO4·6H2O (SAMCHUN), CoSO4·7H2O (SAMCHUN, 98%), and MnSO4·H2O (SAMCHUN, 98%). First, a stoichiometric amount of metal solution at a concentration of 1 mol L−1 was pumped into a continuously stirred tank reactor (4 L) under a N2 atmosphere. Simultaneously, 2 mol L−1 of NaOH solution (SAMCHUN) and a desired amount of NH4OH solution (SAMCHUN) as a chelating agent were also separately pumped into the reactor. The pH of the entire reaction process was maintained between 11.5 and 12.0.
The obtained Ni0.8Co0.1Mn0.1(OH)2 precursor was thoroughly mixed, ball-milled for at least 24 h with an appropriate amount of LiOH·H2O (Aldrich, 98%) and Y2O3 (Aldrich, <50 nm) powder (0.025 mol % ratio in total cation), and calcined at 750°C for 10 h in an O2 atmosphere. However, a slightly excess stoi-chiometry of lithium (1.09) was used to compensate for any loss of the metal, which might have occurred during firing at high temperature.
PEDOT:PSS (Aldrich) was dispersed in ethanol at a concentration of 1 wt%. The yttrium-doped LiNi0.8Co0.1Mn0.1O2 powders were mixed into the polymer solution, and the mixture was stirred at 60°C for 12 h to induce surface coating of the yttrium-doped LiNi0.8Co0.1Mn0.1O2 powders. After filtering the mixed solution and drying under vacuum at 120°C for 24 h, surface-coated LiNi0.8Co0.1Mn0.1O2 powders were obtained.
X-ray diffraction (XRD) patterns were obtained using an X-ray diffractometer in the 2θ range from 10 to 70° and with monochromatic Cu-Kα radiation (λ = 1.5406 Å). Samples were investigated using scanning electron microscopy (SEM, QUANTA 300, JEOL) analysis before and after doping. CR2032 type coin cells were assembled in a glove box using the above cathode film, lithium, a porous polyethylene film, and a 1 M LiPF6 solution in ethylene carbonate (EC)/diethyl carbonate (DEC) (1:1 vol/vol). The lithium metal foil was used as the counter and reference electrode. The assembly was measured in an argon-filled glove box. The charge–discharge curves were measured at voltages ranging from 3.0 to 4.5 V. Impedance spectroscopy was carried out at room temperature using frequencies ranging from 0.01 Hz to 0.1 MHz at an alternating-current amplitude of 10 mV. Nyquist plots (Z′ vs −Z″) were drawn and analyzed using Z plot and Z view software.
3. Results and Discussion
Fig. 1 shows the SEM images of the bare, Y-doped, and Y-PEDOT:PSS cathode materials. It is evident that the particles adopted a spherical morphology in the secondary particles, and the estimated particle diameter was about 4–5 μm. Bare and Y-doped cathode materials represented secondary particles of a similar shape; however, the PEDOT:PSS-coated cathode material showed dense secondary particles.
Fig. 2 shows the XRD patterns of the bare, Y-doped, and Y-PEDOT:PSS cathode materials. All peaks corresponded to a layered α-NaFeO2 structure of space group R-3m. However, some low intensity bands appeared after doping Y3+ ions at a high level, which is attributed to Y2O3 phase formation [14]. The lattice parameters of the Y-doped cathode material were larger compared to that of the bare cathode material. This indicates that the Y3+ ion entered into the crystal lattice. The increase in the lattice constant c was attributed to the larger ionic diameter of Y3+ (0.90 Å) than that of Ni2+ (0.69 Å) [15]. The table shows the lattice constants and ratio of the intensities of the (003) peak and (104) peak (I(003)/I(104)) to evaluate the crystal structure differences after doping. In this study, the I(003)/I(104) ratio after Y3+ doping increases, which implies that Ni ions in the lithium layer were depressed by yttrium substitution. The R-factor of the bare, Y-doped and Y-PEDOT:PSS cathode materials were 0.4583, 0.4439 and 0.4442, respectively, indicating that the Y-doped and Y-PEDOT: PSS cathode materials had good hexagonal ordering [16]. However, the values of I(003)/I(104) and R-factor hardly changed in the PEDOT:PSS-coated cathode material. This means that PEDOT:PSS coating does not affect the lattice.
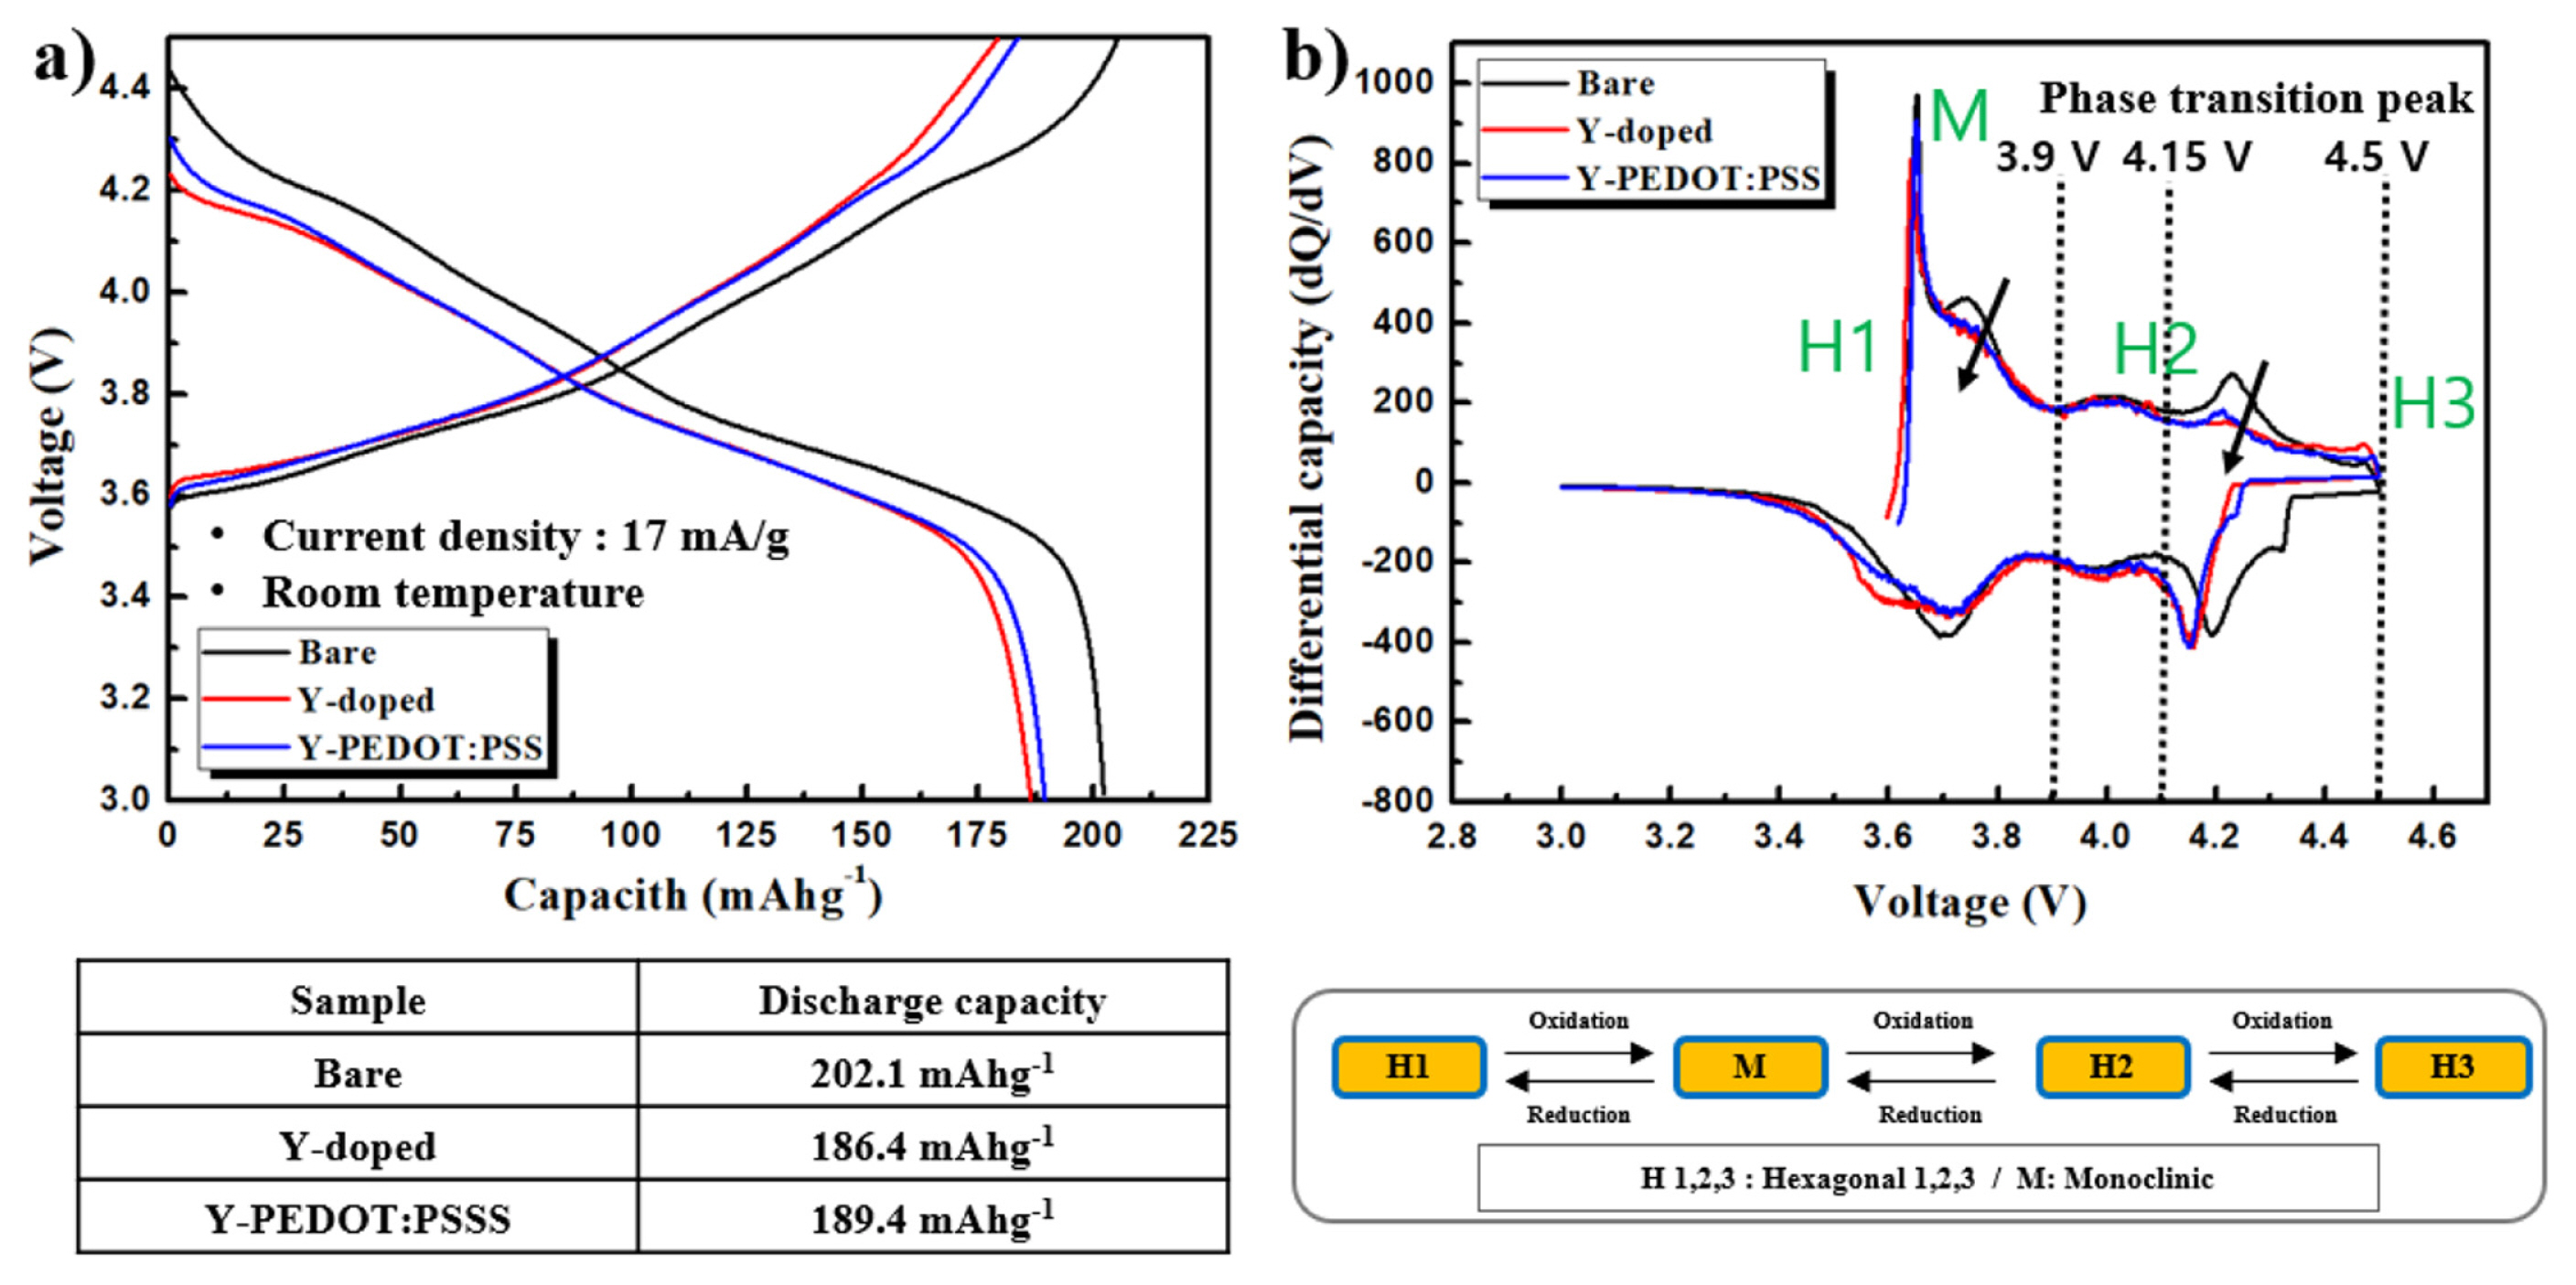
The charge–discharge curves of the bare, Y-doped, and Y-PEDOT:PSS cells were evaluated at a current density of 17 mA/g in the voltage range of 3.0–4.5 V as shown in Fig. 3. The discharge capacity of the Y-doped cathode material was slightly decreased. The electrochemically inactive Y3+ ions substitute the nickel sites; hence, the discharge capacity is reduced. However, the crystal structure is stable and improved cycle performances can be expected. To verify Li-extraction-induced phase transitions during cycling, dQ/dV profiles of both the cathode materials were obtained by differentiating the charge–discharge curves. The M ↔ H2 and H2 ↔ H3 phase transition can be attributed to the abrupt lattice shrinkage/expansion. It can be seen that the Y-doped cathode material has the phase transition suppressed by the stabilization of the crystal structure. However, the PEDOT:PSS-coated cathode material shows a graph similar to the Y-doped cathode material. This means that the coating of the conductive polymer does not affect the crystal structure.
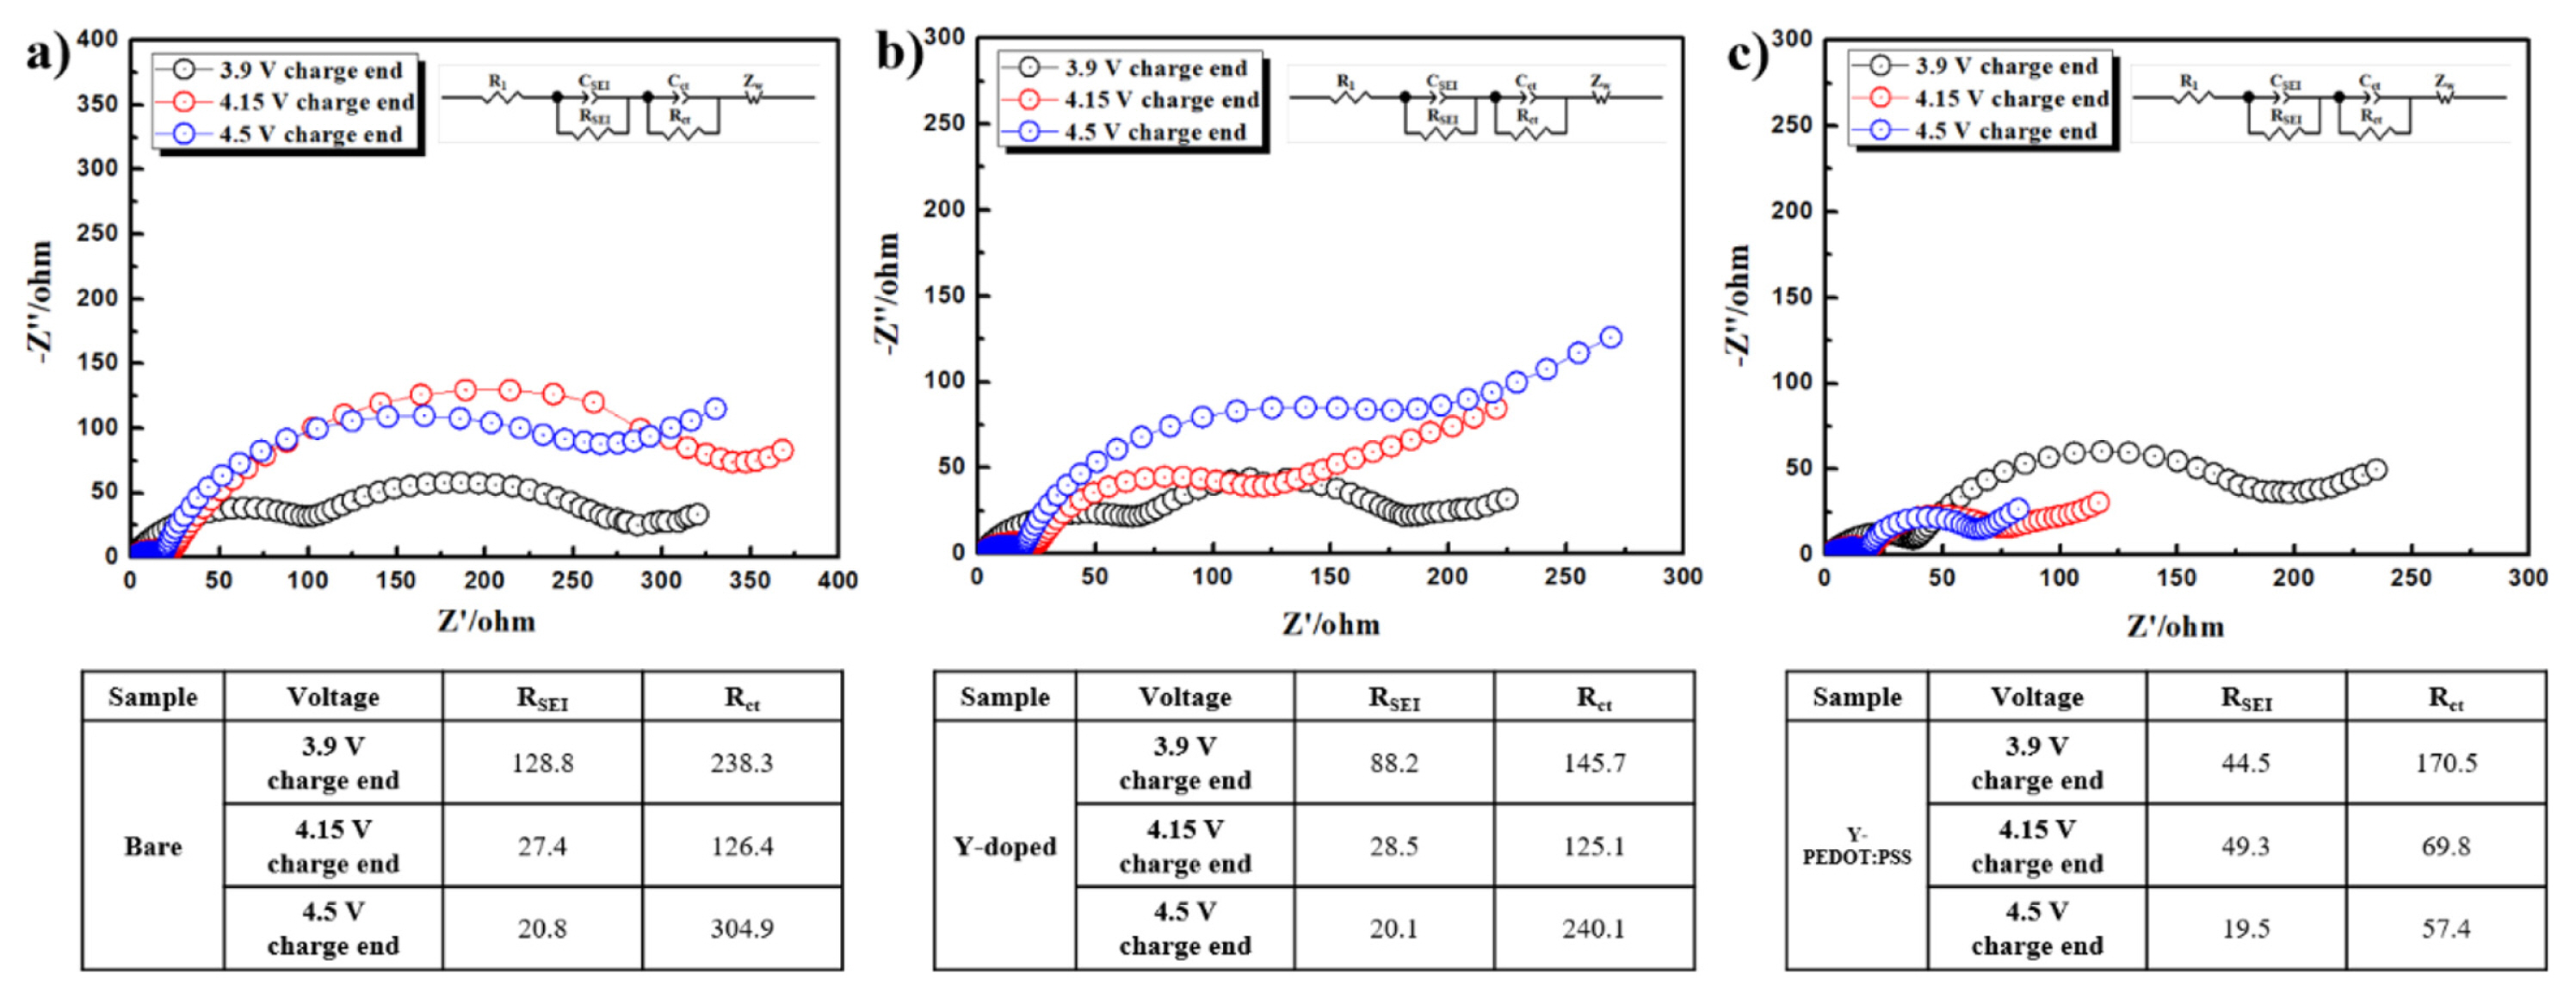
Impedance analysis was performed at 3.9, 4.15, and 4.5 V, i.e., the voltages at which phase transition occurred during the charging process in the dQ/dV plot. Fig. 5 shows the AC impedance spectrum and Nyquist plot to better demonstrate the reasons for the improved electrochemical performance of the half-cell. The electrode data show the RSEI and Rct, indicating solid electrolyte interphase resistance (RSEI) and charge transfer resistance (Rct). The semicircle at low frequencies reflects charge-transfer resistance and interfacial capacitance between the electrodes and electrolyte and the semicircle at high frequencies reflects film resistance [17]. We can obtain some information of the cathode surface during cycling from the first semicircle, which reflects film resistance. The doped and coated cathode material exhibits similar resistance over all voltage ranges compared to bare cathode material. This is because the polymer is porous and evenly coated on the surface of the positive electrode material, so that the migration of Li ions is not disturbed. It is clear from the Fig. 5 that a pronounced difference appears at the second semicircle (Rct). Doped and coated cathode materials exhibit low Rct in all voltage ranges. This reduced Rct is suggested to be due to the high electrical conductivity of PEDOT:PSS, and the migration path of Li layer widened by Y doping.
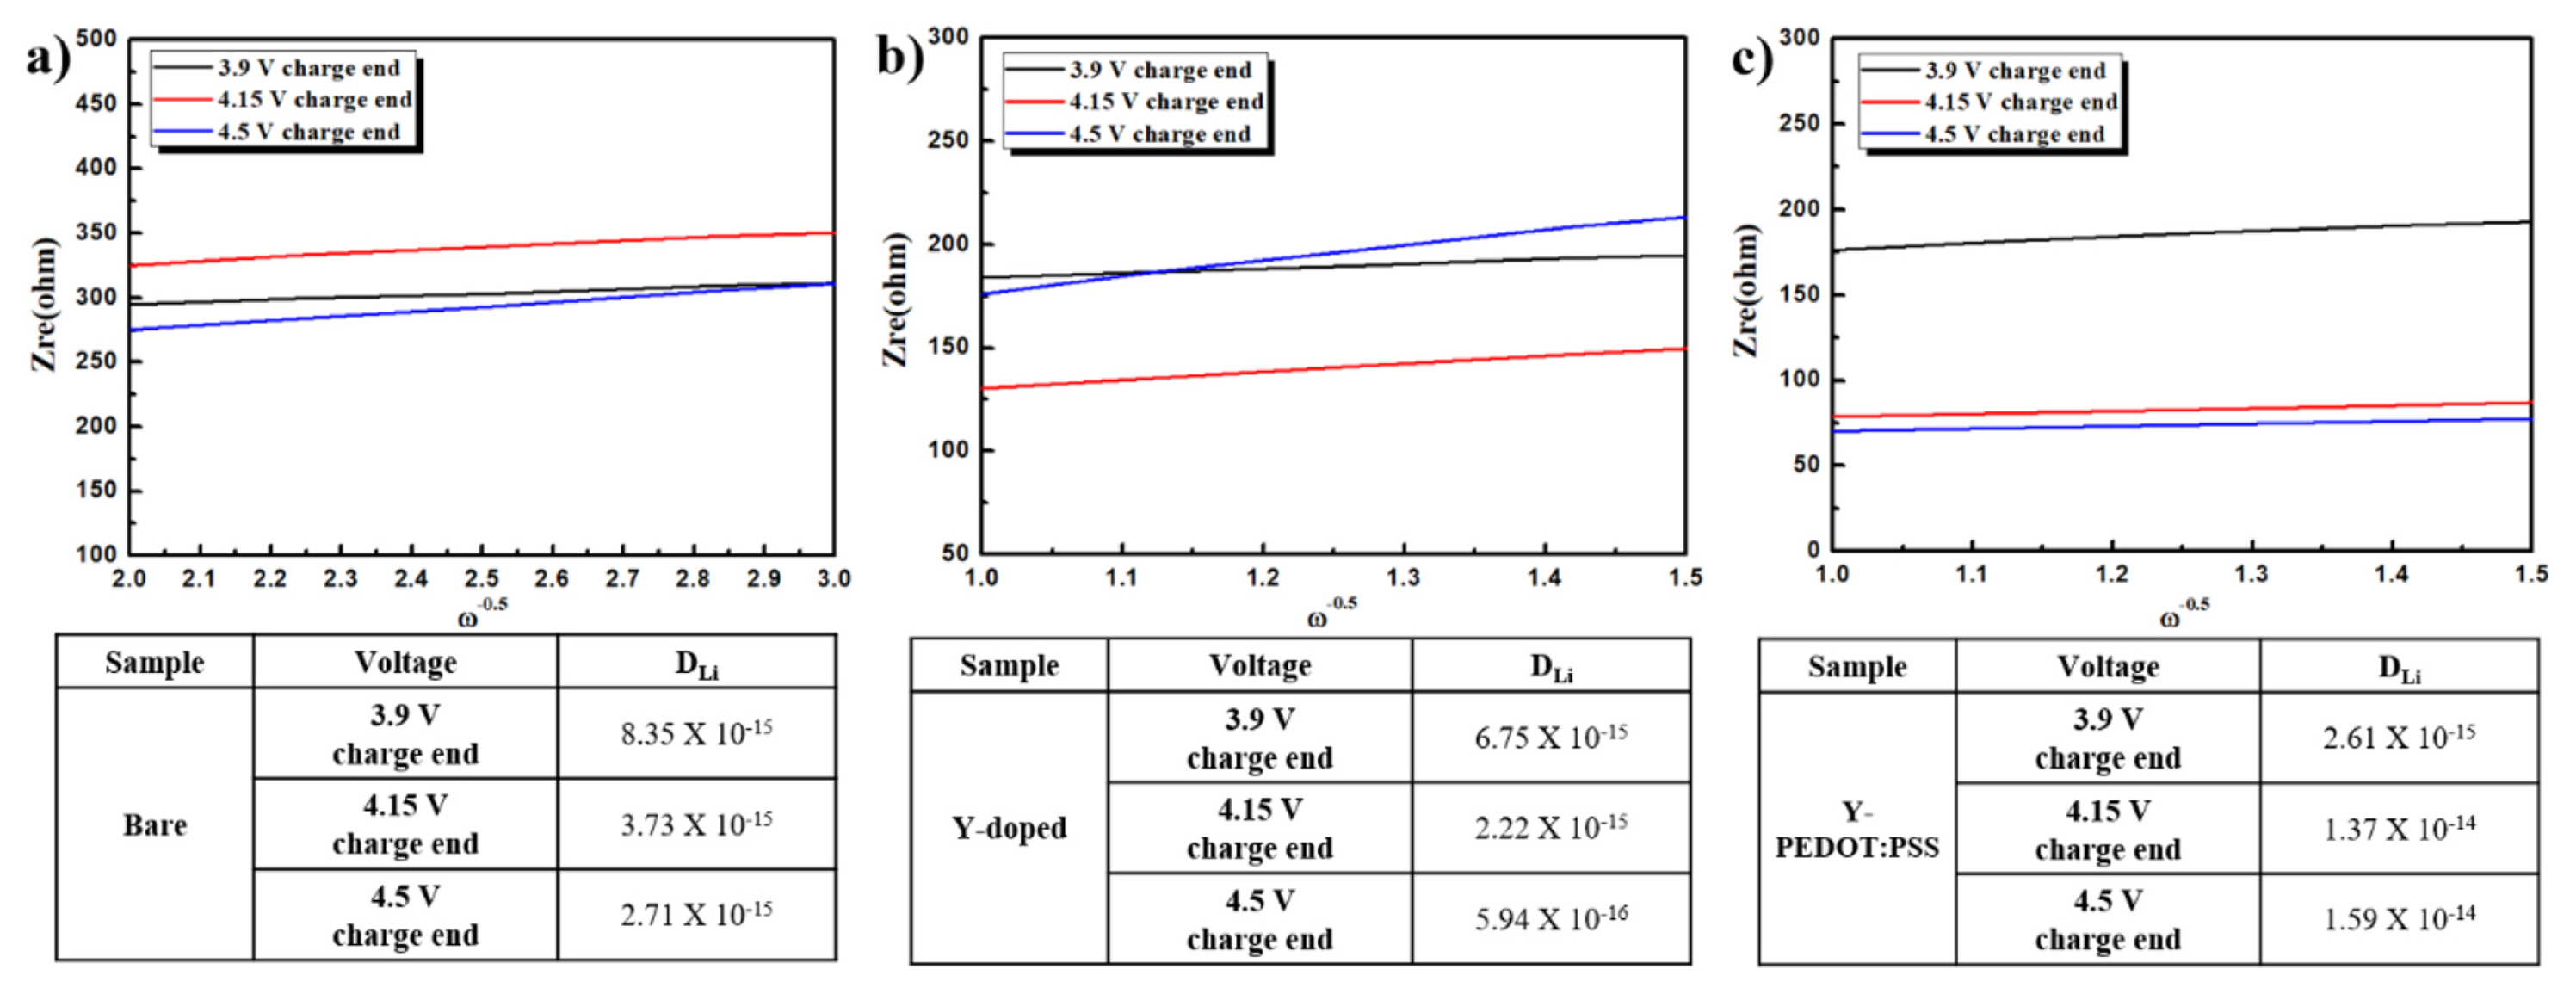
EIS can be used to calculate the lithium diffusion coefficient (DLi) using the following equations: where Rct is the charge-transfer resistance, Rs is the electrolyte resistance, ω is the angular frequency in the low frequency region, D is the diffusion coefficient, R is the gas constant, T is the absolute temperature, F is the Faraday’s constant, A is the area of the electrode surface, and C is the molar concentration of Li+ ions (mol cm−3) [18–20]. The Y-PEDOT:PSS cathode material showed the highest lithium diffusion coefficient among the three samples. It is considered that the cause of low lithium diffusion coefficient is due to many oxidation products.
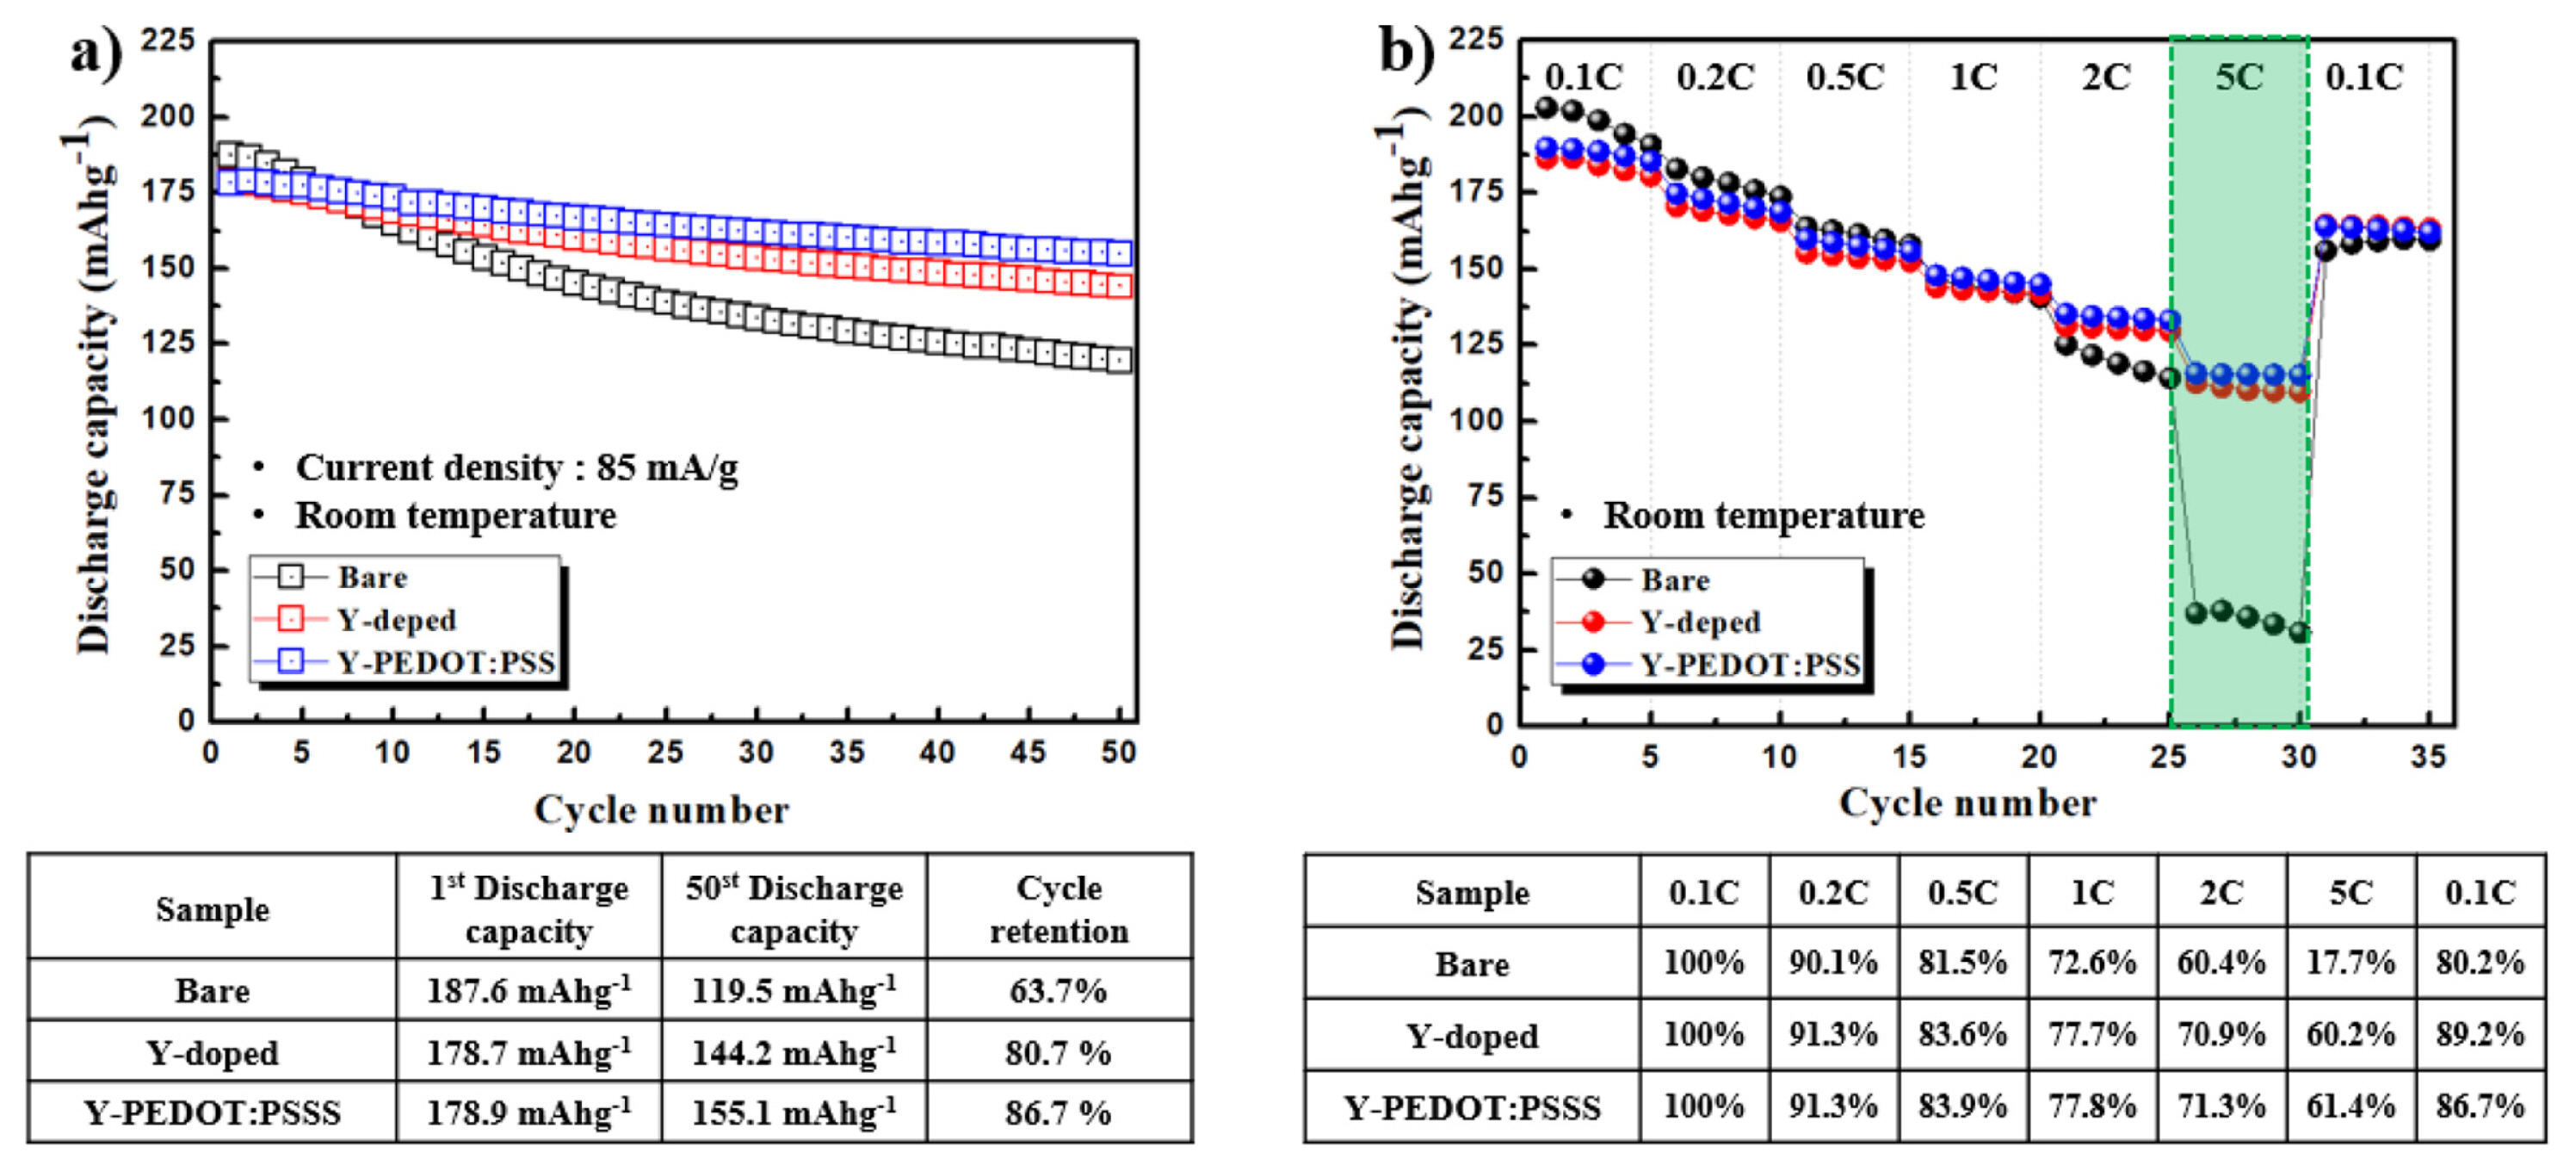
Fig. 6(a) shows the cycling performance and rate capability of the bare, Y-doped, and Y-PEDOT:PSS electrodes at room temperature. Although the cell based on LiNi0.8Co0.1Mn0.1O2 retained only 63.7 % of its initial capacity after 50 cycles, the Y-doped and Y-PEDOT:PSS electrodes showed capacity retention of 80.7 and 86.7%, respectively, at room temperature. Hence, yttrium doping stabilizes the lattice structure, and PEDOT:PSS coating suppresses the side reaction with the electrolyte and reduces the charge-transfer resistance, indicating excellent cycle characteristics.
Rate capability is one of the most important electrochemical characteristics of Li-ion batteries for electric and hybrid electric vehicles. Fig. 6(b) show that the Y-PEDOT:PSS electrode exhibited higher capacity than the bare and Y-doped electrodes at all C-rate, which further demonstrates the enhanced rate capability. The Y-doped cathode materials suggest that the pathway for Li+ to intercalate/deintercalate had been expanded, which likely occurred because the Y–O bond energy is considerably stronger than the Ni–O bond energy [21].
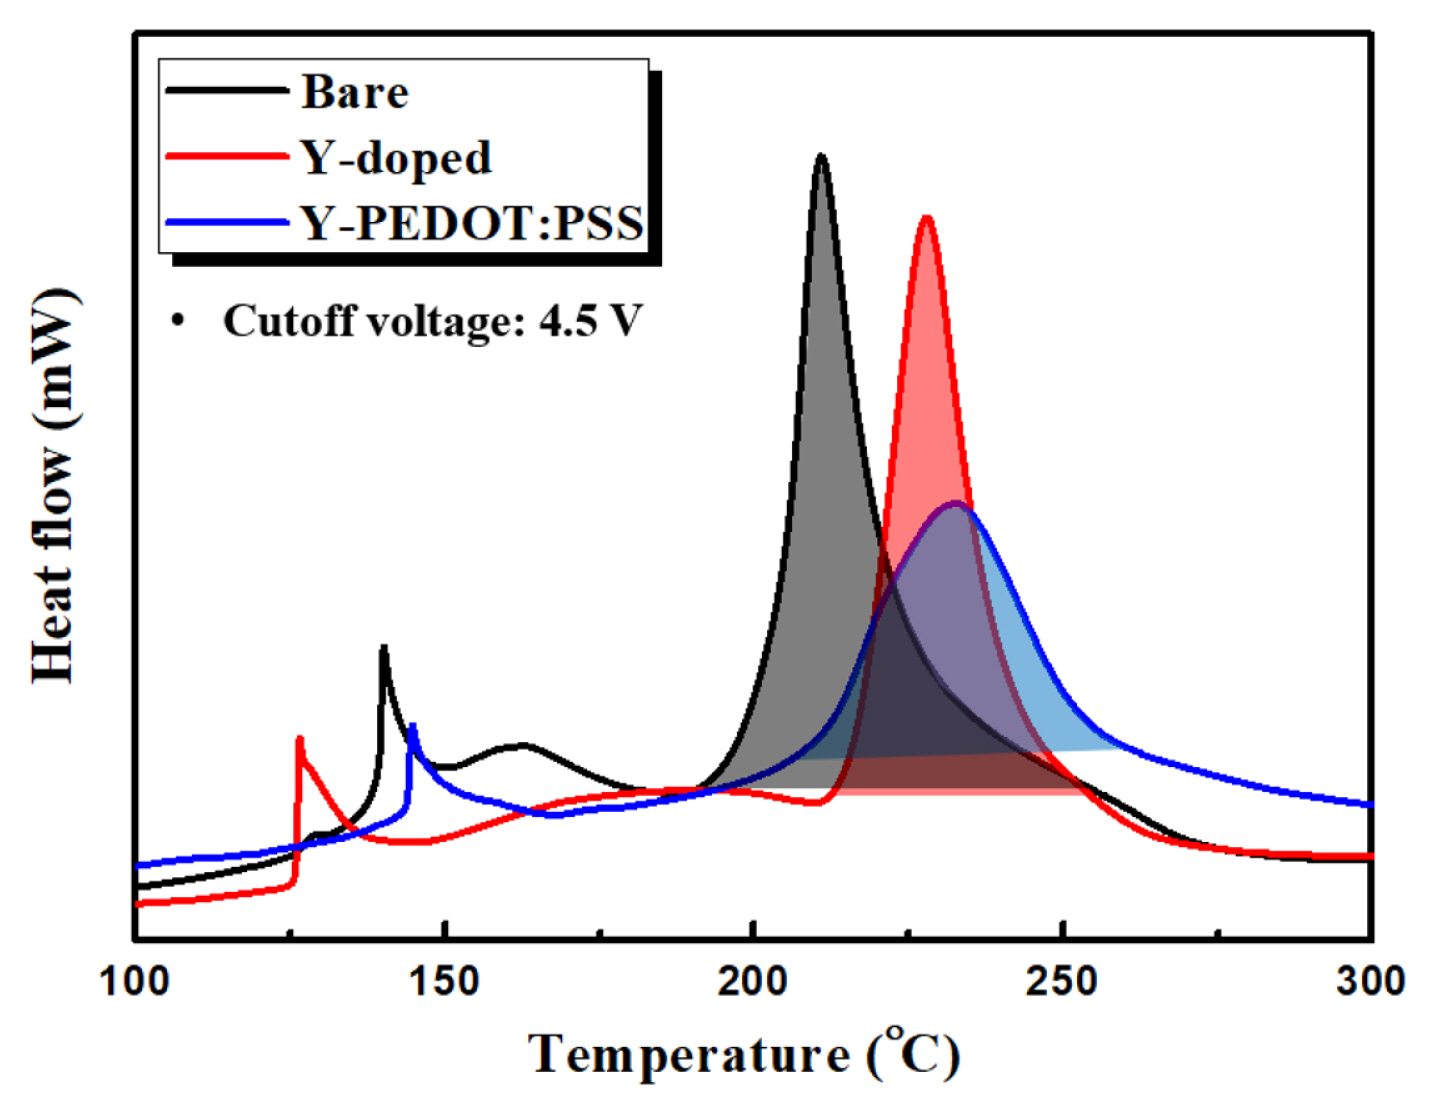
Fig. 7 shows the DSC profiles of the bare, Y-doped, and Y-PEDOT:PSS cathode materials charged to 4.5 V in the presence of a 1 M LiPF6/EC:DEC electrolyte. For the bare material, the onset temperature of the exothermic reaction peak is 210.8 °C. In contrast, the Y-doped and Y-PEDOT:PSS materials show higher onset temperatures and reduced heat generation compared to the bare cathode material. The high thermal stability of Y-PEDOT:PSS suggests that oxygen elution was suppressed due to the high binding energy between Y and oxygen, and the PEDOT:PSS coating layer effectively suppressed the exothermic reaction.
4. Conclusions
Yttrium doping and PEDOT:PSS coating display different effects on the structure and electrochemical properties of LiNi0.8Co0.1Mn0.1O2 cathode materials. Although both doping and coating improve the cycling stability of the LiNi0.8Co0.1Mn0.1O2 cathode material, the underlying mechanism of improvement is different. Suppression of lattice changes, i.e., improvement of structure stability during cycling, is attributed to the improved cycling stability of doped materials. The improvement of interface stability of coated materials during cycling is ascribed to the enhanced cycling stability of the coated materials. Combination of the two modification techniques may be a promising strategy to improve the cycling performance of cathode materials.