Introduction
The use of metal oxides in the modification of carbon electrodes applied in the development of new electroanalytical methodologies has increased in recent years, mainly due to the properties of these substances, such as their high ionic conductivity, thermal stability and chemical inertness [1]. In this context, the use of metal oxides bound with other substances has been reported to detect dyes, such as ZnO with cysteic acid for SY-TZ [2], ZnO with poly (p-aminobenzensulfonic acid) for TZ [3], and MnO2 with reduced graphene oxide [4], Dy2O3 with carbon nanotubes [5], and ZnO with reduced graphene oxide [6] for SY. In these previous reports, detection limits were observed below 0.09 ╬╝mol/L and below 0.01 ╬╝mol/L in some cases, making substances more sensitive but also more complex to manufacture. Reports for the simultaneous detection of SY-TZ are more rare, and the ╬öV value is greater than 0.1 V. In the development of electrodes modified only with metal ion oxides to detect dye colors, the use of Nd2O3 for SY-TZ [7], ZnO for SY [8] and Co3O4 for allura red [9] without being combined with other substances, such as nanomaterials, has been reported. The detection limits reported were below 0.09 ╬╝mol/L. Therefore, these reports indicate sensitivity equal to that when metal oxides are used in combination with other substances, such as those mentioned above. Lanthanum (III) oxide has not been used to detect SY-TZ but has been used to detect thimerosal combined only with carbon paste [10]. Combinations with other substances, such as carbon nanotubes and graphene, have been used to detect biological substances [11,12] and pharmacological substances [13ŌĆō15]. These reports are evidence of the great versatility of La2O3 in the modification of electrodes applied to detect different analytes, in this case, dyes. The use of TiO2 to detect TZ-SY without other substances has not been reported, but TiO2 combined with graphene was reported to detect SY-TZ with a detection limit below 0.009 ╬╝mol/L with carbon paste [16] and glassy carbon [17]. The authors indicated that the great sensitivity was due to the high accumulation effect and great catalytic capability of graphene and mesoporous TiO2. This new method may achieve the same effect simply by omitting the accumulation effect that should have been the product of the presence of graphene but providing a simpler electrode. Moreover, the combined use of La and Ti from the synthesis of different ligands has been employed for the electrochemical detection of nitrite [1]. The authors indicated that the high sensitivity below 0.09 ╬╝mol/L was due to the larger pore size found at the higher sintering temperature and pH, which presents a good development at high temperatures of 70┬░C [18]. One of the few reports where combined metal oxides were used to detect SY-TZ used Fe and Si [19], but combined with carbon nanotubes, where the authors achieved a detection limit of less than 0.09 ╬╝mol/L, very close to the detection limit reported in this study. The reason for studying these dyes in foods is the same reason that motivated the studies reported above. These substances are used commonly in almost all foods to improve their appearance and stability. However, they can negatively affect peopleŌĆÖs health, especially childrenŌĆÖs health, when they are consumed frequently and are a potential cause of attention-deficit/hyperactivity disorder (ADHD). [20]. Many reports have been developed in recent years to detect SY and TZ using different techniques such as spectrocopy and chromatographic techniques coupled to UV/Vis detectors [21,22]. These studies have reported great sensitivity, but they have the disadvantage of the high cost of instruments and sample treatment.
On the other hand, electroanalytical techniques have been a great equally sensitive alternative but with the advantage of having a low cost. Furthermore, it is a very versatile technique used to detect different types of analytes using modified electrodes such as biological substances, for example dopamine, ascorbic acid, uric acid, folic acid, guanine and glucose [23ŌĆō27]. Also, medicaments and compounds such as ranitidine and metronidazole [28], nitric oxide [29] and hydrogen peroxide [30].
The aim and novelty of this work are justified based on the few reports describing methodologies to detect SY-TZ using simple and inexpensive electrodes.
2. Experimental
2.1 Reagents and instruments
La2O3-TiO2, the dyes TZ-SY and others such as allura red (AR), amaranth (AM) and ponceau 4-R (PR), were obtained from Sigma-Aldrich. Only twenty milliliters of standard solutions at 1.0 mmol/L and 0.1 mmol/L TZ-SY were used throughout the study. Type A water (ultrapure) was obtained from a Wasselab ASTM D1193 purifier system. Phosphate buffer solution (PBS), borate buffer solution (BBS) and acetate buffer solution (ABS) were used as the electrolytes at pH values of 2.0ŌĆō7.0, 10.0 and 4.0, respectively. An Autolab PGSTAT204 potentiostat/galvanostat from Metrohm (Switzerland) was used to perform CV and square wave voltammetry (SWV). An OrionŌĆō430 digital pH/mV meter equipped with a combined pH glass electrode was used for pH measurements.
2.2 Microcomposite preparation with LaO3-TiO2
Three working electrodes based on a carbon paste powder were prepared following an order previously reported only for La2O3 [10]. First, an unmodified carbon paste electrode (PCE) using 50.0 mg of graphite powder and 20 ╬╝L of paraffin oil. Second, a modified carbon paste electrode using 50.0 mg of graphite powder with 5.0 mg of TiO2 (TiOX/CPE) and 20 ╬╝L of paraffin oil. Third, a modified carbon paste electrode using 50.0 mg of graphite powder with 10.0 mg (1:1) of La2O3-TiO2 (La-TiOX/CPE) and 20 ╬╝L of paraffin oil. All the electrodes were compacted and supported inside a PVC cylinder with a copper wire for the electrical contact. The fresh surfaces were cleaned to obtain a smooth-looking surface. The same electrode was used several times only by removing excess adsorbed material after a series of measurements. The optimal amount of metals oxides was 5.0 mg, with 50.0 mg of carbon powder for all the electrodes that were prepared in this work.
2.3 Sample preparation
The samples were obtained from a supermarket in the city of Lima, Per├║. Many of these samples contained the simultaneous presence of SY-TZ, while others contained only SY and were of a complex matrix since they contained other substances, such as protein, ascorbic acid, carboxymethylcellulose, citric acid, fumaric acid, sodium citrate aspartame and sugar. Solid samples, such as orange juice powder, were weighed and diluted 10 times with ultrapure water. Liquid samples, such as orange juice and mandarin isotonic drink, were not diluted before the analysis, and an aliquot of 50.0 ╬╝L was enough to observe the anodic peak currents. No pretreatment to eliminate possible interference was necessary before each analysis.
2.4 Measurement procedure
The electrochemical measurements were developed by CV and square wave voltammetry (SWV) with a cell that contained 9.5 mL of ultrapure water, 0.50 ml of 0.10 mol/L electrolyte solution (PBS, BBS and ABS) and 100 ╬╝L of 1.0 mmol/L TZ-SY at 0.1 V/s by CV and between 10.0 and 100.0 ╬╝L of 0.1 mmol/L TZ-SY by an SWV technique with a frequency of 10 Hz and a pulse amplitude of 0.05 V at 0.0 V for 10 s.
3. Results and Discussion
3.1 Electrochemical characterization using K4Fe(CN)6 by CV and SY-TZ activity by SWAdV on the carbon paste electrode decorated with TiO2 and La2O3-TiO2
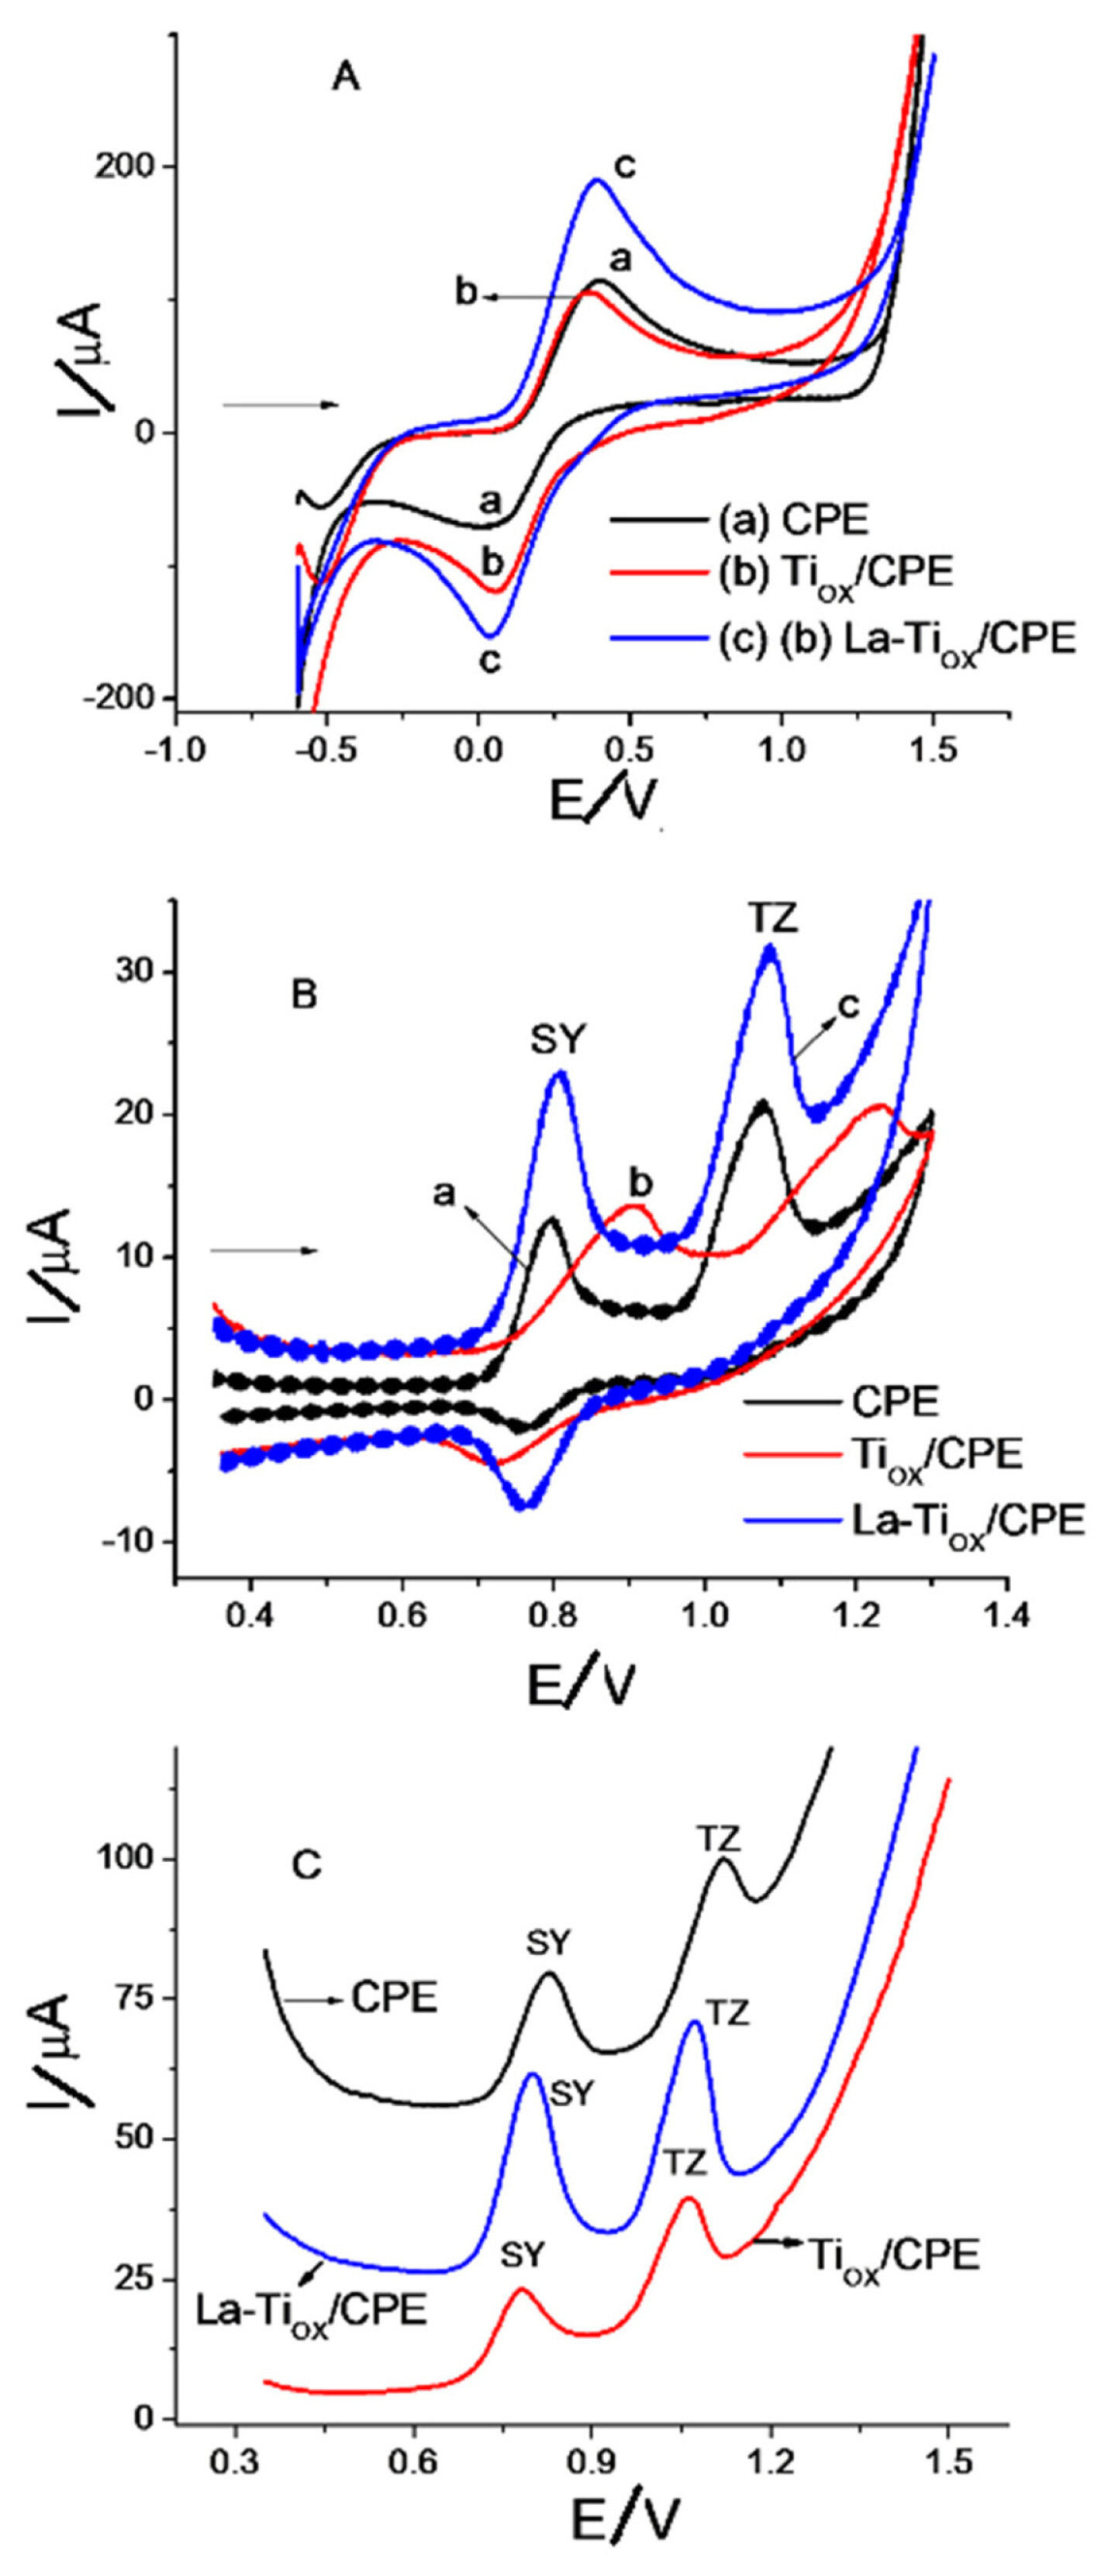
The electroactive properties of the bioxide composite (La-TiOX/CPE) were evaluated by CV using K4Fe(CN)6 in 10.0 mmol/L KCl as a model electrolyte (Fig. 1A) and 10.0 ╬╝mol/L SY-TZ (Fig. 1BŌĆōC) on CPE (curve a), TiOX/CPE (curve b) and La-TiOX/CPE (curve c) by CV and SWAdV. Before beginning to describe the results of this section (Fig. 1), the authors confirmed that redox processes attributed to the metal oxides deposited on the carbon paste surface were not observed at potential values between 0.0 and 1.5 V.
On the other hand, carbon paste electrode modified only with La2O3 (LaOX/CPE) did not show significant activity with the dyes. Therefore, no curves are shown in this report using this electrode. The results clearly showed that the potential values were not affected by the presence of the oxides. Therefore, we cannot confirm an electrocatalytic process. On the other hand, the anodic and cathodic peak current values for the Fe3+/Fe2+ redox system were higher and the ╬öIp (╬╝A) was lower with La-TiOX/CPE (Fig. 1A curve c), making the systems less quasi-reversible. Previous studies confirmed the effect that La2O3 has on the Fe3+/Fe2+ redox system, with an anodic peak current at 0.4 V and an intensity current close to 350.0 ╬╝A [10]. In this case, the presence of La2O3-TiO2 allows the redox process to occur at potential values less than 0.4 V, but with a considerable decrease in the anodic current, which was 191 ╬╝A. Moreover, with other oxides, such as Co, signal values greater than 0.5 V were reported [9]. It should be concluded that the presence of TiO2 decreases the effect that La2O3 has on the Fe3+/Fe2+ system, as previously reported [10], but increases the activity on SY-TZ (Fig. 1BŌĆōC), with La-TiOX/CPE (curve c blue color) on the anodic peak currents of SY-TZ is clearly observed. These values were increased almost 50% by CV and SWV. On the other hand, the potential values did not show changes in response to CV but in response to SWV, and the oxidation of SY-TZ happened at less positive potential values. These results indicate that the presence of La2O3-TiO2 on the surface of the electrode increases the rate of charge transfer and decreases the energy needed to oxidize SY-TZ, possibly due to the previously reported properties of these oxides such as increasing the superficial area and the formation of electrostatic interactions [1,7]. The current and potential values observed with the three electrodes by SWV are summarized in Table 1. It is clearly observed that the highest anodic peak current for SY-TZ was with the La-TiOX/CPE microcomposite, while the lowest current was with TiOX/CPE. Therefore, the composite was used in subsequent analyses because it presented greater activity in the electrochemical oxidation of SY-TZ. The potential values observed in this work were very similar to those in previous reports where Zn [6] and Ti [16] oxides were used. Conversely, a lower value of considerable potential with a ╬öV higher for SY-TZ was with Dy2O3 [5].
3.2 Study of significant variables that improve the sensitivity and stability of the new method with La-TiOX/CPE: pH and mass transfer
The pH effect was studied in order to identify the optimum pH of the highest anodic current and obtain a higher slope value in the development of a calibration curve, and the mass transferences were studied as a function of the scan rate with the objective of identifying a diffusive process that has a smaller memory effect on electrode surface and greater reproducibility between measurements or, in contrast, an adsorptive process. These processes have been extensively studied with other modified electrodes where the anodic current generally changes to less positive potential values with an increase in pH, with slope values of almost half the theoretical value of 0.059 pH, which indicates that protons are involved in the process in a 1H+:1eŌłÆ ratio [16,31,32]. In contrast, diffusion-controlled processes have been reported with carbon paste, glassy carbon and screen-printed electrode carbon electrodes [3,16,31,33] and controlled by adsorption processes with vitreous carbon-based electrodes [5].
In this report, pH was varied between 2.0 and 10.0. The maximum anodic peak currents were observed at pH values of 2.0 and 7.0 with PBS. With other electrolyte supports, such as BBS and ABS, the anodic peak currents were lower (Fig. 2A). On the other hand, the shift in the potential was the same as that mentioned in previous reports [16,31,32]. The anodic peak shifted to a less positive potential value with a pH increase for SY-TZ with a regression equation of Ip(╬╝A) = 0.877+ 0.033pH for SY and Ip(╬╝A) = 1.167+0.038pH for TZ (Fig. 2B). The slope values of 0.033 and 0.038 V/pH obtained for SY-TZ are almost half the value of the theoretical Nernst constant of 0.059 V/pH, implying that in this process, one electron is transferred. A pH of 2.0 (PBS) was chosen for further analysis. SY-TZ mass transfer depends on whether the material can be diffused or adsorbed [3,5]. In this report, the mass transfer of SY-TZ was studied on La-TiOX/CPE between scan rates (╬Į) of 0.01 and 0.11 V/s to verify stability because in adsorptive processes, memory signals can be originated on the electrode due to substances that enter the internal structure of the sensor and that do not easily desorb, which affects its stability and do not allow it to be used in more than one measurement; thus, the anodic peak current values were plotted as a function of the square root of the scan rate (Fig. 2C), with a regression equation of Ip(╬╝A) = ŌłÆ9.13+130.37╬Į┬Į for SY and Ip(╬╝A) = ŌłÆ5.36+79.27╬Į┬Į for TZ. The two line equations presented correlation coefficients (R2) of 0.989 and 0.998 for SY-TZ, respectively, which are close to 1.0, indicating a linear trend. On the other hand, for the plot of logIp (╬╝A) vs log╬Į (not shown) for SY-TZ, the slope values were close to the theoretical value of 0.5. These results indicate that the process is predominantly controlled by diffusion. However, the diffusion process allows only a small amount of variation (less than 1.5% of the anodic current value) for 50 consecutive cycles by CV using 10.0 ╬╝mol/L SY-TZ (Fig. 2D). This indicates a decrease in the anodic peak current of 0.03% for each cycle. Therefore, the sensor can be used for a long time without considerable loss of activity.
3.3 Detection limit and accuracy
All optimized parameters related to sensitivity, such as pH, amounts of La2O3 and TiO2, frequency (HZ), amplitude potential (AE), accumulation time (tACC) and accumulation potential (EACC), were similar for the SY-TZ pair; only EACC was different. At a value of 0.0 V, the anodic peak current for SY was higher than that for TZ, and at a value of ŌłÆ0.1 V, the anodic peak current for TZ was higher than that for SY. Therefore, the calibration curves were developed with the following parameters: pH of 2.0, tACC of 10.0 s, frequency of 10 Hz and potential amplitude of 0.05 V for SY-TZ but an EACC of 0.0 V for SY and ŌłÆ0.1 V for TZ. Voltammogram and calibration curves (inset) obtained by SWV with SY-TZ between 0.26 and 4.5 ╬╝mol/L are shown in Fig. 3. Under these conditions, a linear relationship between concentration (╬╝mol/L) and current (╬╝A) was obtained, with a regression equation of Ip(╬╝A) = 1.76 + 8.70CSY with an R2 of 0.98 for SY in the presence of 2.0 ╬╝mol/L TZ (inset Fig. 3A) and Ip(╬╝A) = 0.10 + 4.10CTZ with an R2 of 0.99 for TZ in the presence of 2.0 ╬╝mol/L SY (inset Fig. 3B). The detection limits obtained (3 Žā/m) were 0.02 and 0.03 for SY-TZ. The results show that the slope value reported for SY was higher than the value reported for TZ, but the detection limit was lower for SY due to its smaller intercept and R2 value. It is possible that TZ has more activity on the microcomposite surface at low concentrations or competition effect on adsorption.
On the other hand, the lowest concentration for dyes was 0.26 ╬╝mol/L in the calibration curve and with this value a well defined signal was observed in Fig. 3AŌĆōB and it differs greatly from the background current. Therefore, if the concentration is lowered further, the signal will be observed. Normally with these conditions the detection limit can give up to 10 units lower compared to the lower concentration standard [24].
The versatility of the new method was compared with that in previous reports (as shown in Table 2) using electrodes modified with other metal ion oxides and substances with a higher sensitivity but that are more complex to manufacture and more expensive. In this context, this new method is equally sensitive and convenient due to its easy development. Food samples contain increased amounts of SY-TZ compared to the limit of detection obtained with this new method.
3.4 Validation and possible interferences of the new method
The method was validated on the basis of the relative error (RE) with samples developed with nonflavored gelatin spiked with known amounts of SY-TZ. This matrix was chosen because it is complex and very similar to a real sample that contains a protein percentage of almost 12%, which is useful for assessing the stability of the sensor against interfering substances. The determination was carried out using the standard addition method (n=3). The obtained values for nonflavored gelatin sample 1 (additions of TZ-SY 0.40 ╬╝mol/L or real date (RD)) were 0.35┬▒0.05 and 0.45┬▒0.04 (experimental date (ED)) for SY-TZ, respectively, with RE (obtained as ED-RD/RD*100) values of ŌłÆ12.5 for TZ and ŌłÆ12ŌĆō5% for SY with a regression equation of Ip(╬╝A) = 1.54 + 5.80CSY and Ip(╬╝A) = 1.43 + 5.65CTZ. respectively. The values obtained for nonflavored gelatin sample 2 (additions of TZ-SY 0.60 ╬╝mol/L ED) were 0.65┬▒0.02 and 0.67┬▒0.04 ╬╝mol/L for SY-TZ, respectively, with RE values of 8.30 and 11.6% for SY-TZ, respectively with a regression equation of Ip(╬╝A) = 2.16 + 6.65CSY and Ip(╬╝A) = 2.30 + 6.90Ctz. Fig 3C shows voltammograms for sample 2. The nonflavored gelatin matrix did not affect the stability of the sensor, although anodic peak currents for SY-TZ were observed at more positive potentials. In the sample with the lowest concentration, the error was negative, indicating that only random errors occurred.
The new microcomposite showed activity towards several substances at values of potential between 0.0 and 1.5 V, such as uric acid, dopamine, flavonoids and paracetamol. Fortunately, these substances do not coexist within the foods analyzed in this study. On the other hand, ascorbic acid, which was present in the analyzed sample, did not show activity with the microcomposite. The potential interfering substances observed in this new method include other dyes, such as allura red (AR), amaranth (AM) and ponceau 4-R (PR). These dyes interfere with the SY signal because they oxidize at near potential values of 0.8 V. Therefore, the analyzed samples should not contain these dyes. This effect is shown in Fig. 3D.
3.5 Analysis of real samples
The usefulness of the new method was evaluated with synthetic orange juice, orange juice powder and tropical fruit isotonic drink. The solid samples were weighed and dissolved in 50 mL of ultrapure water. Liquid samples were analyzed undiluted. The results are summarized in Table 3, with their respective standard deviations and slope values. The slope values decreased considerably for SY-TZ compared with the calibration curves, indicating that this more complex matrix affects mass transfer. These detected values were very similar to those in previous reports for SY-TZ using modified electrodes [3,16,33].
4. Conclusions
This report presents a new application of combined metal oxides. This method was simple to perform, sensitive, environmentally friendly and versatile, with different types of real samples for simultaneous SY-TZ analysis. This new method is more convenient compared to other non-electroanalytical techniques because they reduce the cost of analysis of each sample and time of the measurement. The detection limit was below 0.09 ╬╝mol/L. Another great advantage of this new method is elimination of the treatment of the sample prior to its analysis with filtration or extraction processes. A considerable disadvantage of the method is the possible interference of other dyes, such as AR, PR and AM. However, this method can be used for many foods containing SY-TZ in the absence of other red dyes. On the other hand, it was possible to improve the activity of TiO2 that has only been improved with graphene and other more complex nano structures.