J. Electrochem. Sci. Technol Search

CLOSE


J. Electrochem. Sci. Technol > Volume 11(4); 2020 > Article
Wu, Tan, Wang, Xu, Liu, Feng, and Yin: Enhancing Effects of NaHSO3 on Corrosion of T91 Steel

Abstract

In the paper, corrosion behavior of T91 steel in different concentrations of NaHSO3 solution was studied in combination with scanning electron microscope (SEM) and electrochemical measurements. The results showed that the steel exhibited active anodic dissolution characteristics in the solution, and NaHSO3 concentration affected both cathodic and anodic behaviors. The steel surface was covered by intact corrosion products in the solutions, but the compactness and mechanical properties of the corrosion products degraded with the increase of NaHSO3 concentration. In low-concentration NaHSO3 solution the steel tended to undergo uniform corrosion with slight corrosion pits, but its corrosion mode gradually transited to localized corrosion as the NaHSO3 concentration increased. The mechanical property degradation of the corrosion products caused by sulfur compounds and the pH decrease of the solution are the important factors to accelerating its corrosion process.

1. Introduction

In recent years, acid rain has become a global environmental issue. Europe, North America and China are the three largest acid rain regions. The acid rain in China is mainly distributed in south of the Yangtze River. Its main type is sulfuric acid rain, and SO2 emission from industrial manufacture is its main reason [1]. Acid rain is one of the important reasons of metal corrosion in atmospheric environment. The economic loss caused by acid rain corrosion throughout the world reached 20 billion US dollars in 1999, and the according loss in China also reached 3 billion RMB [2].
Many scholars have conducted a lot of researches on acid rain corrosion of metals [3]. It has become a common belief that acid rain promotes the decomposition of natural stones [4], causing damages to cultural heritage (especially outdoor marble and bronze sculptures) [5]. Acid rain can enhance the corrosion rate of rebars in concrete, leading to a significant decrease of yield strength and elastic modulus [6,7]. Shi et al. [8] found that the cathodic reaction of 2024-T3 aluminum alloy in acid rain environment is mainly the reduction of hydrogen ions, and its corrosion rate increases in low-pH solution. The high activity and migration rate of hydrogen ions in acidic solutions are the main reasons for the accelerated corrosion [8]. AZ91 magnesium alloy experience uniform corrosion in acid rain environments and the corrosion mainly occurs in its α phase, while its β phase shows a passive characteristic [9]. The corrosion process of AZ31 magnesium alloy in acid rain environment is jointly controlled by anodic dissolution and hydrogen ion reduction, and pitting corrosion occurs around the AlMn phase near grain boundary [10]. Varvara et al. [11] indicated that Horse-chestnut ethanolic extract has a good inhibition role in acid rain corrosion of copper, and the inhibition role stems from the stable physical adsorption layer forming on the copper surface. Rotaru et al. [12] confirmed that some antibiotics own the similar inhibition effect of the Horse-chestnut ethanolic extract, and it is related to the parameters of the energy and energy gap of organic molecules.
T91 steel has been selected as one of the main heat-resistant materials and replacement materials of steam pipe [13], and widely used in power stations. The steel is subjected to atmospheric corrosion during the storage and service before its service, and some scholars have studied its atmospheric corrosion behavior [1416]. Zhang et al. [17] verified that seasonal acid rain and severe atmospheric contamination due to heavy industries induced localized corrosion on internal and external surfaces of T91 steel after stored for only one year. Yu et al. [18] found that H+ and Cl can attack the passive film of T92 steel and promote its corrosion process. However, there is a lack of the studies on corrosion behavior of T91 steel in acid rain environment. In this paper, the electrochemical measurements and scanning electron microscope (SEM) were jointly used to study the corrosion behavior of T91 steel in different concentrations of NaHSO3 solution (to simulating acid rain), and the pH effect on corrosion behavior was discussed.

2. Experimental

2.1 Materials

The material used in this work is T91 steel. Its chemical compositions are as follows (wt.%): C 0.08, Mn 0.30, Si 0.20, S < 0.010, P < 0.020, Cr 8.00~9.50, Ni < 0.40, Mo 0.85, Nb 0.06~0.10, V 0.18, N 0.03, Fe balance. The material was processed into a size of 10 mm × 10 mm × 3 mm, and then sealed with epoxy resin to expose an area of 10 mm × 10 mm for electrochemical measurements. According to the national standard GB5776-86, the working surfaces of the specimens were polished into a mirror using a series of waterproof abrasive papers, and cleaned with acetone and alcohol in sequence. After that, the specimens were stored in a desiccator for use.
The experimental solution used in this work is a series of NaHSO3 solutions with different concentrations, with concentrations and corresponding pH values showing in Table 1. It can be seen that the pH of the solutions are between 4.1 and 5.1, which are suitable for simulating the moderate acid rains.

2.2 Electrochemical measurements

In the experiment, electrochemical impedance spectroscopy (EIS) and Tafel polarization were used to study the electrochemical performance of T91 steel in the solutions. All electrochemical measurements were performed in a classic three-electrode system, with a saturated calomel electrode (SCE) as a reference electrode, a platinum electrode as an auxiliary electrode, and a T91 specimen as a working electrode. All measurements were performed on a CS350 electrochemical test system produced by Wuhan Coster Equipment Co., Ltd. The frequency range of EIS measurement was from 100 kHz to 10 mHz, and the excitation signal was a sine wave voltage signal with an amplitude of 10 mV. The EIS results were modeled and fitted by a ZSimpWin software. The scanning range of Tafel polarization curve was ± 250 mV vs. open circuit potential (OCP), and its scan rate was 0.25 mV s−1. The experimental results were simulated by Origin software package. The EIS and Tafel polarization tests in this experiment were repeated once, and the average value or typical value was written into the paper. The potentials reported in the paper were all relative to SCE.

2.3 Analysis of corrosion products

After immersed for 504 hours, the specimens were taken out from the solutions, washed with absolute ethanol for 10 minutes, dried with cold air, and stored in a vacuum desiccator. The morphologies and compositions of the corrosion products on the steel surfaces were analyzed by a SEM (JSM-6360LV) with an energy disperse spectroscopy (EDS, NECA 250). After that, the surface corrosion products were removed by the rust remover to expose the corrosion morphologies, and the steel surface were observed again by the SEM. The rust remover used is composed of 500 ml hydrochloric acid (37 wt.%) + 500 mL deionized water + 3.6 g hexamethylenetetramine.

3. Results

3.1 SEM/EDS analysis of corrosion products

Fig. 1 shows SEM micrographs of corrosion products on the steel surface after 504 h immersion in the NaHSO3 solutions, and the corresponding EDS results are listed in Table 2. After immersed in 0.01% NaHSO3 solution for 504 h, the steel surface has been completely covered with dense corrosion products (Fig. 1a), and there are obvious cracks in the inner layer of the corrosion products (Fig. 1b), which may stem from the dehydration process during the post-treatment of the specimens. The color of the corrosion products in this layer is deep, containing elements such as O, Fe, Cr and S (Table 2), and its main components are oxides and sulfides of iron and chromium. The outer layer of the corrosion product is composed of some light-color materials, with the similar main components as the inner layer, but its oxidation content is slightly higher than the later. As for in 0.1% NaHSO3 solution, the corrosion products have completely covered the steel surface and cracked (Fig. 1c). Compared with the corrosion products in 0.01% NaHSO3 solution, the number and width of the cracks in the corrosion products are increased (Fig. 1c), indicating that the mechanical properties of the corrosion products are poorer than the former. A layer of mantle like materials is distributed on the corrosion products (Fig. 1d), and it is composed of oxides and sulfides of iron and chromium (Table 2). When the NaHSO3 concentration increased to 1.0%, massive cracks appears in the corrosion products, and some corrosion products fall off from the steel surface, which indicates that the mechanical properties of the corrosion products are the worst in the 1.0% NaHSO3 solution (Fig. 1e). Intact granular corrosion products exist in the cracks and the fall-off region (Fig. 1f). The composition of granular corrosion products is close to other corrosion products on the surface, with high contents of chromium and sulfur (Table 2).
The above results show that after immersed in NaHSO3 solutions for 504 h, complete corrosion products with high contents of chromium and sulfur generate on the steel surface. The compactness and mechanical properties of corrosion products decreases with the concentration increase of NaHSO3 in the solutions.

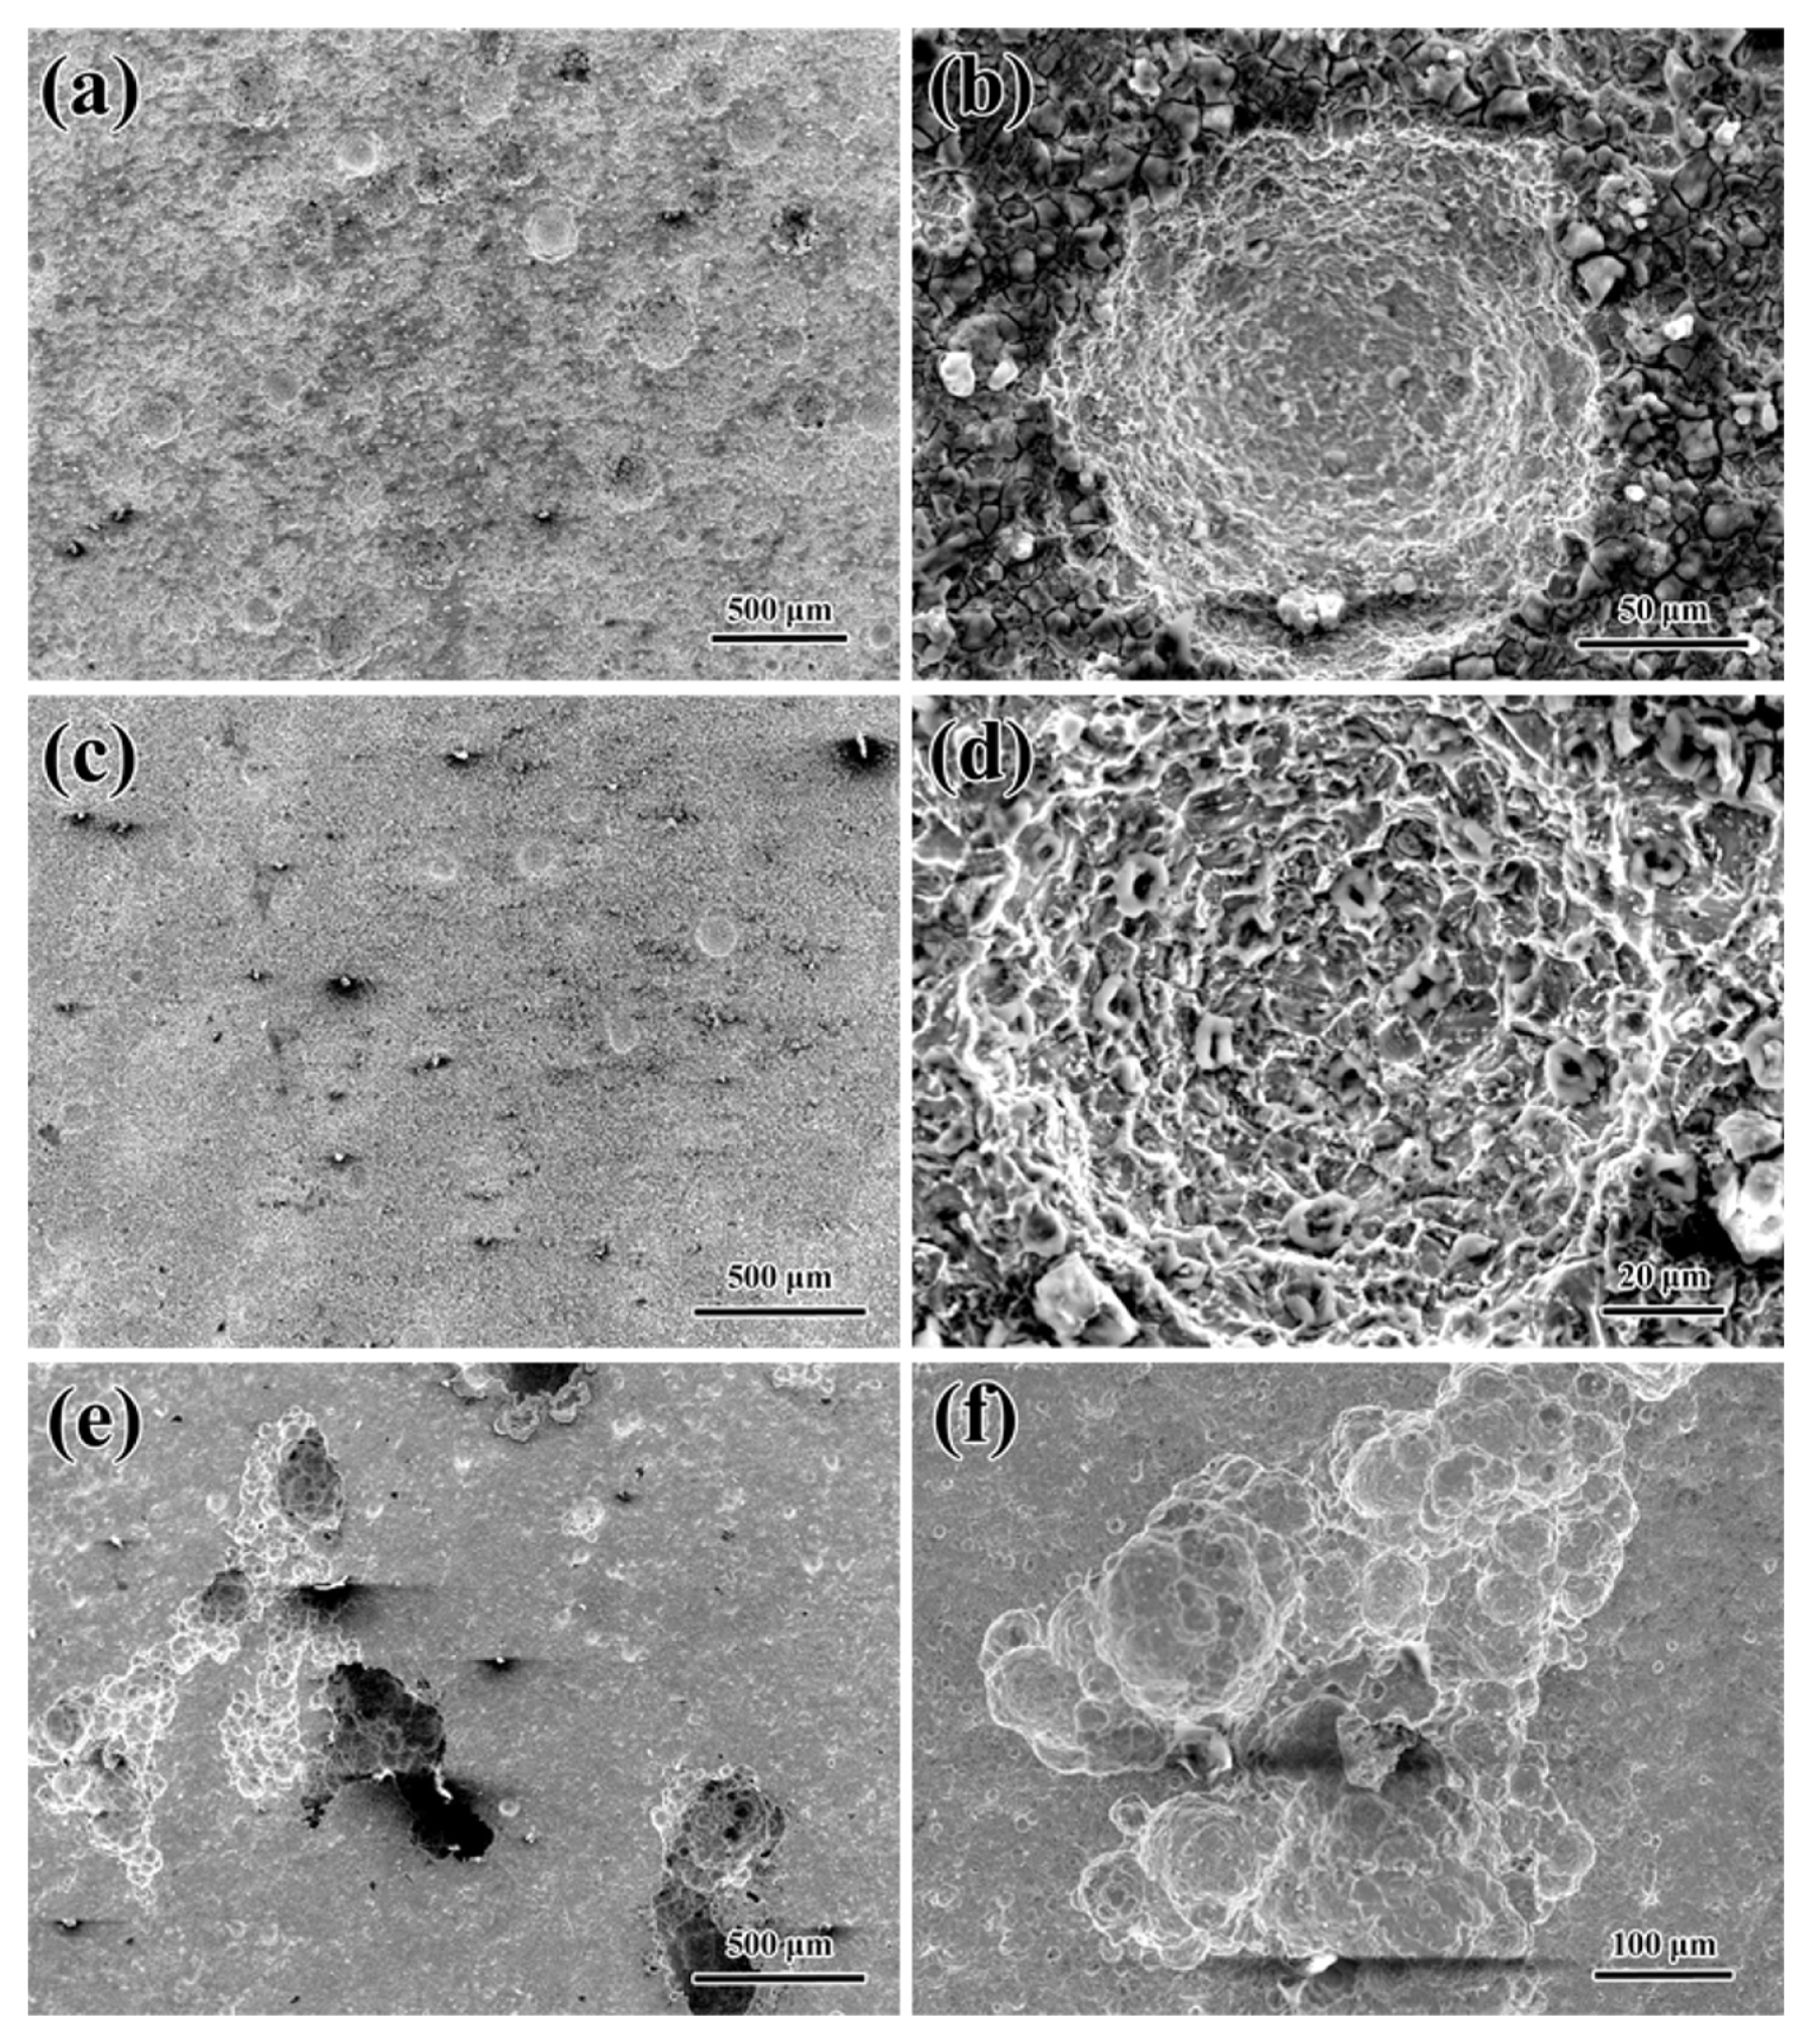
3.2 SEM analysis of corrosion morphology

Fig. 2 shows the corrosion attack morphologies of the steel after removing the corrosion product. In the 0.01% and 0.1% NaHSO3 solutions, corrosion morphologies of the steel surface are relatively uniform (Figs. 2a and 2c), with many shallow corrosion spots inlaying in it. The corrosion spots look like bird’s nests, and their diameters are about 50 μm (Figs. 2b and 2d). In the above solutions, the steel tends to take place uniform corrosion only with slight corrosion spots.
When NaHSO3 concentration increased to 1.0%, localized corrosion dominates the steel surface (Fig. 2e). The corrosion spots connect with each other, forming the contiguous localized corrosion spots. Besides, out of the localized corrosion spots, some small pits seem to be forming (Fig. 2f). From the above, it can be concluded that the T91 steel tends to occur uniform corrosion with slight corrosion pits in the low-concentration NaHSO3 solutions, while the corrosion mode changes to localized corrosion with the increase of NaHSO3 concentration.

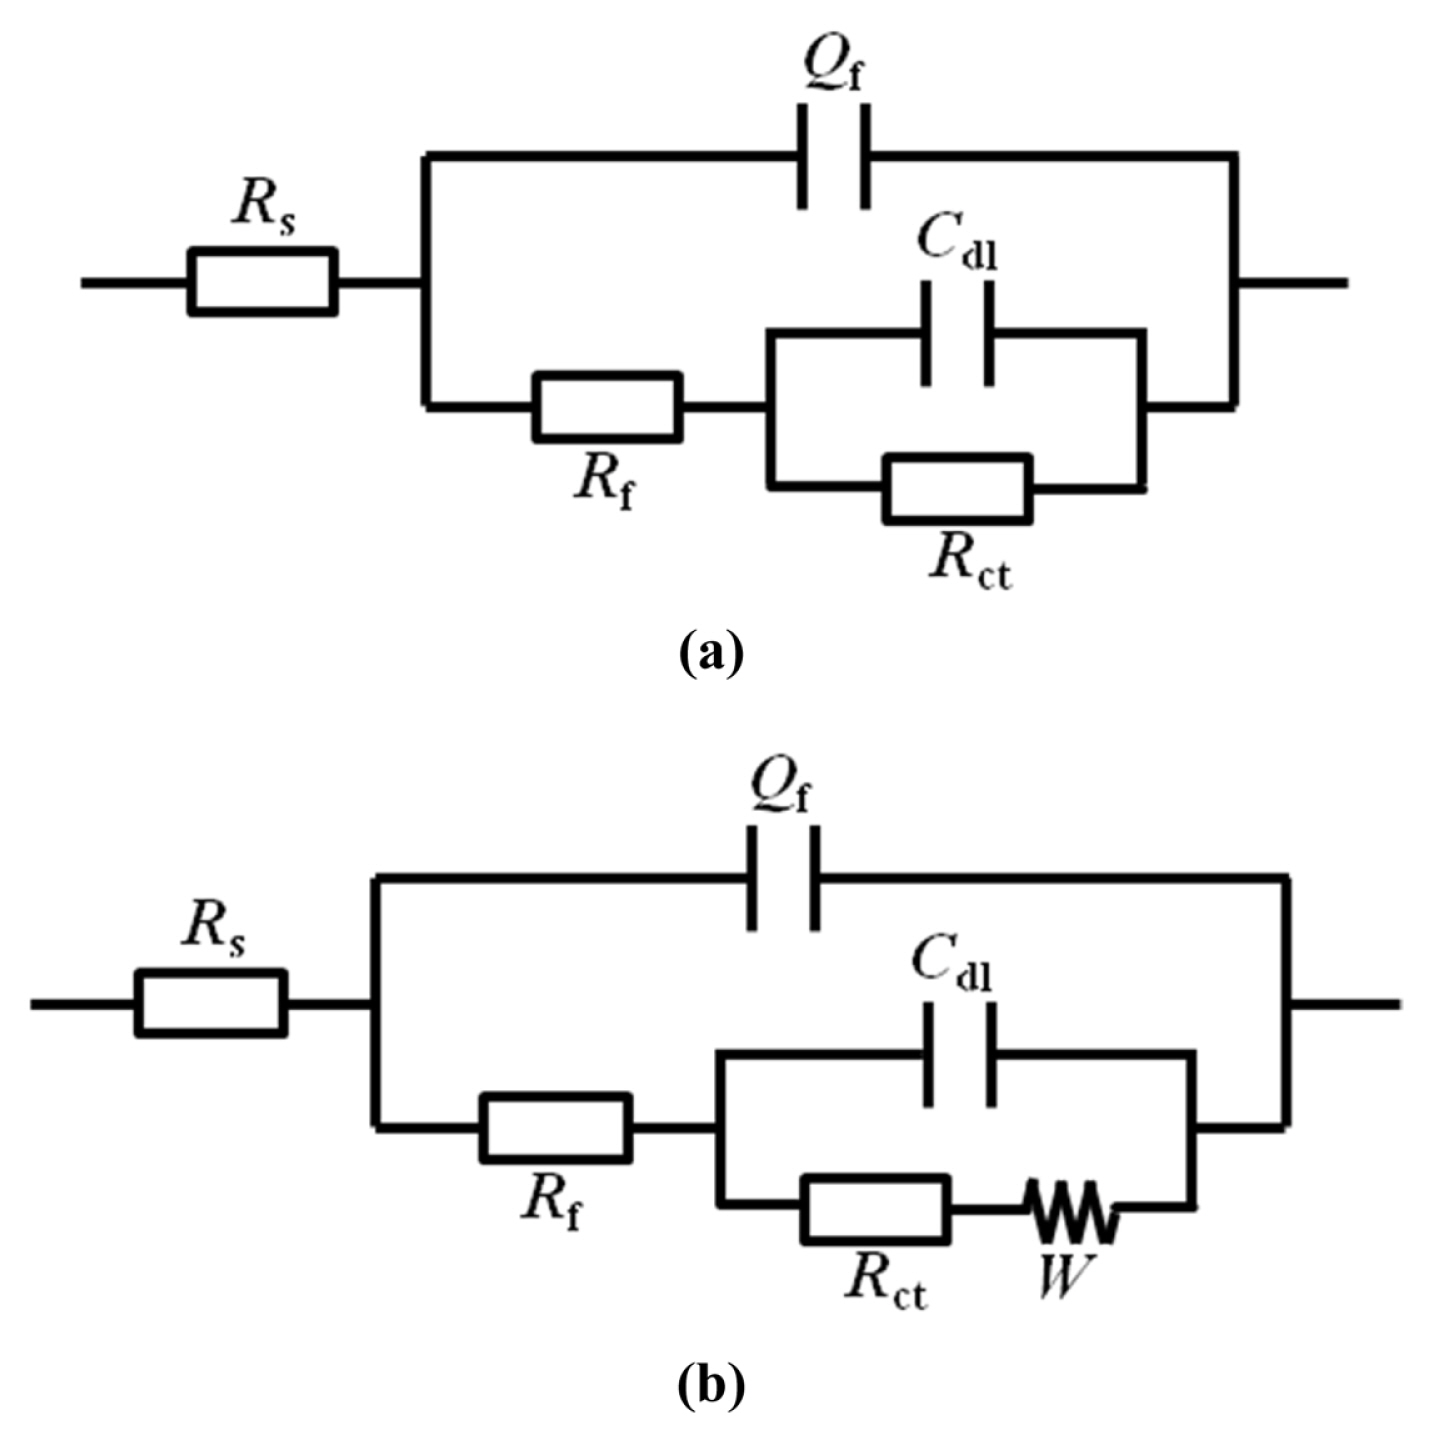
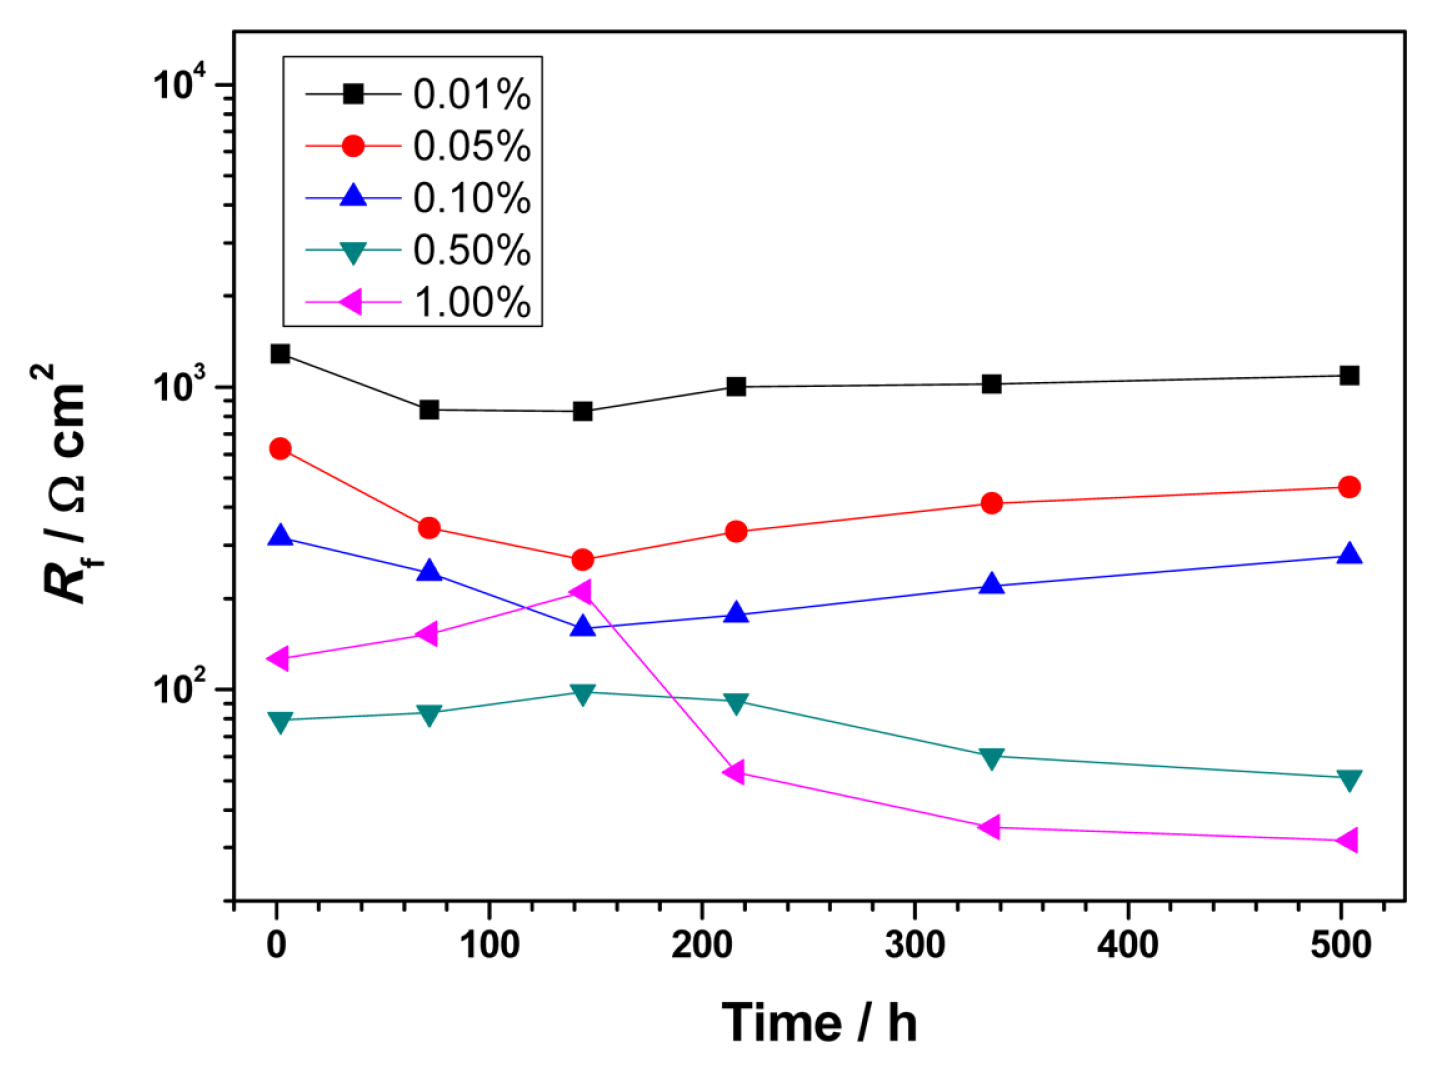
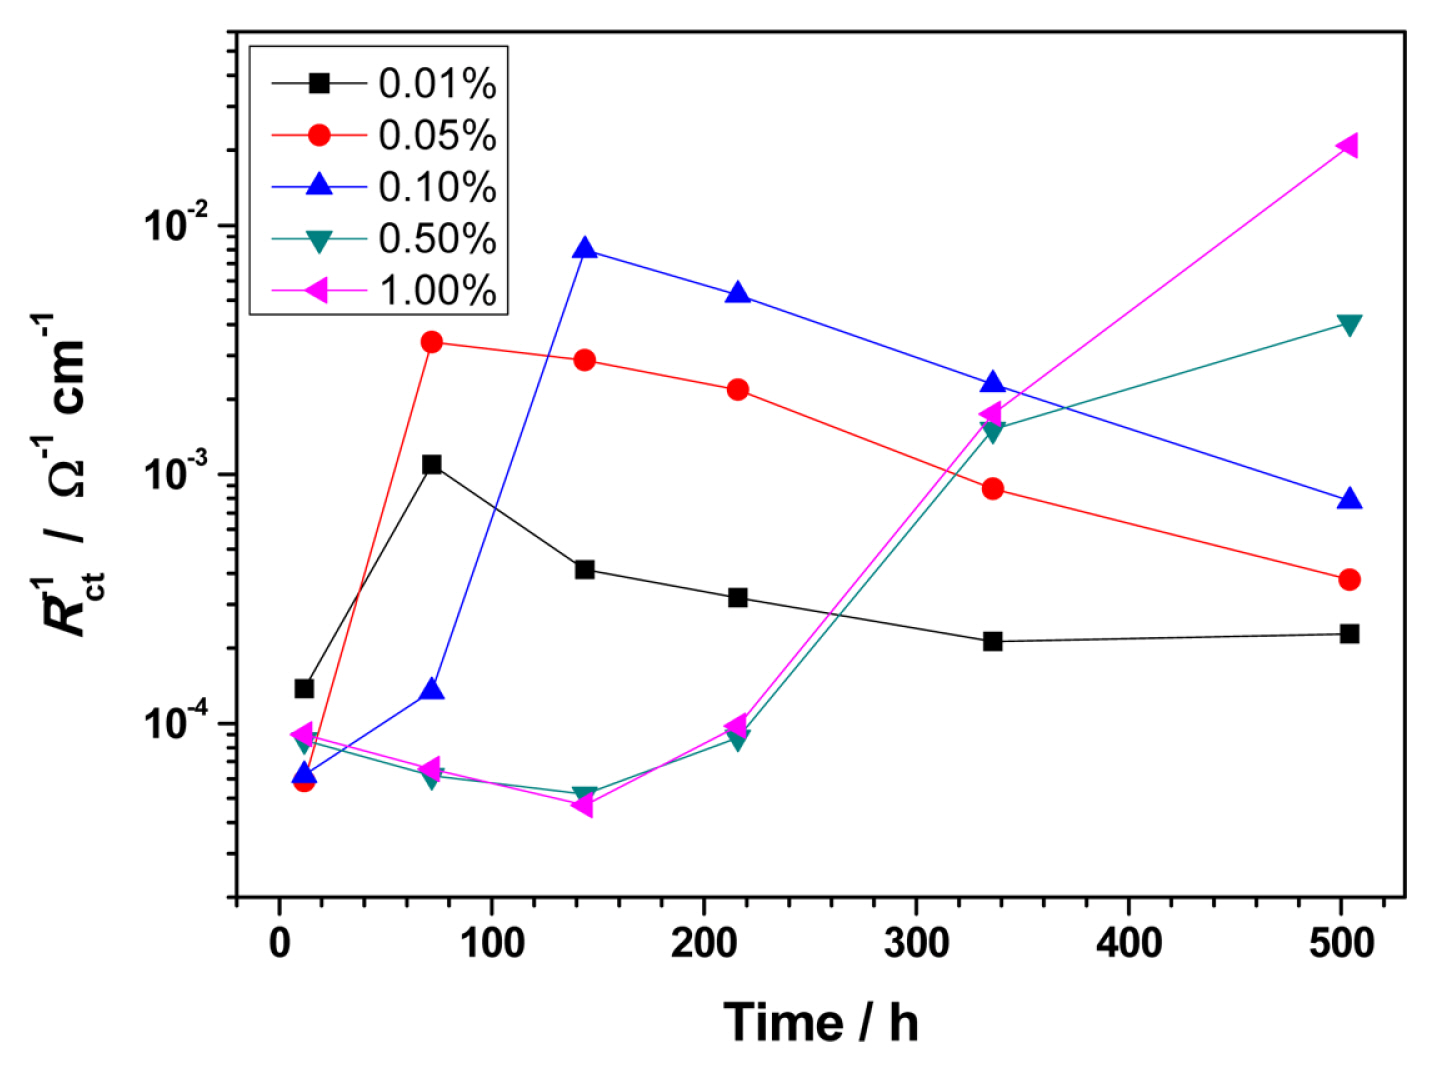
3.3 Electrochemical impedance spectroscopy (EIS)

Nyquist plots of the steel immersed in the NaHSO3 solutions with time are shown in Fig. 3. At the beginning of the experiment, the impedance of the steel firstly increases with the increase of NaHSO3 concentration, while it decreases after the NaHSO3 concentration reaching 0.1% (Fig. 3a). What’s more, the impedances of the steel in all solutions remain within one order of magnitude. After 72 h immersion, the impedance of the steel is still very high in the solutions with NaHSO3 concentration higher than 0.1%, but it becomes very low in the low-concentration solutions. At 144 h, the impedance increases slightly in the low-concentration solutions, decreases sharply in the 0.1% NaHSO3 solution, and continues to increase in the high-concentration solutions. At 216 h, the impedance of the steel in low concentration solution continues to rise, while that in the high-concentration solution slightly decreased. At 336 h, the impedance in the low-concentration solution is higher than that in the high-concentration solution. At the end of the experiment, the impedance of the steel shows a negative correlation with the NaHSO3 concentration in solutions.
From the above discussion, it is reasonable to infer that the impedance of the steel is relatively high once the steel is immersed in a NaHSO3 solution, and it will experience a drop at a certain time during the immersion process. The concentration of NaHSO3 mainly affects the time of the impedance drop and the subsequent trend of the impedance. The lower the concentration of NaHSO3 is, the earlier the impedance drop will occur. For example, the impedance drop occurs at 72nd h in 0.05% and 0.1% NaHSO3 solutions. In the low-concentration solutions, the impedance increases immediately after the drop, which may be related to the better mechanical properties of the corrosion products forming on the steel surface in the solution.
In order to further study the electrochemical behavior of the steel in NaHSO3 solution, equivalent circuits were used to simulate the EIS data. Two-constant model is adopted for fitting as shown in Fig. 4. Rs is the solution resistance. Rf and Qf are the resistance and capacitance of surface corrosion products, respectively. Rct is the charge transfer resistance, and Cdl is the double electric layer capacitance. W is the Weber impedance, and the corresponding fitting results are shown in Tables 3,7.
In the following, the evolutions of Rf and Rct of the steel are used to discuss the experimental results. Rf is the resistance of the surface corrosion products, which can represent the integrity of the products and its blocking effect to corrosive ions. Rf evolution of the steel with time in the NaHSO3 solutions is shown in Fig. 5. Rf variations can be divided into two types. When the NaHSO3 concentration is less than or equal to 0.1%, Rf of the steel gradually decreases in the early stage of the experiment, and then slightly increases with time. During the whole immersion process, Rf always decreases with the increase of NaHSO3 concentration. However, when the NaHSO3 concentration is 0.5% or 1.0%, Rf of the steel increases slightly in the early stage of the experiment, and then it decreases gradually. What’s more, Rf of the steel in the 1.0% NaHSO3 solution is higher than that in the 0.5% NaHSO3 solution in the early stage, while it decreases sharply from 144th h and is lower than the later in the end stage of the experiment.
Generally, Rct is inversely related to corrosion rate of metals. Thus, Rct evolution with time is represented as the Rct−1 change with time, as shown in Fig. 6. When NaHSO3 concentration is lower than 0.1%, Rct−1 of the steel sharply increases, and gradually decreases from the 72nd or 144th h to the end of the experiment. However, Rct−1 of the steel firstly decreases and then rapidly increases from 144th h in the 0.50% and 1.0% NaHSO3 solution. Obviously, the corrosion behavior of the steel present almost the opposite modes in low- and high-concentration NaHSO3 solutions. However, at the end of the experiment, there is a positive correlation between the corrosion rate and the NaHSO3 concentration. Comparing the evolutions of Rf and Rct, they display the same evolution pattern, which indicates that the change of corrosion products in the corrosion system plays an important role in corrosion rate.

3.4 Tafel polarization curve

Tafel curves of the steel immersed in the NaHSO3 solutions for 504 h are shown in Fig. 7, and the corresponding fitting results are shown in Table 8. The steel shows the characteristics of active anodic dissolution in all solutions, and the cathodic and anodic polarization behaviors are all directly affected by the NaHSO3 concentration. As shown in Table 8, the corrosion potential Ecorr of the steel decreases gradually but the corrosion current density icorr increases gradually with the increase of NaHSO3 concentration, indicating that NaHSO3 accelerates the corrosion process of the steel during the immersion. The cathodic Tafel slope βc of the steel is in the range of 260~320 mV/dec in the solutions, which is a limited difference. However, the anodic Tafel slope βa decreases from 390 mV/dec to 110 mV/dec with the increase of NaHSO3 concentration, and then increases sharply. The polarization resistance Rp of the system can be calculated by combining icorr and Tafel slopes:
(1)
Rp=bc·ba2.303·icorr·(bc+ba)
The calculated Rp is also shown in Table 8. The polarization resistance of the system decreases and the corrosion rate increases with the increase of NaHSO3 concentration at the end stage of the experiment. In order to compare Rp and Rct, the evolutions of Rp and Rct as a function of NaHSO3 concentration after 504 h immersion are presented in Fig. 8, and the results are fitted as shown in a black solid line. It can be seen from the figure that the results of Rp and Rct are similar, and they are scattered near the model results. The facts indicate that the result of Tafel curve is consistent with that of EIS.

4. Discussion

From the result section, the increase of NaHSO3 concentration in the solutions results into Ecorr decrease and icorr increase of the T91 steel, with the increase of chromium and sulfur contents in corrosion products. Uniform corrosion dominates the corrosion process of the steel in the low-concentration NaHSO3 solution, but high-concentration NaHSO3 tends to accelerate the corrosion process of the steel and increase its localized corrosion sensitivity. The corrosion mechanism of the steel in this solution can be summarized as follows:
When the steel is immersed in the low-concentration NaHSO3 solutions (0.01%, 0.05% and 0.1%), the steel surface may quickly corrode, and the corrosion products forming in the corrosion process will cover on the steel surface quickly, which prevents the direct contact between the corrosion medium and the base metal, thus reducing the corrosion rate. The whole process can be completed within 24 h [19], so the impedance of the steel is high and the corrosion rate is very low at 12h (Figs. 3a and 6). The corrosion products formed in the low-concentration NaHSO3 solutions are thin, and thus the corrosion medium can gradually diffuse into the interface between the steel and the corrosion product. At the same time, the high-valence iron oxide generated at the early stage may accelerate the steel corrosion through solid redox reaction. Therefore, the impedance of the steel decreases and the corrosion rate increases accordingly at 72~144h (Figs. 3b, 3c and 6). On the other hand, the diffusion of the corrosive medium and the solid-state reaction may be local, or proceed through some certain channels in the corrosion product, inducing many localized corrosion pits on the steel surface (Figs. 2b and 2d). Afterwards, newly-formed corrosion products will fill the channels in the corrosion products, making them denser. The corrosion products will also exist on the steel/product interface, which acts as a physical shielding film for the diffusion of corrosive medium. Then the steel corrosion rate gradually decreases (Fig. 6).
When the steel is immersed in the high-concentration NaHSO3 (0.5% and 1.0%) solutions, corrosion products will also cover on the steel surface and inhibit the corrosion process in the early stage of the experiment. What’s more, the corrosion rate and Rf of the steel decreases and increases respectively in the solutions in the early stage. The fact shows that the corrosion products may be thicker and the inhibition effects will last longer. However, the NaHSO3 concentration is relatively higher in the bold solution, thus more corrosive medium may diffuse into the steel/product interface, leading to an extremely rapid corrosion rate (Figs. 3c~3f) and inducing severe localized corrosion (Figs. 2e and 2f). These localized corrosion spots may act as the anode of the corrosion reaction, and the corrosion product layer that has not been penetrated by the corrosive medium may function as the cathode of the corrosion reaction, thereby forming a corrosion couple with large cathode/small anode and accelerating the corrosion process of the steel. Therefore, in the high-concentration NaHSO3 solutions, the corrosion rate is very high in the later period of the experiment (Fig. 6), and the enhancing effects of NaHSO3 is obvious. And, the contiguous localized corrosion will be the main corrosion type for the steel (Figs. 2e and 2f), where the anodic reaction may take place on the region around the contiguous localized corrosion.
pH of the solutions is distributed in range from 5.1 to 4.1 (Table 1). The corrosion process of the steel in the solutions is an electrochemical reaction in the acidic solutions. This may be the first reason why the steel shows the characteristics of active anodic dissolution in all solutions (Fig. 7). Besides, pH of the solutions decreases with the increase of NaHSO3 concentration (Table 1), which may promote the dissolution of the steel substrate and the reduction of the hydrogen ion in the solution. This may be another way for NaHSO3 concentration to affect the anodic and cathodic polarizations of the steel. What’s more, as shown in EDS results (Table 2), the chromium content in corrosion products on the steel surface is in a range from 12 to 20 at.%. The content is much higher than that in the steel matrix (8.00~9.50 wt%). The fact manifests that chromium deposits on the steel surface during the corrosion process, participates in the formation process of corrosion products, and plays a role in protecting the steel. However, high sulfur content also is detected in the corrosion products, and the sulfur content in corrosion products increases with the increase of NaHSO3 concentration. It has been reported in the literature [20,21] that the presence of S element can reduce the mechanical properties of corrosion products, which is the reason why the micro-cracks in corrosion products increase and the mechanical properties decrease with the increase of NaHSO3 concentration (Fig. 1).

5. Conclusions

The corrosion behavior of a T91 steel in different concentrations of NaHSO3 solutions was studied, and the following conclusions can be drawn:
  1. After immersing in NaHSO3 solution for 504 h, intact corrosion products can be generated on the steel surface. With the increase of NaHSO3 concentration, the sulfur content in corrosion products increases, but the compactness and mechanical properties of the corrosion products decrease accordingly.

  2. In the low-concentration NaHSO3 solutions, the steel tends to undergo uniform corrosion with slight corrosion spots. But, as the NaHSO3 concentration increases, the localized corrosion sensitivity of the steel increases, and the corrosion model gradually changes into localized corrosion.

  3. In low- and high-concentration NaHSO3 solutions, Rf of the steel exhibits different evolution patterns, and the corrosion behavior of the steel is almost opposite.

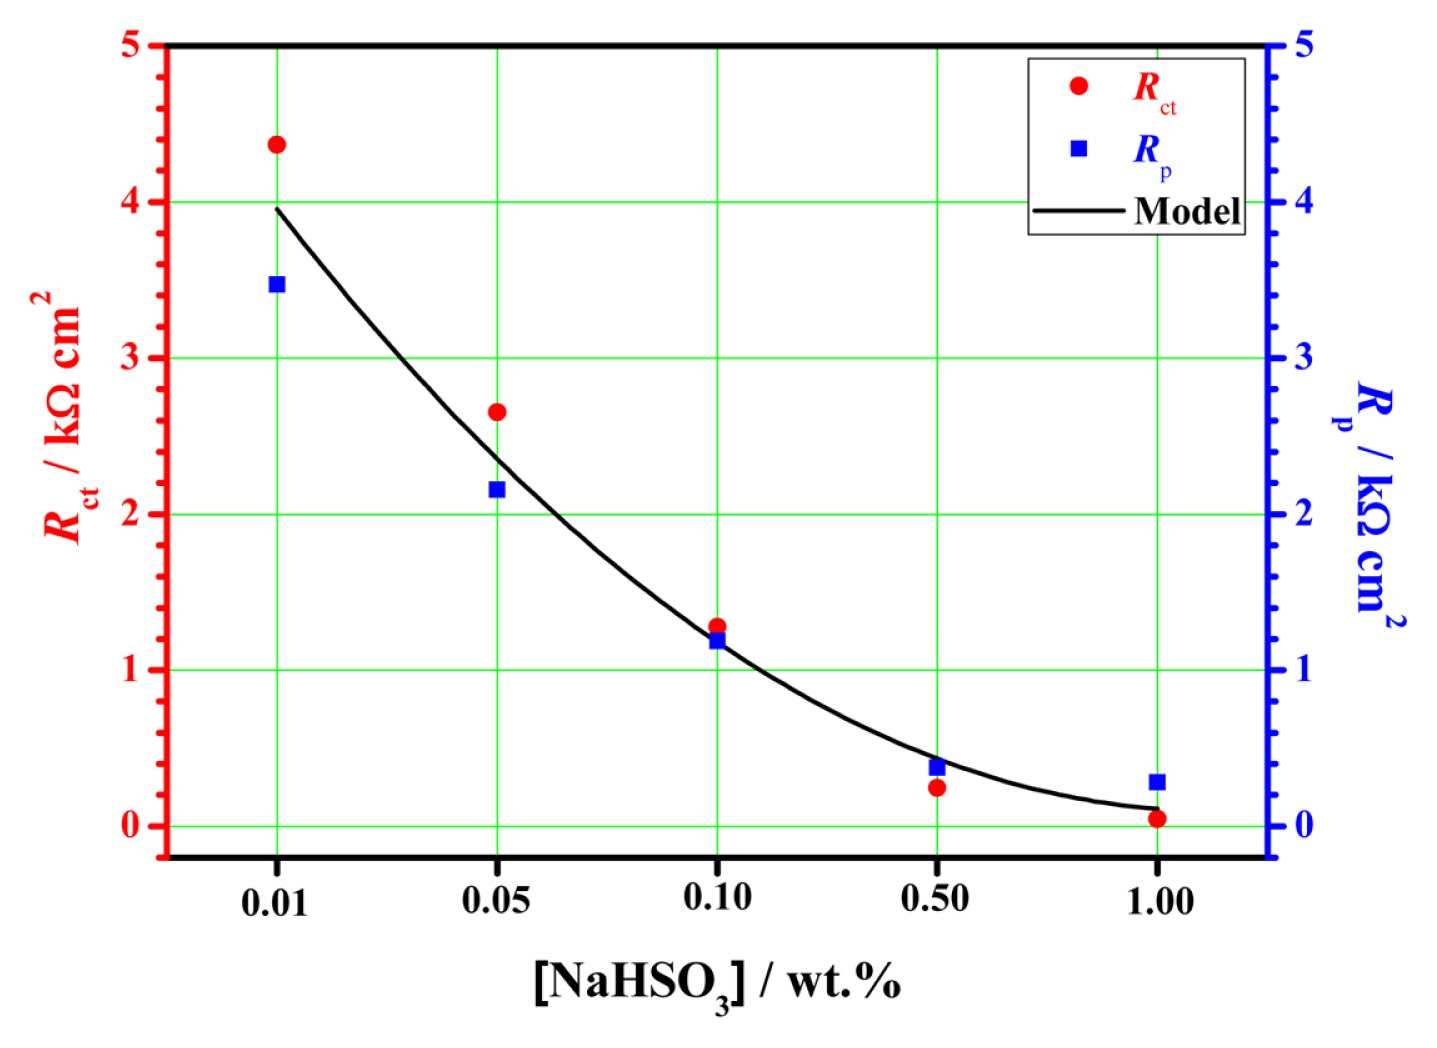
  4. The steel in the NaHSO3 solutions exhibits an obvious characteristic of active anodic dissolution. The cathodic and anodic polarization behaviors are all directly affected by the NaHSO3 concentration, and the polarization resistance of the system gradually decreases with the increase of NaHSO3 concentration in solution.

Acknowledgement

We are grateful for financial support of National Natural Science Foundation of China (51971191, 51601164) and Hunan Provincial Natural Science Foundation of China (2019JJ30023, 2019RS2038).

Fig. 1
SEM micrographs of corrosion product on the steel surface after 504 h immersion in (a, b) 0.01wt.%, (c, d) 0.10 wt.% and 1.00 wt.% NaHSO3 solutions.
jecst-2020-00997f1.jpg
Fig. 2
Corrosion attack morphologies of the steel after 504 h immersion in (a, b) 0.01wt.%, (c, d) 0.10 wt.% and 1.00 wt.% NaHSO3 solutions.
jecst-2020-00997f2.jpg
Fig. 3
Nyquist plots of T91 steel immersed in the NaHSO3 solutions as a function of time.
jecst-2020-00997f3.jpg
Fig. 4
Equivalent circuit for EIS fitting: R(Q(R(QR))) (a); R(Q(R(Q(RW)))) (b).
jecst-2020-00997f4.jpg
Fig. 5
Rf of the steel immersed in NaHSO3 solutions as a function of time.
jecst-2020-00997f5.jpg
Fig. 6
Rct−1 of the steel immersed in NaHSO3 solutions as a function of time.
jecst-2020-00997f6.jpg
Fig. 7
Tafel polarization curves of the steel after 504 h immersion in NaHSO3 solutions.
jecst-2020-00997f7.jpg
Fig. 8
Comparison between Rct and Rp of the steel after 504 h immersion in NaHSO3 solutions.
jecst-2020-00997f8.jpg
Table 1
Concentrations and pH of the NaHSO3 solutions.
[NaHSO3]/(wt.%) 0.01% 0.05% 0.1% 0.5% 1.0%
pH 5.10 4.75 4.60 4.25 4.10
Table 2
EDS results of corrosion products on the steel surface after 504 h immersion in the NaHSO3 solutions (at.%)
Position O Fe Cr S
1 61.44 21.19 12.65 4.490
2 69.30 9.150 15.64 5.900
3 60.20 16.26 16.23 7.140
4 63.59 7.220 21.58 5.730
5 58.76 6.600 20.23 14.41
6 55.79 12.66 20.05 11.51
Table 3
Fitting results of the EIS data of the steel in 0.01 wt.% NaHSO3 solution.
Time (h) Rs (Ω·cm2) Yf (S·secn·cm−2) nf Rf (Ω·cm2) Ydl (S·secn·cm−2) ndl Rct (Ω·cm2) χ2
12 8.204 4.409×10⁻⁹ 0.9534 1286 1.070×10⁻⁴ 0.7632 7264 1.795×10⁻³
72 7.336 1.158×10⁻⁸ 0.8886 840.1 5.515×10⁻⁴ 0.6017 915 2.528×10⁻⁴
144 87.36 5.541×10⁻⁸ 0.8457 831.0 4.942×10⁻⁴ 0.5324 2416 8.532×10⁻⁴
216 85.73 3.796×10⁻⁸ 0.8806 1002 4.563×10⁻⁴ 0.5580 3128 7.693×10⁻⁴
336 40.61 4.382×10⁻⁸ 0.8338 1022 4.361×10⁻⁴ 0.5827 4690 1.513×10⁻³
504 43.02 2.280×10⁻⁸ 0.8252 1090 4.570×10⁻⁴ 0.557 4371 2.668×10⁻³
Table 4
Fitting results of the EIS data of the steel in 0.05 wt.% NaHSO3 solution.
Time (h) Rs (Ω·cm2) Yf (S·secn·cm−2) nf Rf (Ω·cm2) Ydl (S·secn·cm−2) ndl Rct (Ω·cm2) χ2
12 109.1 9.492×10⁻⁸ 0.8976 624.2 7.027×10⁻⁵ 0.6829 17130 1.186×10⁻³
72 57.23 8.041×10⁻⁸ 0.7725 341.9 4.022×10⁻⁴ 0.7155 294.2 2.329×10⁻⁴
144 60.59 1.233×10⁻⁷ 0.9257 268.9 1.315×10⁻³ 0.6545 347.7 2.019×10⁻⁴
216 68.82 1.235×10⁻⁷ 0.9243 332.6 1.294×10⁻³ 0.6426 457.9 2.213×10⁻⁴
336 96.16 1.758×10⁻⁷ 0.8697 412.3 1.224×10⁻³ 0.5787 1145 4.660×10⁻⁴
504 89.22 9.681×10⁻⁸ 0.9172 466.2 7.014×10⁻⁴ 0.5844 2656 4.209×10⁻⁴
Table 5
Fitting results of the EIS data of the steel in 0. 1 wt.% NaHSO3 solution
Time (h) Rs (Ω·cm2) Yf (S·secn·cm−2) nf Rf (Ω·cm2) Ydl (S·secn·cm−2) ndl Rct (Ω·cm2) W
S·sec5·cm−2
χ2
12 61.25 1.264×10⁻⁷ 0.9059 318.5 7.789×10⁻⁵ 0.7940 16170 2.085×10⁻³
72 49.73 1.573×10⁻⁷ 0.9033 243.3 1.495×10⁻⁴ 0.7445 7427 3.096×10⁻³
144 38.00 1.581×10⁻⁷ 0.9235 159.0 2.255×10⁻³ 0.7701 125.9 2.190×10⁻⁴
216 35.07 1.131×10⁻⁷ 0.9318 176.6 6.330×10⁻³ 0.7982 190.5 2.213×10⁻⁴
336 39.57 1.546×10⁻⁷ 0.8876 220.2 5.963×10⁻³ 0.6354 435.4 5.267×10⁻⁴
504 50.36 7.840×10⁻⁸ 0.9334 276.7 2.823×10⁻³ 0.3587 1278 9.512×10⁻⁴ 8.971×10⁻⁴
Table 6
Fitting results of the EIS data of the steel in 0.5 wt.% NaHSO3 solution.
Time (h) Rs (Ω·cm2) Yf (S·secn·cm−2) nf Rf (Ω·cm2) Ydl (S·secn·cm−2) ndl Rct (Ω·cm2) W
S·sec5·cm−2
χ2
12 13.27 1.233×10⁻⁶ 0.7856 79.37 7.098×10⁻⁵ 0.8235 11700 1.230×10⁻³ 1.927×10⁻³
72 11.23 1.892×10⁻⁶ 0.7486 83.80 8.799×10⁻⁵ 0.7835 16260 3.967×10⁻³
144 6.771 5.563×10⁻⁶ 0.6560 98.30 9.411×10⁻⁵ 0.7799 19330 7.448×10⁻³
216 3.316 4.122×10⁻⁶ 0.6372 91.68 9.547×10⁻⁵ 0.7789 11340 7.131×10⁻³
336 13.87 3.850×10⁻⁷ 0.8544 60.34 3.631×10⁻⁴ 0.6604 661.7 2.342×10⁻⁴
504 13.06 1.663×10⁻⁷ 0.9504 51.09 2.649×10⁻² 0.8075 245.9 1.779×10⁻⁴
Table 7
Fitting results of the EIS data of the steel in 1.0 wt.% NaHSO3 solution.
Time (h) Rs (Ω·cm2) Yf (S·secn·cm−2) nf Rf (Ω·cm2) Ydl (S·secn·cm−2) ndl Rct (Ω·cm2) W
S·sec5·cm−2
χ2
12 46.38 6.411×10⁻⁵ 0.7465 126.4 1.497×10⁻⁵ 0.9617 11090 1.526×10⁻³ 5.414×10⁻³
72 48.55 6.260×10⁻⁵ 0.7377 152.4 4.029×10⁻⁵ 0.8488 15320 6.873×10⁻³
144 51.47 6.563×10⁻⁵ 0.7523 210.2 4.938×10⁻⁵ 0.8545 21410 1.952×10⁻³
216 15.15 9.042×10⁻⁷ 0.8111 53.28 1.361×10⁻⁴ 0.7245 10230 9.575×10⁻³
336 12.731 4.357×10⁻⁸ 0.9919 35.02 7.520×10⁻⁴ 0.5816 572.5 6.952×10⁻⁴
504 8.903 2.025×10⁻⁷ 0.9106 31.76 2.675×10⁻² 0.5917 47.75 0.461 1.601×10⁻⁴
Table 8
Fitting results of the Tafel curves of the steel after 504h immersion in NaHSO3 solutions.
[NaHSO3] wt.% Ecorr
Vvs. SCE
icorr μA·cm−2 βc mV·dec−1 βa mV·dec−1 Rp Ω·cm2
0.01% −0.509 19.6 262.6 388.6 3472
0.05% −0.562 32.6 278.2 387.5 2157
0.1% −0.573 55.2 267.2 347.4 1188
0.5% −0.591 93.2 313.5 108.8 376.2
1.0% −0.643 235 287.7 326.9 282.8

References

[1] XH. Xu and HW. Hao, Sichuan Environ, 2011, 30(4), 135–139.

[2] Y. Liu, Z. Wang, J. Wang and B. Hu, J Chin Soc Corros Prot, 2014, 34(5), 426–432.

[3] S. Tsouli, AG. Lekatou, S. Kleftakis, TE. Matikas and PT. Dalla, Proce Struct Inte, 2018, 10, 41–48.
crossref
[4] E. Franzoni and E. Sassoni, Sci Total Environ, 2011, 412–413, 278–285.
crossref
[5] RA. Livingston, Atmos Environ, 2016, 146, 332–345.
crossref
[6] F. Yuan, M. Chen, H. Huang, L. Xie and C. Wang, Thin Wall Struct, 2018, 122, 90–101.
crossref
[7] V. Marcos-Meson, G. Fischer, C. Edvardsen, TL. Skovhus and A. Michel, Constr Build Mater, 2019, 200, 490–501.
crossref
[8] Y. Shi, Z. Zhang, J. Su, F. Cao and J. Zhang, Electrochim Acta, 2006, 51(23), 4977–4986.
crossref
[9] W. Zhou, D. Shan, E. Han, W. Ke and T. Nonferr, Metal Soc, 2008, 18, s334–s338.
crossref
[10] F. Liu, Y. Song, D. Shan, E. Han and T. Nonferr, Metal Soc, 2010, 20, s638–s642.
crossref
[11] S. Varvara, G. Caniglia, J. Izquierdo, R. Bostan, L. Găină, O. Bobis and RM. Souto, Corros Sci, 2020, 165, 108381.
crossref
[12] I. Rotaru, S. Varvara, L. Gaina and LM. Muresan, Appl Surf Sci, 2014, 321, 188–196.
crossref
[13] Y. Otoguro, M. Matsubara, I. Itoh and T. Nakazawa, Nucl Eng Des, 2000, 196(1), 51–61.
crossref
[14] Y. Long, C. Feng, B. Peng, Y. Xie, J. Wang, M. Zhang, Y. Wu, T. Wu and F. Yin, Int J Electrochem Sci, 2017, 12(6), 5104–5120.
crossref pdf
[15] C. Feng, BC. Peng, Y. Xie, J. Wang, MH. Li, TQ. Wu and FC. Yin, J Chin Soc Corros Prot, 2017, 37(06), 583–589.

[16] C. Feng, B. Peng, Y. Xie, J. Wang, M. Li, Y. Liu, T. Wu and F. Yin, Corros Prot, 2018, 39(6), 431–436.

[17] Q. Zhang, Q. Wang and C. Liu, Baosteel Techn, 2014, (6), 61–65.

[18] F. Yu, C. Yuan, Y. Jiang, Y. Lin and Y. Li, Total Corros Control, 2010, 24(4), 6–10.

[19] Y. Yin, J. Zhao, X. Cheng and X. Li, Sci Tech Rev, 2012, 30(16), 48–51.

[20] T. Wu, J. Xu, C. Sun, M. Yan, C. Yu and W. Ke, Corros Sci, 2014, 88, 291–305.
crossref
[21] T. Wu, Z. Zhou, X. Wang, D. Zhang, M. Yan, J. Xu, C. Sun and F. Yin, Surf Tech, 2019, 48(7), 285–295.

TOOLS
Share :
Facebook Twitter Linked In Google+ Line it
METRICS Graph View
  • 2 Web of Science
  • 1 Crossref
  • 2 Scopus
  • 8,553 View
  • 97 Download
Related articles in J. Electrochem. Sci. Technol

Size Effects of MoS2 on Hydrogen and Oxygen Evolution Reaction2022 February;13(1)


ABOUT
ARTICLE CATEGORY

Browse all articles >

BROWSE ARTICLES
AUTHOR INFORMATION
Editorial Office
E-mail: journal@kecs.or.kr    Tel: +82-2-568-9392    Fax: +82-2-568-5931                   

Copyright © 2024 by The Korean Electrochemical Society.

Developed in M2PI

Close layer
prev next