Methodological Consideration on the Prediction of Electrochemical Mechanical Polishing Process Parameters by Monitoring of Electrochemical Characteristics of Copper Surface
Article information
Abstract
The removal characteristics of copper (Cu) from electrochemical surface by voltage-activated reaction were reviewed to assess the applicability of electrochemical-mechanical polishing (ECMP) process in three types of electrolytes, such as HNO3, KNO3 and NaNO3. Electrochemical surface conditions such as active, passive, transient and trans-passive states were monitored from its current-voltage (I–V) characteristic curves obtained by linear sweep voltammetry (LSV) method. In addition, the oxidation and reduction process of the Cu surface by repetitive input of positive and negative voltages were evaluated from the I–V curve obtained using the cyclic voltammetry (CV) method. Finally, the X-ray diffraction (XRD) patterns and energy dispersive spectroscopy (EDS) analyses were used to observe the structural surface states of a Cu electrode. The electrochemical analyses proposed in this study will help to accurately control the material removal rate (MRR) from the actual ECMP process because they are a good methodology for predicting optimal electrochemical process parameters such as current density, operating voltage, and operating time before performing the ECMP process.
1. Introduction
Chemical-mechanical polishing (CMP) is the most widely used planarization technique in the semiconductor integrated circuit fabrication process [1–5]. This application of CMP technology has been most useful in the manufacture of Cu damascene structures, especially in multilevel interconnection process [6–8]. However, a material with low dielectric constant (low-k) in a device structure of 65 nm or less requires low down-force mechanical polishing to maintain an integrated structure at the bottom during the subsequent polishing process because of its fragile feature [9]. To overcome these problems, a new planarization technology was developed that uses chemical electrolytes instead of abrasive slurry to compensate for reduced mechanical down force [9–12]. This new attempt is called electrochemical mechanical polishing (ECMP), and this ECMP process can be used as a technology to replace or supplement the current CMP technology. The most important thing in this ECMP process is that a proper balance between electrochemical surface conditions and mechanical removal rate is needed to achieve optimal electrochemical results.
In this paper, the mechanism by which Cu material is removed during the Cu-ECMP process is based on the voltage-activated electrochemical reactions [13–15]. This voltage is designed to control the anodic decomposition that forms Cu2+ or Cu+ ions on the working electrode surface within three types of electrolytes, such as KNO3 [16], NaNO3 [17], and HNO3 [18], used in this paper. First, I–V curves obtained from linear sweep voltammetry (LSV) and cyclic voltammetry (CV) methods were used to monitor the effect of electrolyte concentration on the electrochemical surface reaction of Cu electrode. From these curves, it was possible to characterize the electrochemical states such as active, passive, transient and trans-passive. Second, the oxidation and reduction process of the Cu surface was monitored by repeated scans of anodic and cathodic potential in different electrolytes. From these monitoring methods, it is very important to understand the electrochemical characteristics for determining the optimum ECMP process parameters, such as electrolyte concentration, operating voltage and current density, before performing the ECMP process. Finally, using x-ray diffraction (XRD) pattern and energy dispersive spectroscopy (EDS) analysis, the chemical state and element composition of Cu surface were investigated according to electrolyte concentration and operating voltage variations.
2. Experimental
The voltage-activated electrochemical reactions were investigated in order to evaluate the possibility of Cu-ECMP process in the acid-based HNO3, alkali-based KNO3 and NaNO3 electrolytes. Pure Cu sample of 99.99% with 2 cm×2 cm size was used as an experimental species in a standard two-electrode glass cell containing a platinum (Pt) counter electrode (CE) and a Cu working electrode (WE) as shown in our previous reports [16–18]. All experiments were performed at room temperature in the absence of the mechanical polishing. De-ionized water and reagent graded chemicals were used to prepare the electrolyte of HNO3, KNO3, and NaNO3 with different concentration level as follows; 1, 5, 10, and 20 wt%(weight percent), respectively.
The I–V measurement system of Keithley 236 Model was used to analyze the electrochemical surface states of Cu electrode at various electrolyte concentrations. Electrochemical states, such as active, passive, transient and trans-passive from the I–V curve by LSV method, have been characterized to determine the range of the applied voltage before the subsequent quantitative tests. The voltage scanning rate was 8 mV/s because it was measured 1,000 times at a 0.5 s interval from −2.0V to +2.0V.
In quantitative tests, the voltage-activation process was performed to identify the relationship between weight loss and current density that was decomposed by electrochemical reactions. The weight of the sample before and after the quantitative test was measured on precision electronic scale, and the polishing removal rate of Cu was calculated. The composition of elements on Cu surface according to the applied voltage was confirmed through XRD pattern and EDS analysis.
The methodological approaches of three-step discussed in this study are summarized as follows.
Step 1: Determine the range of voltages from the IV curve obtained by the LSV method to point out the active, passive, transient and trans-passive states.
Step 2: After observing the Cu removal thickness according to voltage application time at different electrolyte concentration, calculate the equations such as linear and polynomial fits, and predict the quantity of Cu removal according to operation time in advance to determine the range of appropriate voltage application time.
Step 3: Monitor the adsorption (oxidation) and desorption (reduction) behavior of Cu ions in the current density curve according to the applied voltage obtained by CV method in electrolyte with different concentrations, predicts the optimal voltage conditions applicable to the subsequent ECMP process.
3. Results and Discussion
Fig. 1 shows the current density as a function of applied voltage variation within the HNO3, KNO3 and NaNO3 electrolytes with different concentration. When the anode potential is at the active region (I) of Fig. 1, the initial potential of the anode means the beginning of electrochemical reactions, and the anode starts the normal dissolution reaction, which is called active state. And then, the passive region (II) begins to form as voltage increases gradually. In general, the passive film consists of a metallic hydroxide compound. However, after the formation of the passive film, the passive state remains as the voltage increase, unable to overcome this passive barrier (so-called plateau region). Therefore, the passive film starts to peel off until it reaches the transient potential region (III). From hereafter, it enters the trans-passive region (IV) of Fig. 1, and its reaction became very active. Also, two notable ohmic drops were observed in Fig. 1, the first voltage (V=IR) drop means the beginning of an active state, and the second IR drop indicates the beginning of a trans-passive state [17]. That is, such a voltage drop implies the abrupt increase of resistance. In other words, the increased resistance indicates that a passive oxide, such as CuO or Cu2O, was formed on Cu surface [18]. As mentioned above result of Fig. 1, it is important to understand the various electrochemical behaviors such as active, passive, transient, and trans-passive states from the I–V curve in order to choose the optimal process parameters prior to the ECMP process.
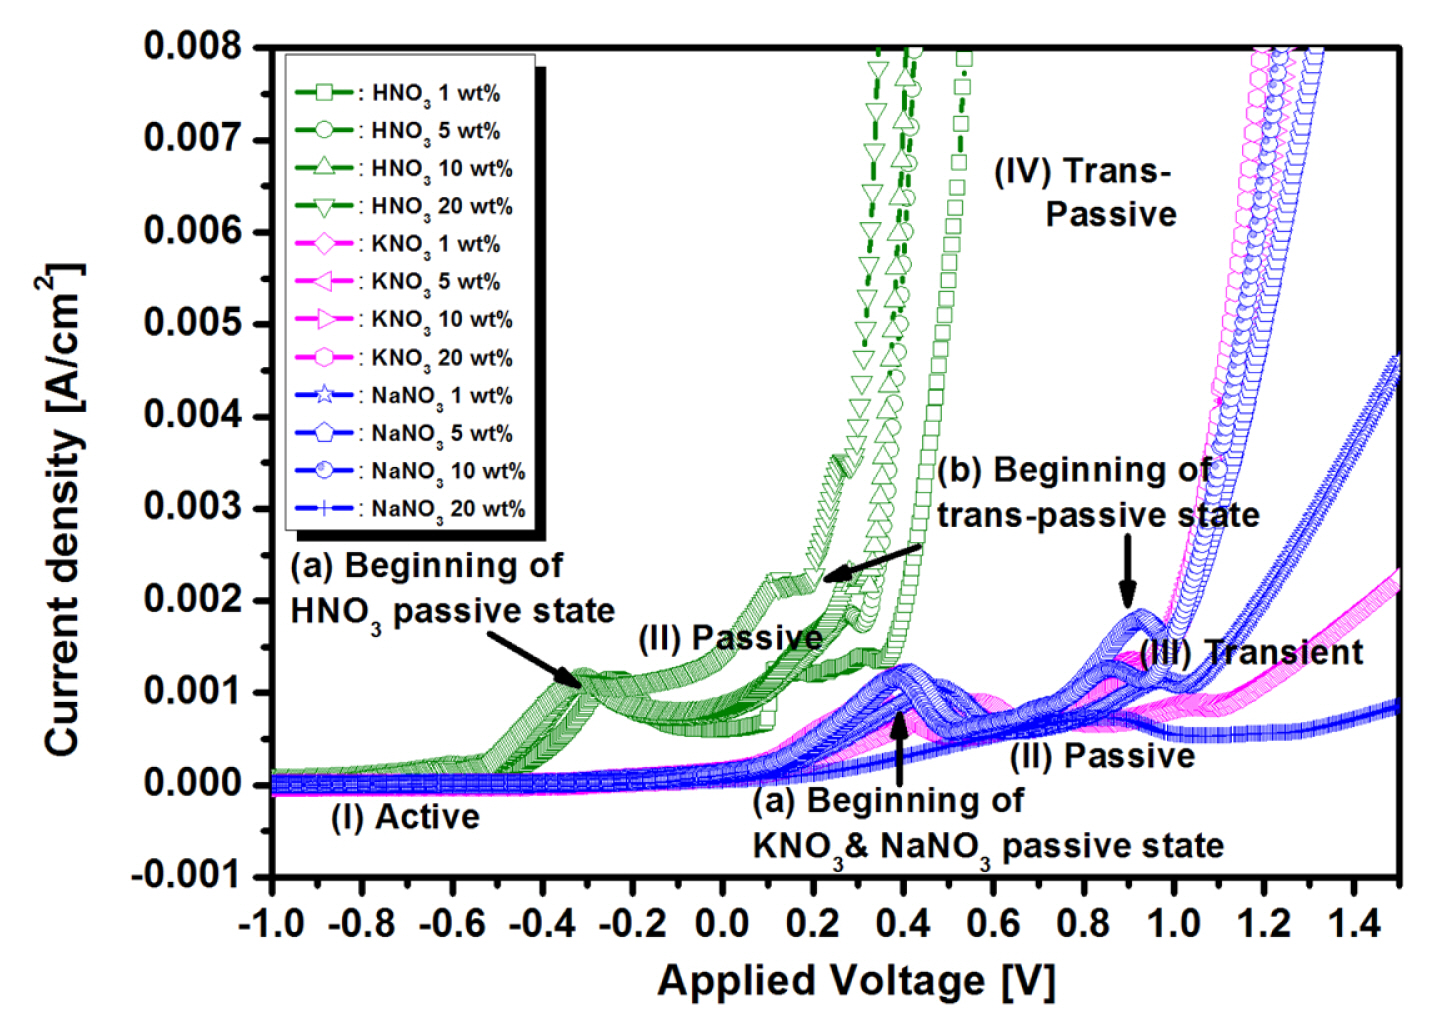
I–V curves of HNO3, KNO3 and NaNO3 electrolytes with different concentration obtained from linear sweep voltammetry (LSV) method with voltage scanning rate of 8 mv/sec.
Fig. 2 shows the comparison of the Cu removal thickness as a function of voltage application time at the voltage of trans-passive state in three electrolytes with different concentrations. The removal amounts were obtained by calculating the weight loss before and after the voltage-controlled electrochemical reaction. The measured experimental data are presented separately by different symbols as shown in Fig. 2(a, b, and c). The solid lines in Fig. 2(a, b) represent linear fit corresponding to 1 wt% and 10 wt% concentration, and the solid line in Fig. 2(c) shows polynomial fit for electrolyte with a concentration of 20 wt%. For 1 wt% and 10 wt% of these three electrolytes, linear dependences of removal rate on voltage application time were predicted as shown in Fig. 2(a, b). However, for the case of 20 wt% electrolyte, the dependence of polynomial was obtained as shown in Fig. 2(c). That is, the composite data of a polynomial fit with two steep slopes were presented. The data for 20 wt% HNO3 and 20 wt% NaNO3 electrolytes in Fig. 2(c) represent a composite data set that fit satisfactorily to two straight lines by polynomial fit with two steep slopes. The respective dependence equations were written in the graph.
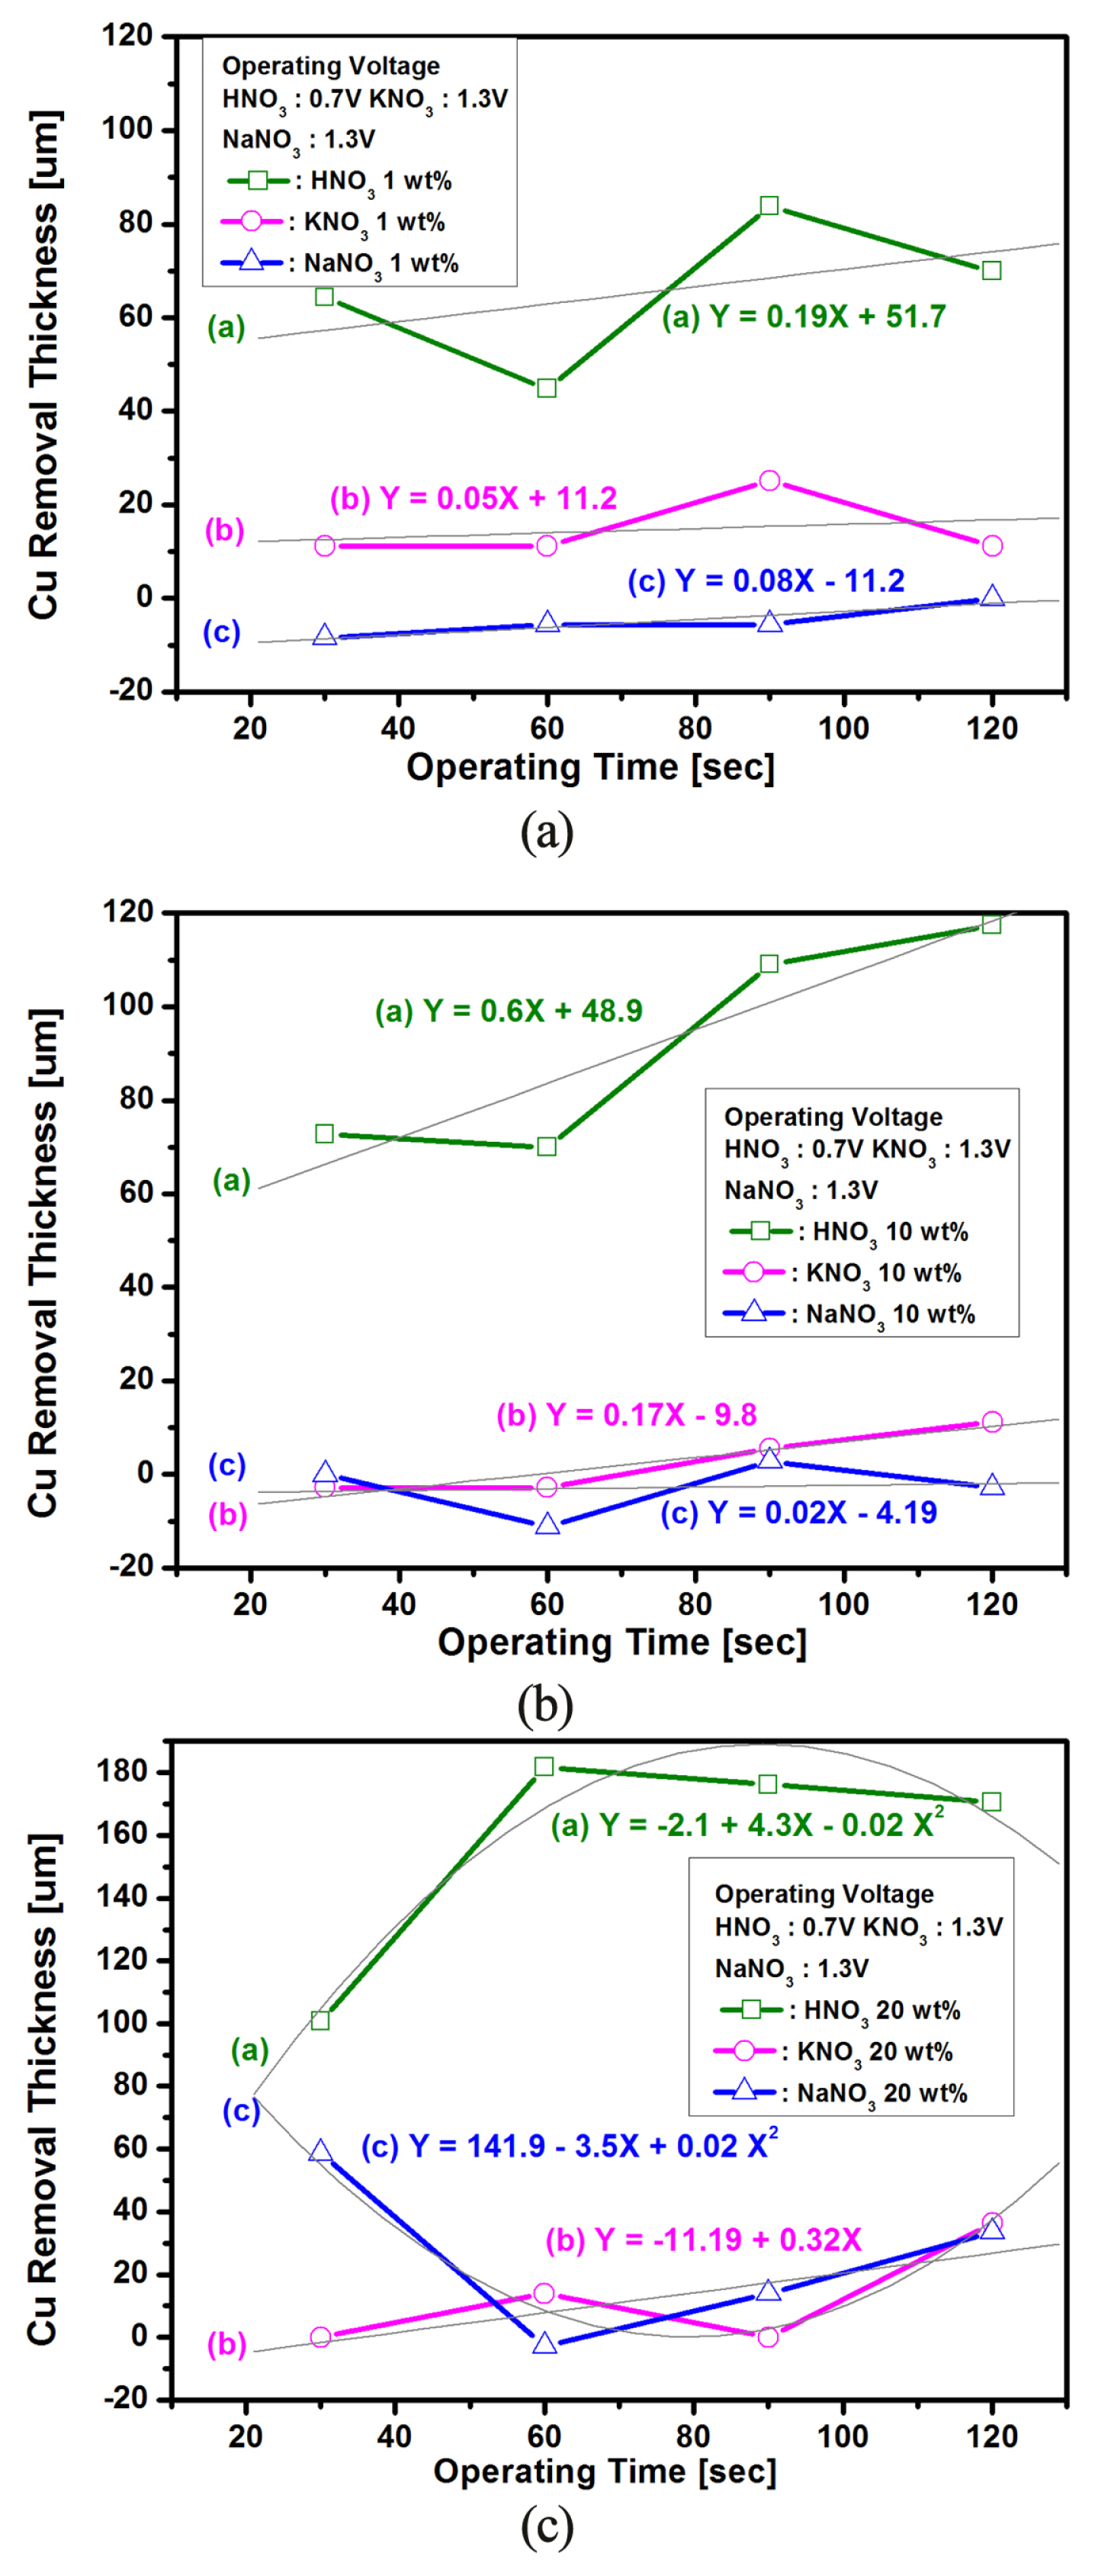
Cu removal thickness as a function of operating time variation at the trans-passive voltage (HNO3: 0.7V, KNO3 and NaNO3: 1.3 V) for the case of Cu sample with different concentration of three electrolytes; (a) 1 wt%, (b) 10 wt% and (c) 20 wt%.
The slopes in Fig. 2 show the global averages of Cu removal rates after voltage-activated electrochemical treatment, while each data represents the local mean value of Cu removal thickness at a given voltage application time. The characteristics of instantaneous removal thickness shown in Fig. 2 are due to changes of the potential profile at the electrochemical interface caused by accumulation of Cu+ and Cu2+ ions on the surface of the Cu electrode. These changes in the interfacial potential mainly affect the rate constants of electrochemical reactions, thus also affects the Cu dissolution rate in the short-time voltage activation processing. However, in the case of long-time voltage processing time, the surfactant concentration of the Cu+ and Cu2+ ions reaches steady state where the Cu dissolution rate is no longer affected by the individual voltage processing time [9]. The remarkable features of Fig. 2 are that the Cu removal thicknesses are decreased and then increased at the application time of 60 s, this is a critical point that imply any meaningful discussion. In addition, the Cu removal thickness of NaNO3 electrolyte at the voltage operating time of 60s represents the minus value. That is, the minus(−) value refers to an increase in the weight due to the adsorption (deposition) of various reactants, metallic ions, and metallic hydroxides after the electrochemical reaction by voltage-activation process, while the plus(+) value indicates that the Cu weight decreased due to the desorption (stripping) of the Cu ions after voltage-activated treatments[17]. In addition, the relatively flat curve in Fig. 2 means that the Cu decomposition is inhibited in the KNO3 and NaNO3 electrolytes. Therefore, we were able to predict the deposition and stripping status of Cu+ and Cu2+ ions due to the changes in surfactant potential from the results of Fig. 2. These adsorption (oxidation process: Cu→Cu2++2e−) and desorption (reduction process: Cu←Cu2++2e−) mechanisms of Cu ions were confirmed by changes in the cathodic and anodic current peak values of I–V curves obtained using the CV method shown in Fig. 3.
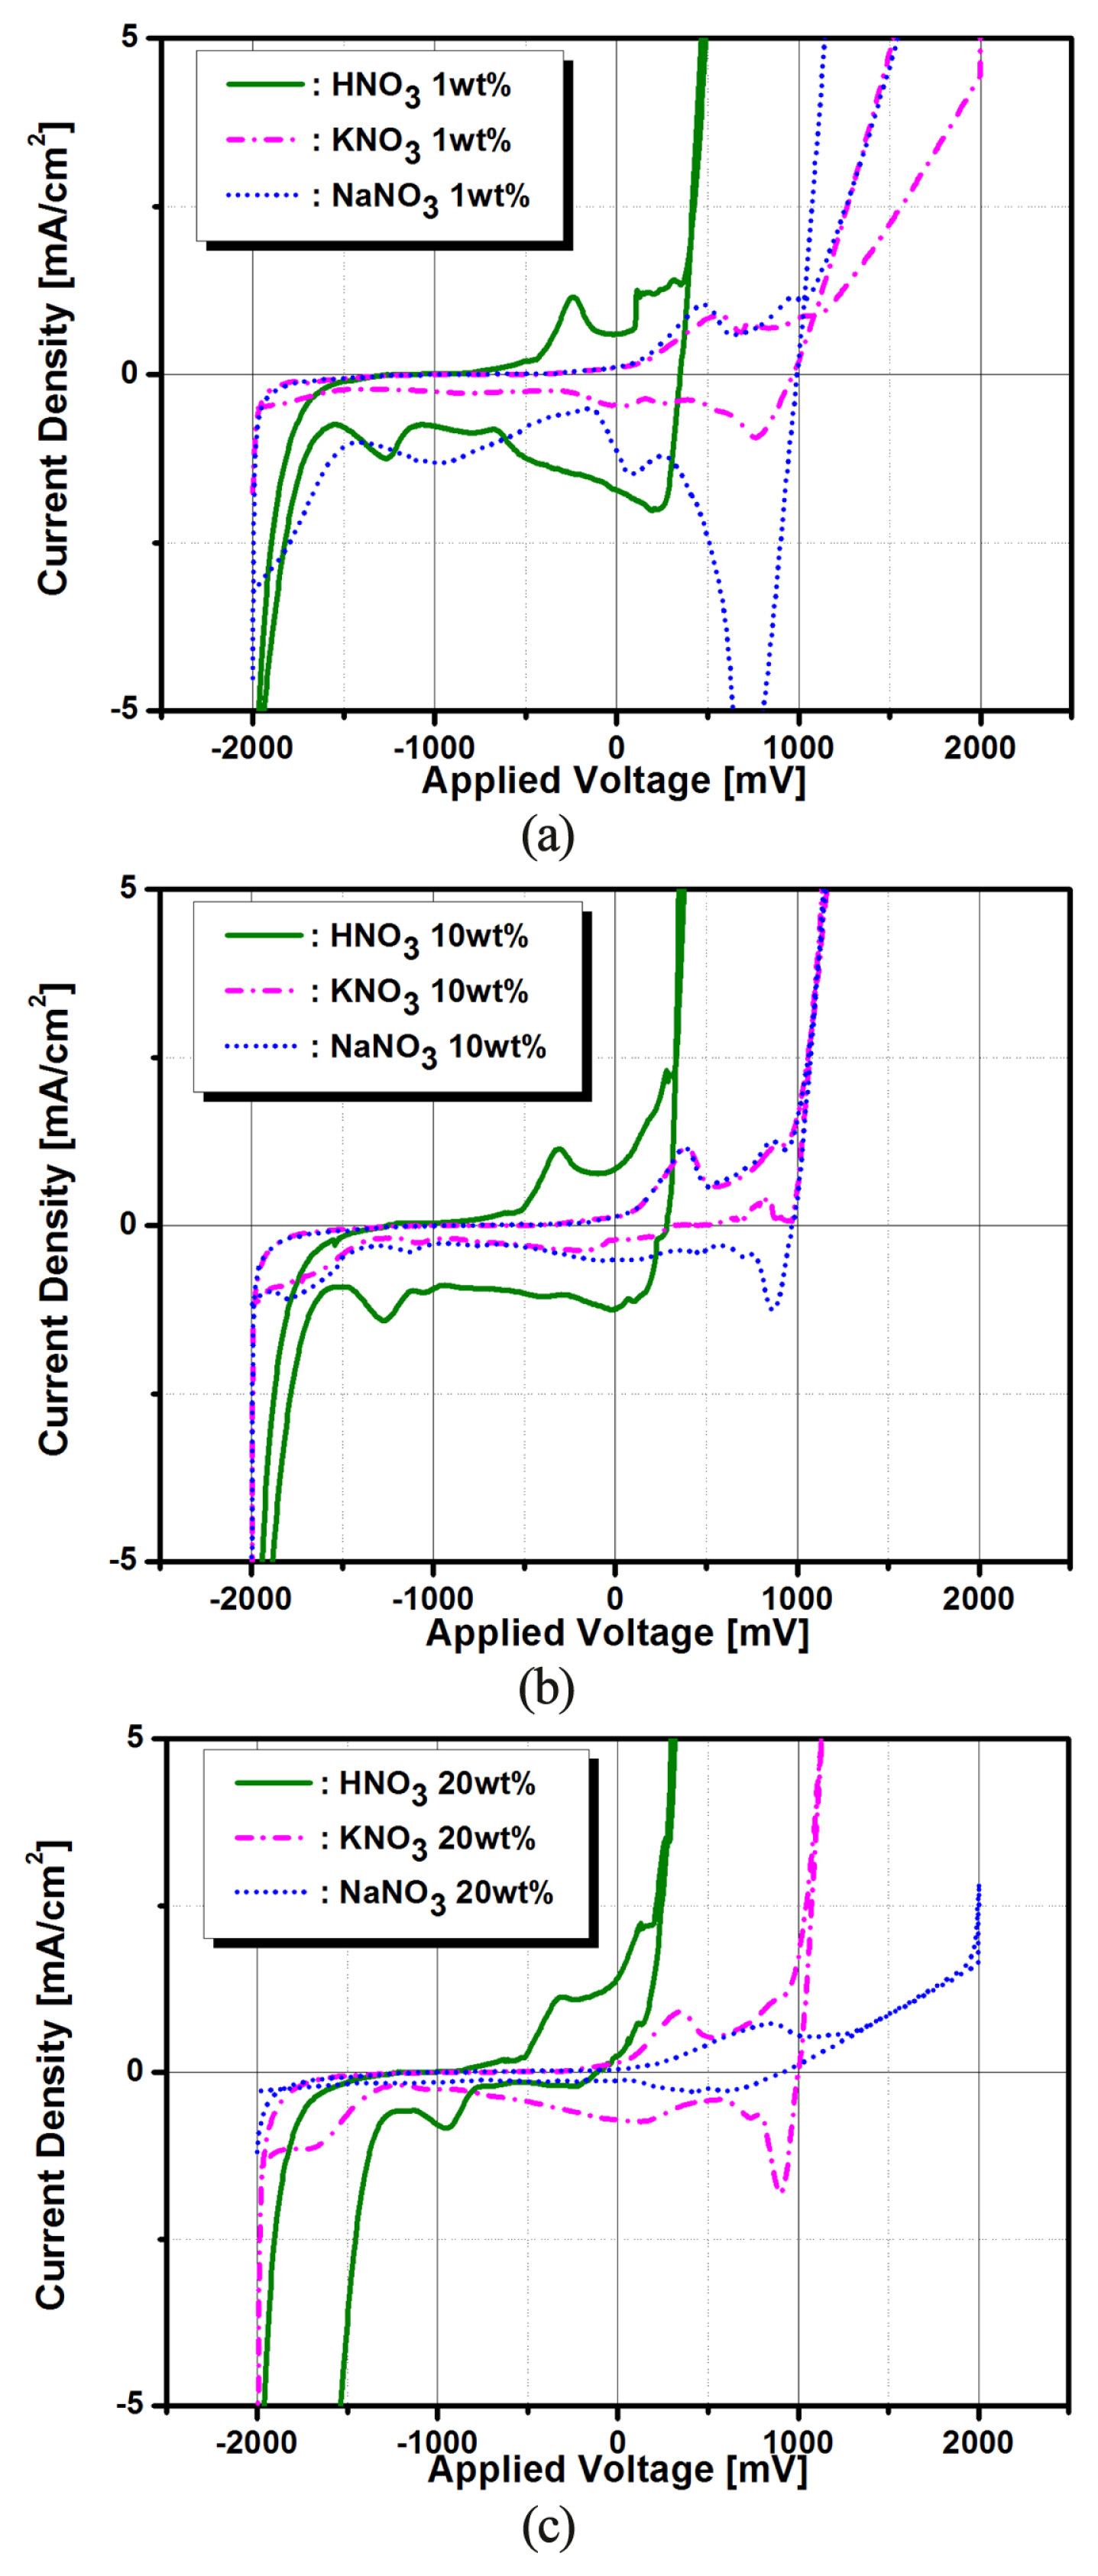
Cyclic voltammetry (CV) curves of Cu electrode as a function of HNO3, KNO3 and NaNO3 electrolytes concentration; (a) 1wt%, (b) 10wt% and (c) 20wt%.
Fig. 3(a), (b), and (c) show typical I–V plots of Cu samples obtained by CV method in three types of electrolyte with different concentration. CV method has become a very popular technique for initial electrochemical studies of new systems and has proven very useful in obtaining information about fairly complicated electrode reactions. When the voltage is scanned in a positive direction from −2,000 mV to +2,000 mV, these electrochemical reactions correspond to oxidation (R → O + ne−; Cu→Cu2++2e−) step. On the other hand, when the negative voltage is scanned from +2,000 mV to −2,000 mV, these electrochemical reactions correspond to the reduction (R←O+ne−; Cu←Cu2++2e−) step. Distinctly different signs of distinguishing the adsorption and deposition of Cu were observed in Fig. 3. The cathodic current peaks correspond to bulk deposition (BD) and under-potential deposition (UPD) of Cu2+ on Cu surface, whereas the anodic peaks represent stripping of bulk and under-potentially deposited copper [9,13,14,18]. Meanwhile, the two anodic peaks suggest that two structurally different crystal surfaces exist in the UPD layer, which is probably due to two dominant crystal faces on the surface of the polycrystalline Cu [18–20]. Fig. 3(a, b, and c) showed that the electrical behavior of the Cu electrode between −2,000 mV and +2,000 mV were non-faradaic current due almost entirely to double-layer charging. In summary, the voltage scans in the positive direction correspond to adsorption of Cu ions during oxidation of electrochemical reactions, while the voltage scans in the negative direction involve desorption of Cu during the process of reduction step. These distinct features were confirmed by the predominant XRD pattern of Cu (200) and Cu (220) shown in Fig. 4.
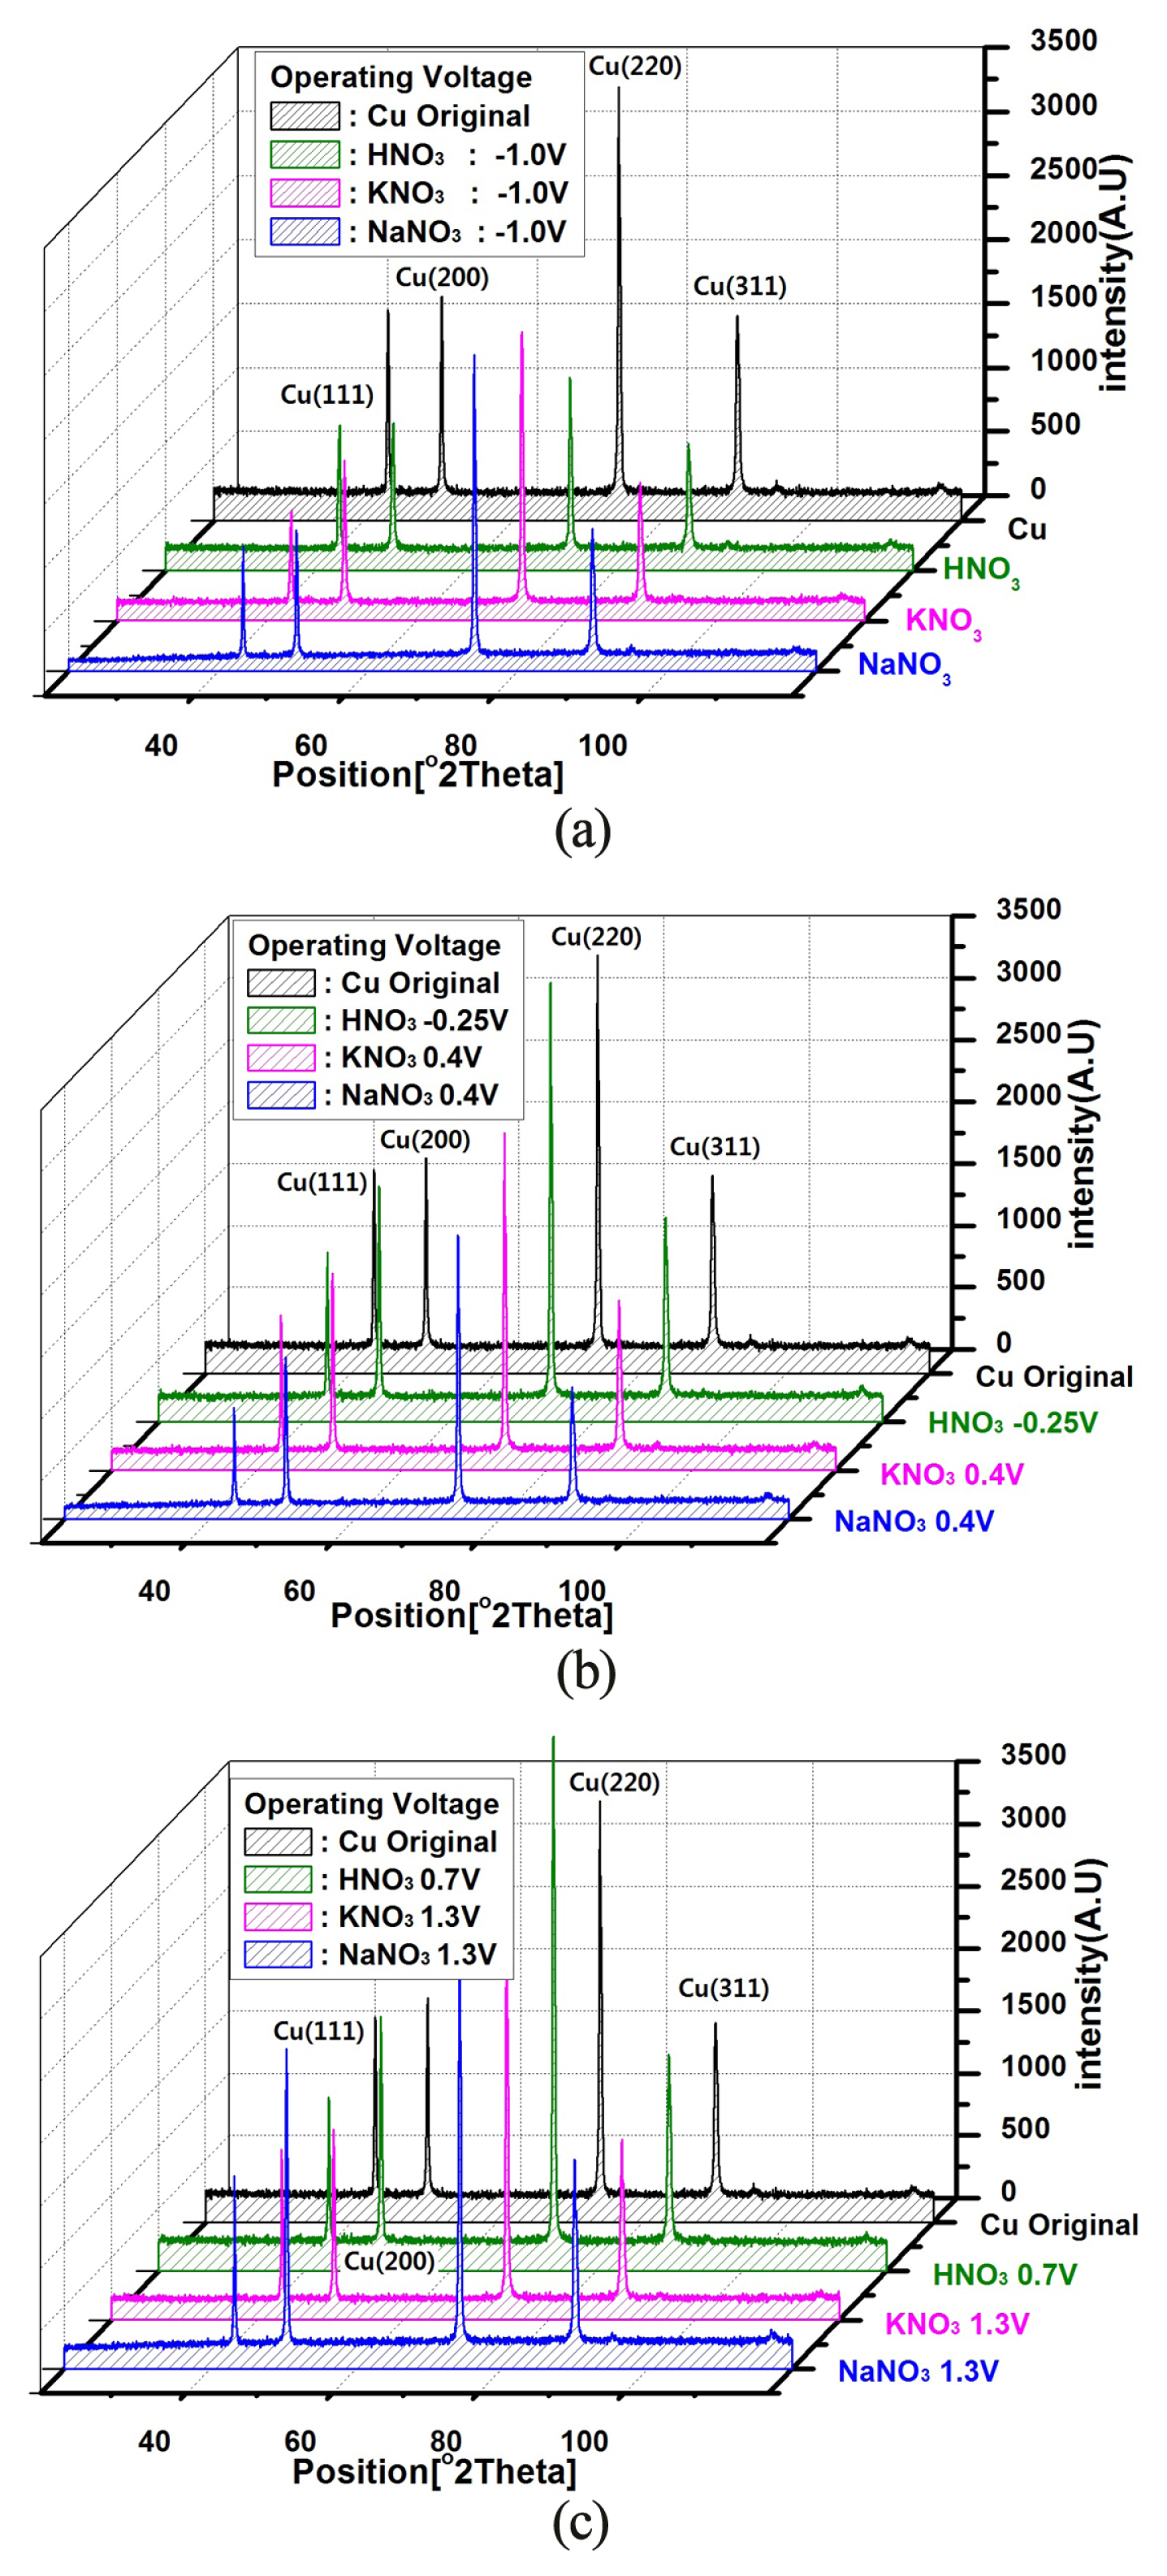
X-ray diffraction (XRD) patterns as function of operating voltage in the different (a) active, (b) passive and (c) trans-passive state of HNO3, KNO3 and NaNO3 electrolytes.
Fig. 4 compares the XRD patterns of the Cu electrodes before and after the electrochemical process by voltage-activation at different applied voltages. In the case of the original Cu electrode before applying voltage, a strong peak of Cu (220) was observed at 2θ=75°. At the same time, the three relatively weak peak values of Cu (111), Cu (200), and Cu (311) were generated at θ=42°, 2θ=50°, and 2θ=90°, respectively. However, the dominant peak of Cu (220) decreased dramatically after the active state voltage of −1.0 V was applied as shown in Fig. 4(a). This means that the chemical state of the Cu surface has changed with a voltage of −1.0 V corresponding to the voltage of the active state. In other words, this indicates that Cu ions such as Cu+ and Cu2+ are starting to peel-off. On the other hand, the peak of Cu (220) was increased again in the trans-passive state as shown in Fig. 4 (c). This indicates the re-adsorption of the Cu ions. It is assumed that the Cu ions produced by the decomposition of Cu in the electrolyte have electrochemically reactivated during the voltage-activation, repeating the process of adsorption and desorption. These observations were confirmed by positive and negative directional voltage scans on the CV curves shown in Fig. 3. In addition, the two anodic current peaks shown in Fig. 3 are derived from the two structurally dominant crystal faces (200) and (220) on the underlying polycrystalline Cu surface [18–20].
Fig. 5 shows a comparison of the contents of copper and oxygen obtained from metallurgical components of the Cu electrode using EDS analysis when different active, passive, and trans-passive voltage are applied. The copper content was the lowest in the passive state, while the oxygen content was the highest. In other words, it suggests that the Cu ions begin to peel off in the passive state. This is also the results of demonstrating the desorption mechanism of the Cu ions from the electrochemical Cu surface as shown in Fig. 3 [16–18]. In summary, it can be concluded that the Cu ions generated by the dissolution of Cu within the electrolyte are reactivating electrochemically through repetition of adsorption (re-deposition) and desorption (stripping) procedure during the voltage-activation.
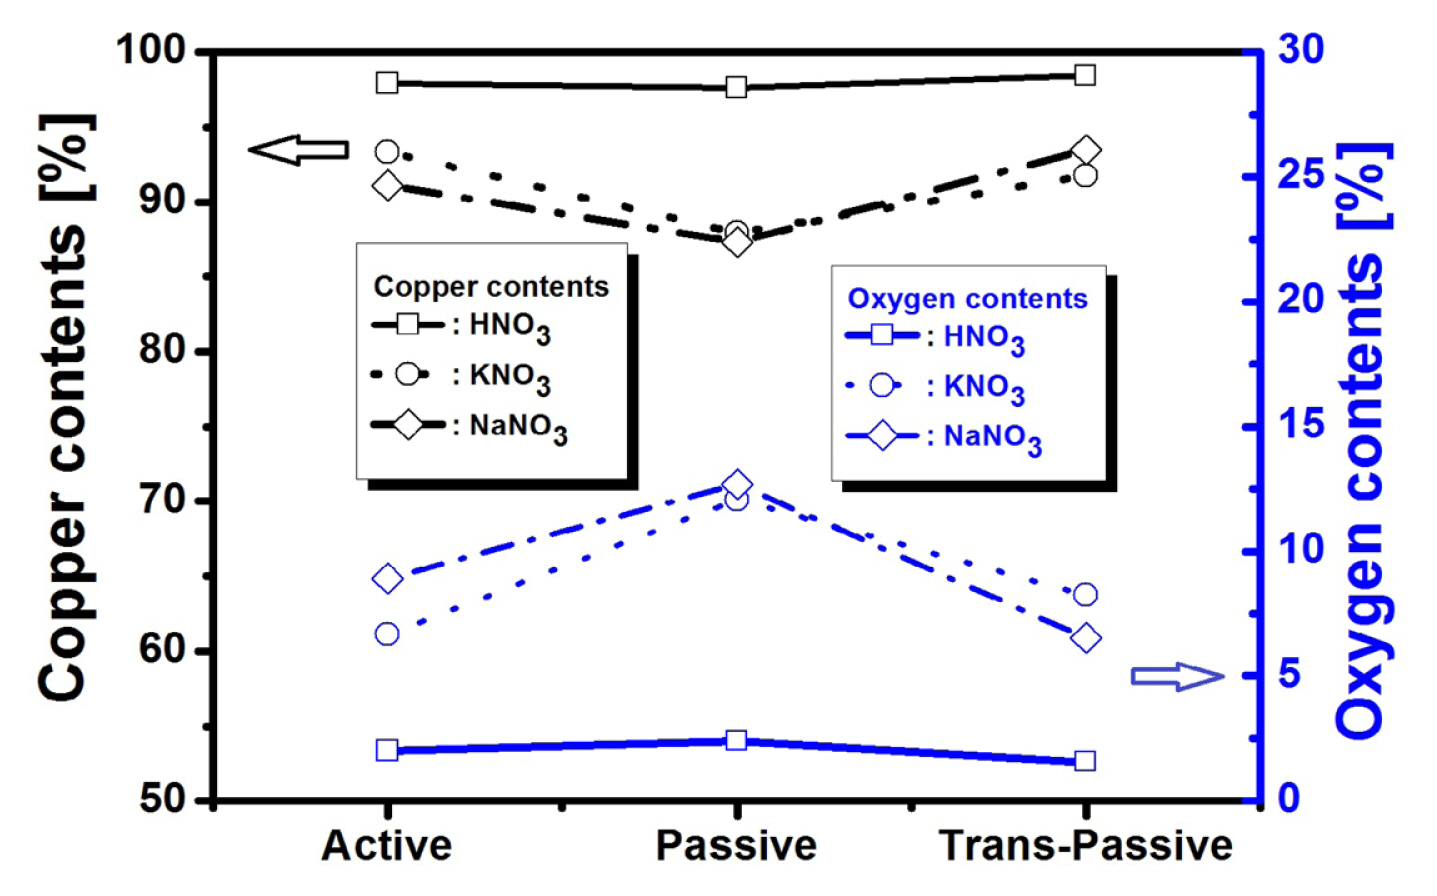
Oxygen and copper contents obtained from metallurgical compositions of Cu by energy dispersive spectroscopy (EDS) analysis in the HNO3, KNO3 and NaNO3 electrolytes with different concentration.
4. Conclusions
The removal characteristics of Cu from the surface with various electrochemical reactions by voltage-activation were reviewed to assess the possibility of ECMP application in three types of electrolytes, such as HNO3, KNO3 and NaNO3. From the I–V curve obtained by LSV and CV method, the optimal process parameter such as the applied voltage, operating times and concentration of electrolyte were determined before the subsequent ECMP process. The adsorption (deposition) and desorption (stripping) mechanism of Cu electrode by DC voltage-activation was also investigated. Distinctly different sign of deposition (adsorption) and stripping (desorption) of Cu are observed. The cathodic current peaks correspond to adsorption of Cu2+, whereas the anodic peaks correspond to desorption of bulk and under-potentially deposited copper. Electrochemical mechanisms in active, passive, and trans-passive states were observed and confirmed by XRD and EDS analyses. Because the characteristics and analyses of electrochemical Cu surfaces proposed in this study are a good methodology for finding optimal electrochemical process parameter, the above mentioned results will provide an accurate control of material removal rates (MRR) in ECMP applications.
Acknowledgment
This work was supported by the Sehan University Research Fund in 2020.