Comparative study on Corrosion Inhibition of Vietnam Orange Peel Essential Oil with Urotropine and Insight of Corrosion Inhibition Mechanism for Mild Steel in Hydrochloric Solution
Article information
Abstract
The corrosion inhibiting mechanism of Vietnam orange peel essential oil (OPEO) for mild steel in 1 N HCl solution was investigated elaborately. Corrosion inhibition ability of OPEO was characterized by electrochemical polarization, electrochemical impedance spectroscopy (EIS), and weight loss method. In the corrosive solution, OPEO worked as a mixed inhibitor and the inhibition efficiency of OPEO increased with the increase of its concentration. High inhibition efficiencies over 90% were achieved for the concentration of 3 – 4 g/L OPEO, comparable to that of 3.5 g/L urotropine (URO), a commercial corrosion inhibitor for acid media used in industry. By using adsorption isotherm models (Langmuir, Temkin and Frumkin), thermodynamic parameters of adsorption were calculated. The obtained results indicated physical adsorption mechanism of OPEO on the steel surface. The components responsible for the corrosion inhibition activity of OPEO were not only D-limonene, but also other compounds, which contain C=O, C=C, O-H, C-O-C, -C=CH and C-H bonding groups in the molecules.
1. Introduction
Nowadays, acids have been commonly used in industry. Several their significant application fields involve acid pickling for steel, chemical cleaning and processing, ore manufacture and acidizing oil wells [1–3]. Facilities in industrial plants originate from ferrous metal materials. Therefore, occurrence of corrosion phenomenon is unavoidable. Utilization of inhibitors to control corrosion is indispensable. Corrosion inhibitors not only work to prevent metal dissolution but also reduce acid consumption. Most of popular acid inhibitors are organic compounds containing O, S, N atoms and/or multiple bonds which enable adsorption on the metal surface [3–6]. However, in addition to the advantage of good inhibitive efficiency, the traditional inhibitors show some disadvantages, for example, being mostly synthetic, expensive, non-biodegradable and harmful compounds for environment and living creatures.
Many attempts have been made to find green inhibitors, which are ecologically friendly and readily available. In recent years, researches on the use of natural products such as plant extracts have attracted much attention due to their availability in natural source, biodegradability, low cost and especially non-toxicity. Some notable successes have been achieved in the use of extracts derived from different parts of the plants including leaves [7–10], seeds [8,11,12], juice and stem [12], bark [13], peels [7,14–17], root [18] and tubers [19,20] as efficient green inhibitors for metals corrosion in aggressive environments. Besides, other natural product such as natural honey [21] as well as some eco-friendly pharmaceutical compounds (cef tazidime, cefadroxil, lornoxicam and tenoxicam, etc. [22–24] have been also studied.
Vietnam is one of the tropical countries, with the favorable weather for diverse fruit trees, for instance orange trees. Actually, Vietnam has been ranked in the highest top 20 countries providing orange fruits on the world, mostly for beverage industry. Unfortunately, orange peels are often discarded after juicing process. Few previous reports showed that the orange peel extract is effective corrosion inhibitor for mild steel in acids [7,14–16]. However, these studied results are not systematic and controversial about adsorption isotherm. Moreover, there is no evidence to support the presence of organic film on the metal surface acts as corrosion inhibitor. With the aim of enhancing the economic value for Vietnam orange as well as finding out an eco-friendly corrosion inhibitor to substitute the traditional inhibitors used in the industry, in this present work we focus on investigating corrosion inhibition activity as well as elucidating inhibition mechanism of Vietnam orange peel essential oil (OPEO) for mild steel in hydrochloric acid. Especially, the presence of organic film from OPEO on the metal surface was considered by using the combination of electrochemical techniques (EIS, potentiodynamic) and physicochemical methods (SEM/EDS, GCMS and FTIR).
2. Experimental
2.1 Materials and solutions
The mild steel samples with compositions of 0.198% C, 0.459% Mn, 0.018% P, 0.035% S, 0.151% Si, 0.024% Cu, 0.014% Nb and Fe in balance were used as studying electrode for corrosion experiments. The exposed surface area of 0.5 cm2 was fixed. Other cylindrical mild steel samples with 8 mm in diameter, and 2.5 cm in length were also prepared for determination of corrosion rate using weight-loss method. After being polished carefully by different sand papers from 100 to 1500 grade, the surface of the steel samples was degreased with soap, rinsed in distilled water, and dried by an ethanol-impregnated plotting paper.
OPEO used in the present study was extracted from the outer skin of orange peel (collected from Bo Ha commune, Bac Giang province of Vietnam) by steam distillation method. In specific, 200 g of the outer skin of orange peel was cut into small pieces, and then ground with 200 mL of water in a blender. The resultant smoothie was transferred into a corning Pyrex borosilicate glass round bottom distilling Flask. The distillation process was conducted at the temperature of 98°C and only finished when the temperature reached 100°C corresponding to the boiling point of pure water component. The distillate including water and essential oil was condensed after flowing in a coil distillate condenser and collected in an Erlenmeyer flask. Subsequently, OPEO was separated from the distillate by removing the water layer with the higher density at the bottom. Finally, the trace of moisture in OPEO was removed completely using Na2SO4 powder. The extraction yield was about 1%. The composition of the OPEO was analyzed by GCMS method (GCMS 2010, Shimadzu, Japan).
The test solutions were 1N HCl acidic solutions containing OPEO with various concentrations in a range of 0 to 4 g/L. Analytical grade 36% HCl acid (d = 1.18 g/mL, Sigma Aldrich) was used as received without further purification. For comparison, a solution of 1N HCl containing 3.5 g/L hexamethylenetetramine (urotropine - URO) [25], a popular traditional inhibitor, was prepared as well.
2.2 Methods
Corrosion inhibition of OPEO for the mild steel in the test solutions was examined by electrochemical techniques such as potentiodynamic polarization and electrochemical impedance spectroscopes (EIS). In addition, weight-loss method was employed to assess corrosion rate of the mild steel with the absence and presence of OPEO inhibitor in the temperature range from 15 to 65°C.
For electrochemical measurements, prior to each measurement the steel electrodes were immersed in the acidic solution of 1N HCl in 30 mins to get the stable state. All the electrochemical tests were conducted using Autolab PGSTAT 302N (Netherlands) with a conventional three-electrode cell, where a platinum mesh as counter electrode, and the silver/silver chloride electrode (Ag/AgCl/Sat. KCl) as reference-electrode. Polarization measurements were carried out at the potential in range of −300 mV to +300 mV vs. OCP at a scanning rate of 5 mV/s. Electrochemical impedance measurements were conducted at free corrosion potential of with an amplitude of 10 mV at the frequency in a range of 10 kHz ÷ 5 mHz. The inhibition efficiency was calculated according to two distinct equations based on Tafel extrapolation results (Hi) and EIS analysis (HR) as follows:
Where
Corrosion rate of the mild steel was determined through weight-loss measurement. The steel samples were immersed in the test solutions for different immersion time. Their weight before and after corrosion was recorded precisely using a balance (TE214S, Germany) with an accuracy of 10−4 g. The corrosion rate (W) was calculated as follows:
Where S is the surface area of the sample (cm2); m1, m2 are the weight of the sample before and after corrosion (mg), respectively; t is the immersion time (h).
The inhibition efficiency was calculated from weight-loss measurement (HW) according to as follow:
Where, W0 and W are corrosion rate of mild steel in the solution without and with inhibitors (mg.cm−2·h−1), respectively.
Moreover, the thermodynamic functions and adsorption characteristics of OPEO on the steel surface were determined and discussed.
Microstructure of the samples was investigated using Scanning Electron Microscope (SEM, JEOL 6490, Jed 2300, Japan) equipped by energy dispersive spectrometer (EDS). Surface chemistry of the mild steel samples was inspected by Fourier Transform Infrared Spectroscopy (FTIR, Nicolet 6700 FTIR, USA).
The comparison of corrosion inhibition behaviors of OPEO with URO were conducted by potentiodynamic polarization, weight-loss method and SEM images.
3. Results and Discussion
3.1 Essential oil composition verification
To clarify the corrosion inhibition mechanism of OPEO inhibitor for the mild steel in 1N HCl solution, firstly, the chemical composition of OPEO should be identified. Table 1 lists analysis results of compositions of OPEO originated from Vietnam using GCMS method.

The composition of OPEO analyzed by GCMS method
As seen, OPEO contains about 30 different compounds, among which D-limonene (C10H16) is predominate with the highest content up to 92.85%. The rest compounds of OPEO have the negligible content. In general, all the constituent compounds contain three elements viz. C, H and O and functional groups such as C=C, C=O, O-H, -O- and aromatic rings. The average molecular weight of the OPEO (MOPEO) calculated according to the composition and content of the compounds presented in OPEO is 136.47 g/mol.
3.2 Corrosion inhibition of OPEO and comparison with URO
To investigate dynamics of corrosion process of the mild steel with the presence of OPEO inhibitor and compare with URO, the polarization curves in the different test solutions were recorded and displayed in Fig. 1.

Polarization curves of the mild steel in 1N HCl solution without and with different concentration (1÷4 g/L) of OPEO and 3.5 g/L URO
As seen from the Tafel curves, the corrosion potentials of the mild steel in the solutions with the presence of the inhibitors including OPEO and URO are a bit less negative (about 20 mV) than that in the absence of the inhibitors. The shifts are less than 80 mV, which is one of the signals of a mixed inhibition [26, 27]. In addition, both cathode and anode branches of the Tafel curves shift towards to the direction of lower current density. This demonstrates that OPEO and URO both alleviated anodic dissolution reactions and arrested cathodic hydrogen evolution reactions. This may result from adsorption of OPEO and URO on the whole corroding surface [28]. Accordingly, OPEO and URO worked as mixed inhibitors and restricted corrosion of the mild steel in the 1N HCl acid.
Table 2 enumerates values of corrosion potential (Ec), corrosion current density (ic) as well as anodic and cathodic Tafel slope (ba and bc) obtained using Tafel extrapolation method. As seen, corrosion current density of the steel sample significant decrease in 1N HCl solution in the precence of inhibitors. In particular, in the presence of 1g/L OPEO the corrosion current density was 62.14 mA/cm2, which is half as high as that in the absence of OPEO.

Potentiodynamic polarization parameters for the mild steel in 1N HCl solution with and without inhibitors.
As the concentration of inhibitor was increased, the corrosion current density of the mild steel decreased. Remarkably, in comparison with the sample without the inhibitors, the ic value of the sample with 4 g/L OPEO decreased more than fifteen times. Mean-while, the ic of the sample with the commercial inhibitor of 3.5 g/L URO only diminished more than six times, even inferior when using OPEO.
Besides, the change in the cathodic Tafel slope value in the presence of inhibitors also demonstrates effect of the inhibitor on the kinetics of the hydrogen evolution. As the previous report, a slight increase in the anodic Tafel slope is related to adsorption of chloride ion and/or inhibitor molecules on the metal surface [22]. According to Eq. (1), inhibition efficiency Hi was calculated and shown in Table 2. Interestingly, at the concenctrations of 3–4 g/L, OPEO showed the inhibition efficiency over 92 %, even higher than that of the traditional corrosion inhibitor of URO (84.2 %), which was used at the standar concentration of 3.5 g/L for acid pickling of the steel. This demonstrates excellent inhibition ability of OPEO.
The weight-loss measurement was also conducted to compare the inhibition efficicency of OPEO with the traditional inhibitor URO for the mild steel in the 1N HCl acid after different immersion times and the results were shown in Fig. 2. The studied resutls indicate that HW of OPEO and URO are approximately after all testing time and trend to lightly increase with time and reach the stable value of about 90% after 6h immersion time in the 1N HCl acid.

The inhibition efficiency of OPEO and URO for the mild steel in the 1N HCl acid after different immersion times
Moreover, the morphology comparison of the sample surfaces by SEM images was shown in Fig. 3. A smooth surface in the mild steel sample before examination (Fig. 3A) and a pitted surface after immersion in 1N HCl solution (Fig. 3B) were observed. The Fig. 3 (C and D) reveal a smooth surface with smaller and shallower pits for the samples in the solution with the inhibitors 3 g/L OPEO and 3.5 g/L URO. The pitting corrosion of mild steel in 1N HCl solution with the presence of OPEO or URO is approximately and they are much lower than that in the blank solution. This is entirely consistent with the results of inhibition efficiency of OPEO and URO estimated by the previous electrochemical and weight-loss measurement. This suggests that OPEO and URO can effectively inhibit pitting corrosion of mild steel in 1N HCl solution.
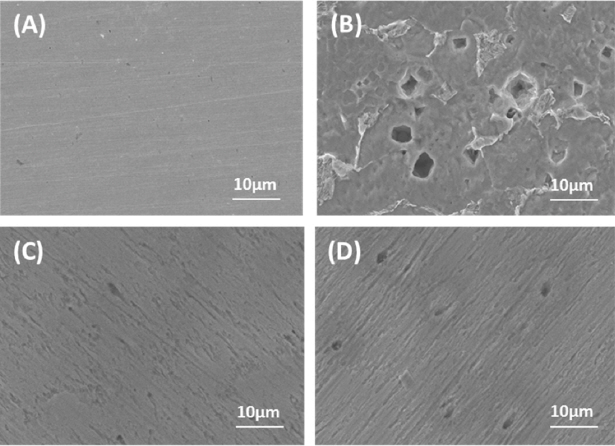
SEM images of the mild steel surface before and after 1h of exposure in 1N HCl acid at 25 °C: (A) before; (B) after corrosion in the blank solution; (C) after corrosion in the presence of 3 g/L OPEO; and (D) after corrosion in the presence of 3.5 g/L URO
In order to investigate the corrosion inhibitor mechanism of OPEO, EIS spectra of the mild steel in the absence and presence of OPEO inhibitor were measured. As shown in Fig. 4A, Nyquist spectra of the mild steel are composed of two semicircles: a capacitive semicircle in the high-to-medium frequency range, and an inductive semicircle at the low frequency range. The capacitive semicircle represents charge transfer of the corrosion process while the inductive semicircle represents the relaxation process of adsorption (ads) of species such as H2O, Cl− and H+ and/or organic molecules of OPEO on the electrode surface. In general, the presence of OPEO in the corrosive solution hardly changed appearance of Nyquist spectra demonstrating the similar corrosion mechanism of the mild steel in the studied solutions. Noticeably, the diameter of two semicircels of Nyquist plots increased with increasing OPEO concentration in the test solutions. This suggests the formation of protective film resulting in adsorption of the inhibitor molecules on the surface of mild steel. Accordingly, the active surface area of the mild steel was probably reduced and its corrosion resistance was enhanced.
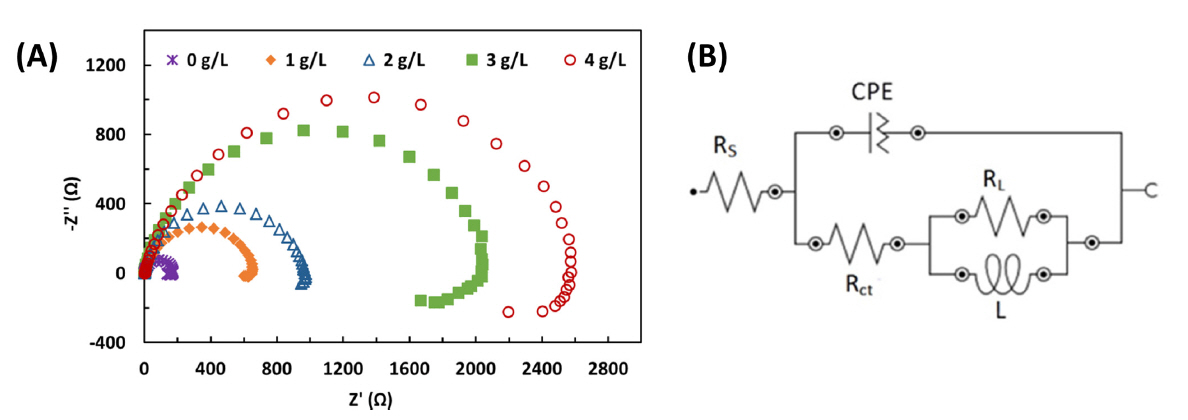
(A) Nyquist plots of the mild steel in 1N HCl solutions in the absence and presence of OPEO with various concentrations (1÷4 g/L); (B) Relevant equivalent circuit model used for fitting measured impedance data. Rs is solution resistance; Rct is charge transfer resistance; CPE is the constant phase element; RL and L are inductive parameters
Further, to simulate accurately corrosion process occuring, an equivalent circuit was used (Fig. 4B). Since the capacitive semicircle is depressed but not perfect one, constant phase element (CPE) was utilized to substitute double layer capacitance (Cdl) as well-known. The depressed semicircle is obtained as a result of surface heterogeneity caused by surface roughness, dislocation, distribution of active sites, or adsorption of the inhibitor molecules [22]. Apart from solution resistance (Rs), charge transfer resistance (Rct), and constant phase element (CPE), the parallel combination of L and RL was also introduced into the equivalent circuit to explain the inductive semicircle observed in the Nyquist spectra [29,30].
After fitting the equivalent circuit, several typical parameters such as Rs, Rct, Yo, and n of EIS spectra were recorded in Table 3. Especially, the parameter Cdl in Table 3 was calculated based on the values of CPE and Rct parameters through the following equation:

EIS parameters for the mild steel in 1N HCl solution in the absence and presence of OPEO fitted by the equivalent circuit
Wherein, Y0 is proportional factor, and n is the phase shift. A couple of Y0 and n are two feature parameters of the CPE [31].
As shown in Table 3, the charge transfer resistance of the mild steel remarkably increased after addition of OPEO in the test solution. In specific, in the presence of 4 g/L OPEO the charge transfer resistance increased nearly sixteen times in comparison with that in the absence of OPEO. The increase in Rct values is attributed to the formation of the protective film of the inhibitor on metal/solution interface in the corrosive solution in the presence of OPEO. Moreover, better anti-corrosion behavior was observed for the samples in the test solution containing higher OPEO concentration. Meanwhile, double layer capacitance Cdl showed a decreasing tendency when OPEO inhibitor was added further in the test solution. According to literature [5,12,27], the change in the Cdl value is possibly accounted for a gradual replacement of previously adsorbed molecules by adsorption of the organic molecules of OPEO on the steel surface. This led to a decrease in local dielectric constant and/or an increase in the thickness of the electrical double layer. As a result, the double layer capacitance decreased. Thus, this can be considered as evidence for the presence of adsorbed layer of inhibitors on the steel surface. Other side, the value of n parameter in Table 3, which reflects degree of the surface heterogeneity [29], is found to diminish with the concentration of OPEO in the test solution. This implies better surface homogeneity degree obtained owing to the adsorption of inhibitor molecules on the active sites at the steel surface. Accordingly, the corrosion of the mild steel can be retarded.
In addition, inhibition efficiency HR of OPEO was also determined based on the Eq. (2). From Table 3, it is easily recognized that when the concentration of OPEO increased from 1 g/L to 4 g/L, inhibition efficiency HR enhanced from 75.3% to 93.6%. Especially, as the concentration of OPEO reached 3 g/L, the inhibition efficiency of OPEO was higher than 90%. The obtained result is consistent with that calculated from Tafel extrapolation method above. Hence, it is possible to believe that OPEO acts as an excellent corrosion inhibitor with the high inhibition efficiency when added to the corrosive solution with a reasonable amount. The corrosion inhibition behavior of OPEO is likely to stem from the adsorption of OPEO molecules on the steel surface.
3.3 Insight of inhibition mechanism of OPEO
3.3.1 Adsorption characteristics
In fact, adsorption property of the inhibitors is concerned with numerous factors such as the nature and state of the metal surface, the type of corrosive medium (neutral, alkaline or acidic media), physicochemical properties of the inhibitor molecule and molecular electronic parameters as well as the adsorption species [4,32–34]. To understand the inhibition mechanism of OPEO for corrosion reactions, adsorption isotherms should be involved. In this work, the adsorption property of OPEO on the steel surface in the test solutions was examined by three different isotherm models including Langmuir, Temkin and Frumkin isotherms as the follows [32,35–37]:
Wherein θ is degree of surface coverage, K is the adsorption-desorption equilibrium constant, C is the inhibitor concentration, f and a are parameters related to adsorbing interaction.
Determination of the degree of surface coverage (θ) is based on assumption that the double layer capacitance is proportional to the surface fraction not covered by the inhibitor, or the charge transfer resistance is proportional to the surface fraction covered by the inhibitor [13,15,35]. The fraction of the steel surface covered by the inhibitor was determined by weight-loss method, based on the following equation:
Wherein W and W0 are the corrosion rate of the steel sample in the presence and absence of the inhibitor in the test solution, respectively.
Fig. 5 depicts change of surface coverage of the mild steel in the test solution containing OPEO with various concentrations at 25°C. Obviously, the θ value of the mild steel increased after addition of OPEO to the test solution. Nevertheless, the degree of surface coverage was found to reduce slightly just after the concentration of OPEO reached 3 g/L. This might be elucidated that when the OPEO concentration got over the optimum, a thick adsorption layer was formed on the steel surface. At some certain sites, this adsorption film was probably exfoliated partly. Accordingly, the degree of surface coverage decreased slightly when the concentration of OPEO increased up to 4 g/L. The similar phenomenon coverage was found as for the samples measured in the temperature range of 15~65°C.
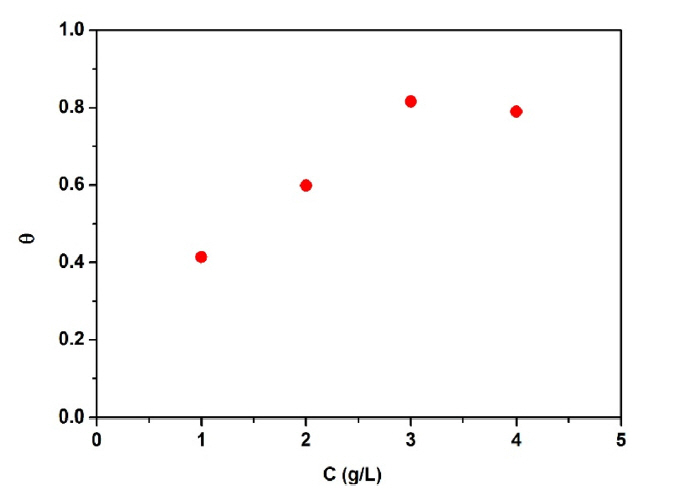
Dependence of surface coverage of the mild steel on the concentration of OPEO added in the test solutions.
Fig. 6 illustrates various adsorption isotherm plots of the steel in the test solutions at the temperatures from 15 to 65°C. As seen in Fig. 6A, B, Langmuir and Temkin isotherms plots, which are different from Frumkin isotherm plots (Fig. 6C), fit the experimental data well. This is reflected by R correlation coefficient (R ≥ 0.8 in Langmuir and Temkin isotherms plots).
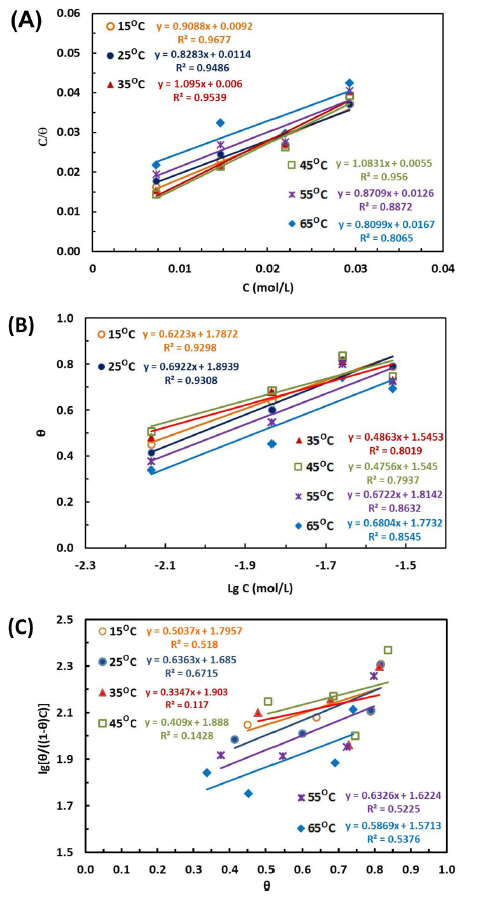
Isotherm adsorption of inhibitor on the surface of the mild steel in 1N HCl at different temperatures: (A) Langmuir isotherm; (B) Temkin isotherm and (C) Frumkin isotherm
Although Langmuir isotherm provides the best description of the adsorption behavior of OPEO among three adsorption isotherm models owing to the high correlation coefficient, the slopes of Langmuir isotherm plots obtained in Fig. 6A are more or less than unity. This implies real adsorption of OPEO did not completely obey all the assumptions required for Langmuir adsorption isotherm. It is likely that there was existence of multilayer adsorption of the inhibitor molecules or lateral interactions between the adsorbed species and the mild steel surface. Thus, the calibrated Langmuir equation as below was applied in this work [36–38]:
where m is a linear calibrated coefficient.
The adsorption free energy was calculated according to the following equation [13,39]:
Where ΔGads is the adsorption free energy, R is the ideal gas constant, 55.5 is the water concentration and T is the temperature and the adsorption-desorption equilibrium constant (K) is determined from the slope of the Langmuir and Temkin isotherm.
After calculation, the values of adsorption free energy ΔGads of the mild steel at different temperatures are listed in Table 4. As seen, the ΔGads range of −20.62 ~ −24.59 kJ/mol accounts for Langmuir isotherm model and of −25.45 ~ −29.03 kJ/mol for Temkin isotherm model at the investigated temperature of 15°C ~ 65°C. The negative values of ΔGads suggest that the adsorption of OPEO on the steel surface occurred spontaneously. Alternatively, according to the previous reports ΔGads > −40 kJ·mol−1 represent the physical adsorptions and ΔGads <−40 kJ·mol−1 represent chemisorption phenomenon [15,35,40]. In this work, all the obtained values of ΔGads are higher than −40 kJ/mol, demonstrating physical adsorption nature of OPEO. This result totally coincides with the previous reports on the adsorption of citrus leaves extract and limonene [15,41] as well as other green inhibitors [11,13,39] on mild steel in acid media.

The adsorption-desorption equilibrium constant K (M−1) and adsorption free energy ΔGads calculated Langmuir and Temkin models
3.3.2 The formation of adsorption film and inhibitive compositions
To clarify the superficial element composition of the adsorbed film on the surface of the mild steel in the presence of OPEO, the samples were analyzed by SEM and EDS. Remarkably, prior to analysis the surface of the samples was rinsed or not. The steel surfaces were degreased with soap, rinsed under flow of tap water and re-rinsed in distilled water. The surfaces were then dried by blotting paper with alcohol and hot dry. Fig. 7 shows SEM images of the mild steel surface before and after 1 h of immersion in the test solutions with and without 3 g/L of OPEO. In contrast with the quite smooth surface of the mild steel before corrosion (Fig. 7A), the sample immersed in the test solution without OPEO (blank solution) shows the heavily deteriorated surface with very dense pits (Fig. 7B). Generally, the corrosion pits were formed at the grain boundary regions, where the surface energy is favorable [42]. Appearance of corrosion pits represents pitting corrosion type of the steel in the solutions containing aggressive anions like Cl−. After rinsing, the corrosion pits seem to expose clearly (Fig. 7C, D). Additionally, indicated white regions corresponding to accretion of the corrosion products on the steel surface was excluded partly. On contrary, the sample in the presence of OPEO inhibitor possessed a relatively smooth surface (Fig. 7E), similar to the pristine steel surface.
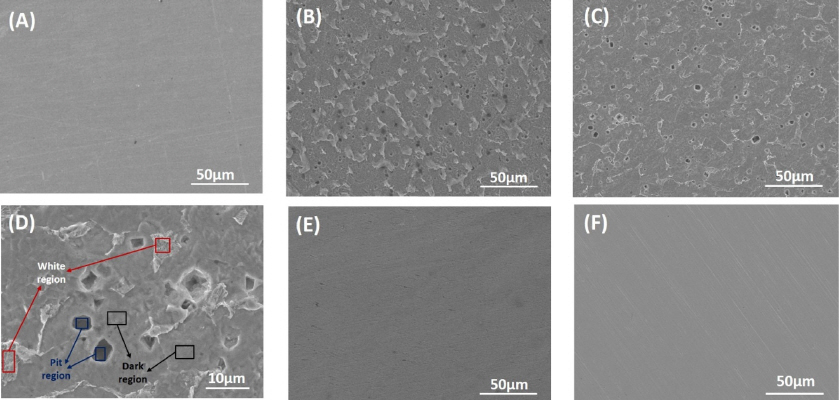
SEM images of the mild steel surface before and after 1h of exposure in acid 1N HCl with and without 3 g/L OPEO at 25°C: (A) pristine; (B) after corrosion in the blank solution; (C) and (D) after corrosion in the blank solution followed by rinsing; (E) after corrosion in the presence of OPEO; and (F) after corrosion in the presence of OPEO followed by rinsing
After rinsing the rough surface, however, was observed (Fig. 7F). Several small corrosion pits were detected. This is explained by removal of corrosion products as well as the protective film formed by adsorption of OPEO on the steel surface after rinsing. Hence, in the presence of OPEO in the corrosive solution, the surface deterioration of the mild steel decreased significantly. This is due to formation of the protective film resulting from adsorption of OPEO on the mild steel surface. Accordingly, the attack of corrosion agents could be conquered. The obtained results from SEM analysis are in high agreement with the results from electrochemical measurements. This demonstrates that OPEO can inhibit the pitting corrosion of mild steel in 1N HCl solution.
Table 5 presents EDS analysis data of the steel surface with and without 3 g/L of OPEO at selected different position corresponding to SEM images in Fig. 7.

The compositions of the mild steel surface before and after corrosion in the test solutions in the absence and presence of 3 g/L OPEO inhibitor.
As for the sample immersed in the blank solution, apart from main elements of carbon steel such as C, Si, S, Cr, Cu and Fe, other elements including O and Cl were detected. The presence of O and Cl elements represents the corrosion products, viz. FeCl2, FeClOH [42,43]. Especially, O content (5.79%) and Cl content (0.12%) at the corrosion pit region were higher than that at other regions. Their content reduced after the sample was rinsed.
For the sample in the presence of OPEO inhibitor, as expected the content of C (7.58%) on the corrosed steel surface is much higher than that (1.77%) of the sample in the absence of OPEO. This is evidence for the presence of the organic protective film on the surface of the mild steel after addition of OPEO to the corrosive solution. It is noticeable that after rinsing the C content at every region selected for analysis decreased suddenly. In particular, the C content decreased from 7.58% to 0% (not detected) on the whole surface. This implies that the organic protective film as well as the corrosion products was removed out of the steel surface after the rinse. However, the trace of C element was still found at some certain positions such as dark regions or pits.
In fact, in the presence of OPEO the high content of C and Cl elements was recorded to be highest at the dark region (indicated in Fig. 7D), which is much far different from that analyzed at the white region and the pit region. This demonstrates totally inhomogeneous adsorption of OPEO on the steel surface. Herein, the high content of Cl is probably attributed to synergic effect of OPEO and halogen-containing compounds which promotes the adsorption of the inhibitor on metal surface [35]. After rinsing, the surficial composition of the steel surface after corrosion in the presence of OPEO was similar to the pristine sample, indicating that steel surface was protected relatively efficiently from corrosion in 1N HCl acid. EDS results also confirmed that the formation of protective film on the steel surface in the HCl acidic solution with OPEO is due to the adsorption of the constituents of OPEO which contain C and O elements (Table 1), thus inhibiting the steel corrosion process.
To further verify the chemistry surface property of the adsorbed and protective film on the mild steel surface in the solution with OPEO inhibitor, the sample was examined by FTIR method. Fig. 8 shows the FTIR spectrum of the film separated from the steel surface after 24 h of immersion in 1N HCl solution with 3 g/L OPEO at 25°C. Analysis results from FTIR spectrum is also listed in Table 6.

FTIR spectrum in the region of 400–4000 cm−1 of the film formed on the mild steel surface after 24 hour immersed in 1N HCl solution with 3 g/L OPEO at 25°C

Data analysis of FTIR spectrum of the absorption film formed on the steel surface
It is worthy to see that important adsorption bands at 1629.1 cm−1 and 1763.6 cm−1 correspond to C=C and C=O stretch, respectively. Moreover, the presence of C-H stretch at 2959.7 and 2924.3 cm−1 could be found from the spectrum as well. The feature absorption peak of O-H and =C-H groups locate at 3188.7 cm−1 and 1440.8 cm−1, respectively. The absorption bands at 1085.4 and 1023.9 cm−1 indicates C-O-C stretch, and a small absorption band of 764.1 cm−1 represents =C-H group in aromatic rings [44–46]. Interestingly, the peaks at 478 cm−1 and 1039 cm−1 was found, suggesting the presence of the corrosion products of mild steel (include α-Fe2O3 and γ-FeOOH) [47]. Thus, the composition of the adsorbed film formed on the steel surface in the presence of OPEO inhibitor firmly includes the compounds which contain functional groups of C=O, C=C, C-H, O-H, aromatic ring and C-O-C in their structures.
According to the previous report of Chaieb E. et al [15], a compound, namely Limonene, extracted from orange peel was demonstrated as a green inhibitor for steel corrosion in 1M HCl solutions. Meanwhile, the structure formula of Limonene is presented in Fig. 9 showing C-C, C=C and C-H bonds in Limonene’ structure. However, the adsorbed film contains the other adsorbed groups such as C=O, O-H and C-O-C, indicating the presence of other compounds in OPEO. Therefore, it is concluded that the attendance of these compounds other than the limonene contribute to the corrosion inhibition for mild steel in HCl acid. In addition, the organic compounds in acid media can be acidified or participate in physiochemical reactions to form byproducts or intermediate products which can serve as secondary inhibitors for steel corrosion in acid solutions [4,48]. Therefore, the adsorption of OPEO on the steel surfaces can be visualized through the adsorption of D-Limonene and several other feature bonds in the constituents of OPEO such as C=C and C=O as shown in Fig. 9. The figure describes the adsorption model of limonene via two C=C bonds at carbon position 3–4 and 8–9, as well as illustrates the adsorption model of C=C and C=O bonds in constituents of OPEO on the mild steel surface.
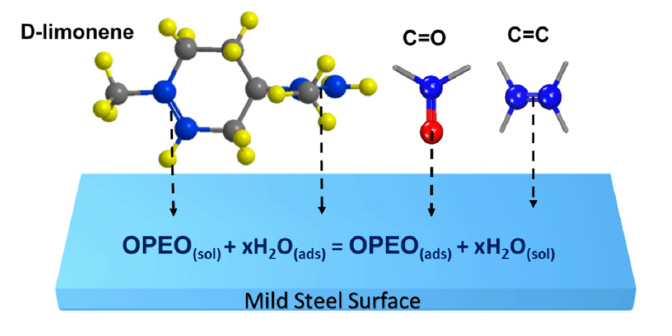
The adsorption model of OPEO on the mild steel surface
4. Conclusions
In the present study, the corrosion inhibition mechanism of Vietnam orange peel essential oil (OPEO) for mild steel in the 1N HCl solution was investigated. In the corrosive solutions, OPEO play a role of a mixed-type inhibitor. OPEO enabled alleviating anodic dissolution reactions and retarding cathodic hydrogen evolution reactions in the corrosion process. The corrosion inhibition mechanism of OPEO is derived from adsorption ability on the surface of the mild steel. Through thermodynamic calculation based on Langmuir, Temkin and Frumkin isotherm models, it was found that adsorption characteristics of OPEO are not fully monolayer adsorption. Possibly, there has been existence of multilayer adsorption of the organic molecules of OPEO inhibitor or lateral interactions between the adsorbed species on the mild steel surface. The adsorption of OPEO obeys the physical adsorption mechanism with the free energy ΔGads in arrange of −20.62 to −24.59 kJ/mol for Langmuir isotherm model and −25.45 to −29.03 kJ/mol for Temkin isotherm. Among components of OPEO, out of the mainly active agent of D-limonene, other compounds also contribute to enhancement of corrosion inhibition for the steel in acid environment. These compounds are feature by C=O, C=C, O-H, C-O-C, –C=CH and C-H bonding groups present in their molecules. With the high inhibition efficiency over 90 % corresponding to the concentration of 3–4 g/L and equivalent to 3.5 g/ L of urotropine (a commercial inhibitor in industry), OPEO is believed to be a potential green corrosion inhibitor for mild steel in HCl acid due to its none toxicity, biodegradability, low cost and availability of large quantity requirements.