Electrochemical Characteristics of Solid Polymer Electrode Fabricated with Low IrO2 Loading for Water Electrolysis
Article information
Abstract
To maximize the oxygen evolution reaction (OER) in the electrolysis of water, nano-grade IrO2 powder with a low specific surface was prepared as a catalyst for a solid polymer electrolyte (SPE) system, and a membrane electrode assembly (MEA) was prepared with a catalyst loading as low as 2 mg cm−2 or less. The IrO2 catalyst was composed of heterogeneous particles with particle sizes ranging from 20 to 70 nm, having a specific surface area of 3.8 m2g−1. The anode catalyst layer of about 5 μm thickness was coated on the membrane (Nafion 117) for the MEA by the decal method. Scanning electron microscopy (SEM) and electrochemical impedance spectroscopy (EIS) confirmed strong adhesion at the interface between the membrane and the catalyst electrode. Although the loading of the IrO2 catalyst was as low as 1.1–1.7 mg cm−2, the SPE cell delivered a voltage of 1.88–1.93 V at a current density of 1 A cm−2 and operating temperature of 80°C. That is, it was observed that the over-potential of the cell for the oxygen evolution reaction (OER) decreased with increasing IrO2 catalyst loading. The electrochemical stability of the MEA was investigated in the electrolysis of water at a current density of 1 A cm−2 for a short time. A voltage of ~2.0 V was maintained without any remarkable deterioration of the MEA characteristics.
1. Introduction
Various hydrogen production technologies have been developed for the generation of renewable energy, where solid polymer electrolysis (SPE) of water is considered one of the most efficient methods. The SPE system utilizes the membrane electrode assembly (MEA) setup of polymer fuel cells (PEMs), and is thus very safe, operates at low temperature, and is highly efficient compared to conventional alkaline water electrolysis [1–3]. The water electrolysis reaction starts thermodynamically at 1.23 V and, in fact, requires an over-potential above 1.23 V. However, the over-potential required for water electrolysis differs depending on the electrode catalyst material; thus, electrode catalysts that minimize the overpotential even at high current density are being studied [4]. Currently, the greatest challenge for SPE water electrolysis is the development of an anode catalyst that maximizes the oxygen evolution reaction (OER) at the lowest cost [5–7]. The electrode catalysts currently being investigated for the oxygen evolution reaction are mainly based on Ir black or IrO2 catalysts, and the optimal catalyst loading is about 2–6 mg cm−2 [8–10]. The Ir and Ru materials are generally in the oxidic form, and are mostly produced by thermal oxidation, given that metallic Ir and Ru have been observed to be unstable [10]. IrO2 catalysts have been reported to have superior oxygen evolution reaction (OER) characteristics and better electrochemical stability than metal Ir catalysts [11–12]. Typical cell potentials applied with this IrO2 catalyst are about 1.6–1.72 V when evaluated at a current density of 1 A cm−2 and operating temperature of 80°C with a catalyst loading of 2–4.5 mg cm−2 [9].
Recent studies on enhancing the oxygen evolution reaction (OER) in SPE cells have been carried out by applying a high efficiency electrode catalyst, a thin Nafion membrane, and improving the conductivity of the backing layer of the anode [13–16]. Guillet et al. proposed two techniques for reducing the loading of IrO2 catalysts, i.e., using nano-grade IrO2 (BET: 35 m2 g−1) with a high surface area and coating nanograde Ir black and IrO2 onto the surface of a Ti carrier [13–15]. Further, Sheng Sui et al. reported that loading (1–3.5 mg cm−2) nano Ir black (BET: 32 m2 g−1) on a TiC carrier, application of a thin Nafion 112 (50 μm) or Nafion 1135 (89 μm) membrane, and optimizing the design of the backing layer (GDL or Ti foil) of the anode could result in excellent polarization characteristics of about 1.65 V at 80°C, 1 A cm−2 [13]. In most of these studies, the decrease in the over-potential was largely derived from reduction of the membrane thickness or was attributed to the catalyst electrode [9]. In particular, the large specific surface area of nano-IrO2 or nano Ir black leads to electrode deterioration as a unique problem, and even if the catalyst loading is increased, there is almost no effect on reducing the over-potential in SPE water electrolysis [14]. This means that there are still technical limitations in handling nanocatalysts. Therefore, it is necessary to study the bulk nano-IrO2 catalyst with low specific surface area. In this study, the electrode microstructure and the electrochemical behavior are evaluated by fabricating a MEA with an anode thickness of 5 μm or less by utilizing IrO2 powder with a particle size of about 50 nm and a specific surface area of 3.8 m2g−1.
2. Experimental
2.1 Preparation and characterization of MEA
IrO2 (Alfa Aesar, 99%, USA), Ir black (Alfa Aesar, 99.8%, USA), 5 wt% Nafion solution (DE521, DuPont, USA), and Nafion 117 membrane (Du Pont, USA, 183 μm) were used in the preparation of the MEA for SPE water electrolysis. The IrO2 anode catalyst with an initial rectangular shape and particle size of about 1.0 μm was ground for 20–30 min to a particle size of about 50 nm with a specific surface area of ~3.8 m2 g−1. Further, nano-Ir black having a particle size of 15 nm and a specific surface area of 30 m2 g −1 was prepared as a comparative catalyst. Here, a relatively thick Nafion 117 membrane (thickness: 183 μm) was used in order to eliminate manufacturing defects, hydrogen crossover (associated with thin film membranes), and performance deterioration factors due to compromise of the mechanical strength, and to examine only the characteristics of the catalyst. Four types of catalyst electrodes were prepared, as summarized in Table 1. IrO2 electrodes and Ir black, electrode as a reference, were fabricated with catalyst loadings on the anode of 1.1, 1.4, and 1.7 mg cm−2, respectively. In addition, a 40 wt% Pt/C catalyst was used for all cathode electrodes, where the catalyst loading was 0.2 and 0.5 mg cm−2, respectively. The active area of the prepared MEAs was 5 cm2. First, the catalyst, ionomer, and isopropyl alcohol (IPA) were mixed in a predetermined ratio, sonicated for about 2 h at room temperature, and stirred for about 12 h to prepare the catalyst ink. The ionomer content of the catalyst layer of the anode and the cathode was set at 13 and 20 wt%, respectively. That is, the weight ratio of IrO2 to the ionomer constituting the anode was 87:13, and the Pt/C (40 wt%) to ionomer ratio of the cathode was 80:20. All MEAs used in this study were prepared by using the decal transfer method, which is the most commonly used route for fabricating catalyst layers on either side of the SPE membrane [17–18]. In this method, the catalyst ink (electrolyte ionomer, catalysts, and solvent mixture) is coated onto a polyimide film substrate that has precisely the same dimensions as the active area in the water electrolyzer. The coated decal substrates are assembled by sandwiching the Nafion membrane under a pressure of 4 MPa at 130°C for 2 min. After the hot pressing operation is completed, the polyimide film, as the decal substrate, is peeled off at room temperature. Herein, the catalyst loadings were calculated from the difference between the dried membrane weight and the weight of the membrane with the catalyst ink dried under the same conditions.

Electrode design of single cells with various loading level.
The morphology of the Ir black and IrO2 powders prepared for the anode catalyst layer, and the microstructure of the cross-section of the MEA were observed via field emission scanning electron microscopy (FESEM, HITACHI S-4700, Japan) in order to examine the thermal fusion state between the electrodes and the Nafion membrane. Furthermore, SEM was used to observe the state of the particles on the surface of the electrodes to confirm the catalyst dispersion on the electrode.
2.2 Single-cell assembly and electrochemical characteristics
A schematic of the SPE single-cell fabricated to evaluate the electrochemical properties of the MEA is shown in Fig. 1. The bipolar plate has a channel designed to allow water to flow, a porous Ti mesh or carbon paper is installed thereon as a backing layer, and the MEA is tightened by the end-plate. In order to check the state of the fabricated MEA, impedance evaluation was performed before evaluating the polarization performance. Electrochemical impedance spectroscopic (EIS) analysis was performed with an SP-150 potentiostat/galvanostat instrument at a frequency of 10 mHz to 10 kHz and an amplitude of 10 mV. The electrochemical properties of the SPE electrolyzer were evaluated at 80°C and atmospheric pressure. Purified water, which was circulated by a peristaltic pump at a flow rate of 30 ml min−1, was supplied to the anode and cathode compartment, where the water was preheated to about 60°C, and the supply of water to the cathode side was carried out in consideration of the thermal management of the cell and the CO2 conversion reaction experiment. The polarization of the SPE cell was evaluated by applying a voltage in the range of 1.1–2.4 V at 0.1 V min−1 using a CNL Power Supply (Korea) instrument. The stability of the MEA was evaluated over 2 h at an operating temperature of 80°C and a current density of 1 A cm−2.

Schematic of the SPE single-cell.
3. Results and Discussion
3.1 Morphology of MEA prepared by decal method
Fig. 2 shows the XRD patterns of the Ir black and IrO2 powders prepared for the anode catalyst layer of the MEA. The peaks of IrO2 powder could be indexed to the standard diffraction data (ISCD 84577), confirming the formation of pure rutile-type (tetragonal structure) IrO2 without any impurities [19]. The XRD pattern of Ir black consists of broad reflections at 41, 46, 69, and 84, assigned to the (111), (200), (220), and (311) planes, respectively, confirming the face centered cubic structure of Ir (ISCD 041524) [20–21].

XRD patterns of Ir black and IrO2 powder.
The SEM image in Fig. 3(a, b, c) shows the morphology of the Ir black, IrO2, and Pt/C (40 wt%) powders used for the anode and cathode, respectively. That is, Fig. 3(a) shows that Ir-black comprised primary nanoparticles with a diameter of 15 nm, the surface of which was porous, and the particles aggregated into secondary particles with a cross-section of 50 nm. Fig. 3(b) shows that the pulverized IrO2 powder had a primary particle size of about 50 nm, consisting of a high-density bulk matrix mixed with some large particles without aggregation. Fig. 3(b) shows the Pt/C (Pt 40wt%) powder constituting the cathode, where secondary particles with diameters of about 50 nm were formed by aggregation of primary particles with diameters of about 3 nm.
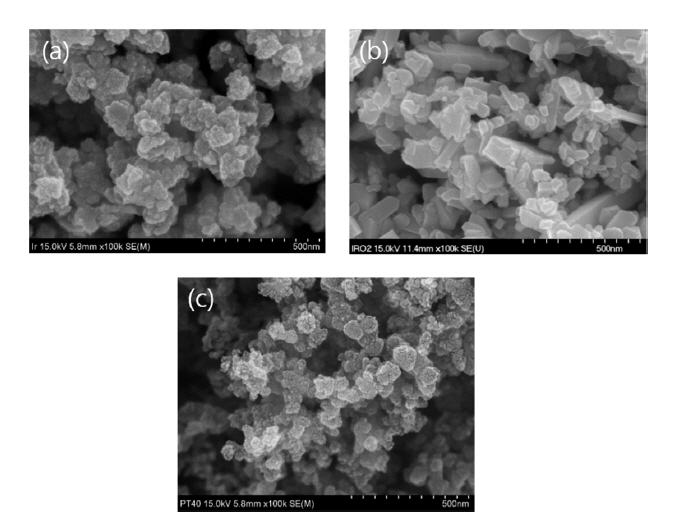
SEM image of Ir black, IrO2 and Pt/C (40 wt%) powder.
To evaluate the structure of the fresh MEA prepared by the decal transfer method, the interface between the electrode and the Nafion membrane was observed using SEM. Fig. 4(a) shows the cross-section of the MEA, with the anode layer at the top and the cathode layer at the bottom, with the membrane as the center. The thickness of the membrane was about 180 μm and the anode was thinner than the cathode. The thickness of the anode layer was about 3 μm and the thickness of the cathode layer was about 10 μm. The anode thickness was one third of the cathode thickness. The interface between the electrode and the membrane is presented in more detail in Fig. 4(b, c). That is, Fig. 4(b) shows the adhesion between the anode layer and membrane layer, and Fig. 4(c) shows the adhesion between the cathode layer and the membrane layer, demonstrating the very sound interface. No cracks were observed along the adhesion interface between the electrode and the membrane, and a strong bonding state was maintained. Here, the amount of catalyst in the anode was larger than that of the cathode because the anode catalyst layer is thin is due to the difference in the specific surface area; the surface area of Pt metal in the cathode was 77 m2 g−1, which is about 20 times that of IrO2 in the anode, which leads to an increase in the volume of the electrode.
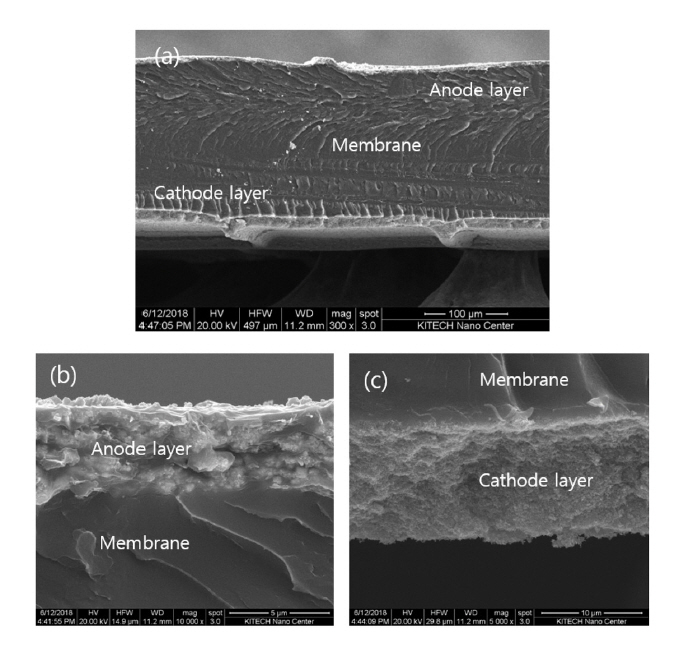
SEM image showing the cross-section (a) of a fresh MEA with anode (IrO2) (b), and cathode (Pt/C (Pt 40 wt%)) (c), respectively.
Fig. 5 shows SEM images of the surfaces of both electrodes in the fresh MEAs. Figs. 5(a), (b), and (c) show that the surfaces of the IrO2 and Ir black anodes and that of the Pt/C cathode were very different. That is, the surface of the IrO2 electrode comprised high-density bulk particles with a larger size than that of the Ir black electrode composed of particles having a relatively large specific surface area, and a dark region thought to correspond to an ionomer was observed between the particles. This means that the specific surface area of IrO2 is lower than that of Ir black; thus, the ionomer content of 13 wt% could be further reduced for IrO2. In the case of Ir black having a relatively large specific surface area, an ionomer content of 13 wt% or more may be required. Fig. 5(c) shows the surface of the Pt/C (Pt 40 wt%) cathode, where it was clear that the electrode surface comprised finer particles. The cathode composed of these nanoparticles had a specific surface area about twice that of Ir black, where the morphology of the particles was consistent with that of the raw materials, as shown in Fig. 3. Considering that the specific surface area of the cathode comprising nanoparticles was about twice that of Ir black, the ionomer content of 20 wt% may not be sufficient. Therefore, it is necessary to study the optimum composition of the electrode, including the ionomer content, based on the characteristics of the catalyst.
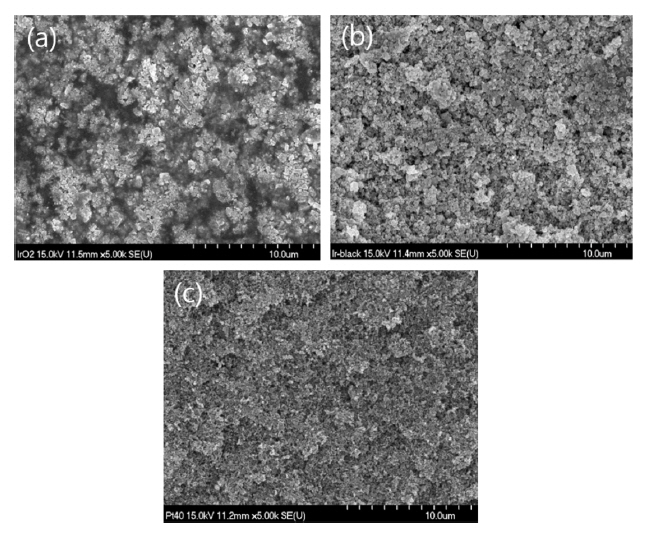
SEM image showing the surface of IrO2 (a), Ir black (b) of anode, and Pt/C (Pt 40 wt%) (c) of cathode.
3.2 Electrochemical evaluation of the MEAs
Fig. 6(a) shows the impedance curve (Nyquist plot) of the four MEAs before the test at 80°C and 10 mV. Only a low-frequency response arc was detected, indicating that mass transport limitation was negligible in this operation [22]. Thus, the widely employed equivalent circuit (EC) can be used to fit the impedance data using the Nyquist plot, as shown in Fig. 6(b) [16]. The low-frequency response arc is attributed to charge transfer processes at the anode and is represented by the resistor (RCT, A). The constant phase element (CPE) in parallel to RCT, A represents the double-layer capacitance of the anode. The high-frequency response arc is attributed to the cathode process and represented by a resistor (RCT, C) in parallel with the CPE. The total charge transfer resistance (RCT) is then obtained by adding RCT, C and RCT, A. The high-frequency intercept on the real axis, RΩ, represents the total ohmic resistance of the single-cell, which is the sum of the ohmic resistances of each component (i.e. the membrane, catalyst layer, backing layers, and bipolar plates) and the interfacial contact resistances between them. The diameter of the arc is a measure of the charge transfer resistance of the OER, which is designated as Rct [23]. The cell resistance (RΩ) and the total charge transfer resistance (RCT) were calculated as shown in the table in Fig. 6(a) through equivalent circuit simulation of the four MEAs. The IrO2-1 cell had the largest ohmic resistance and charge transfer resistance, presumably due to insufficient loading of the catalyst. However, the IrO2-2 cell showed the lowest ohmic resistance when the anode catalyst loading was increased under the same conditions. These results can be attributed to reduced ion and electron resistance in the anode. In addition, for the IrO2-3 cell, an increase in both the anode and cathode catalyst loading induced a slight increase in the ohmic resistance, but this cell showed the lowest charge transfer resistance. Thus, the total resistance, including the ohmic resistance and the charge transfer, followed the order from highest to lowest: IrO2-2, IrO2-3, Ir black, and IrO2-1. The resistance characteristics of these cells are consistent with the polarization performance evaluation in Fig. 7.
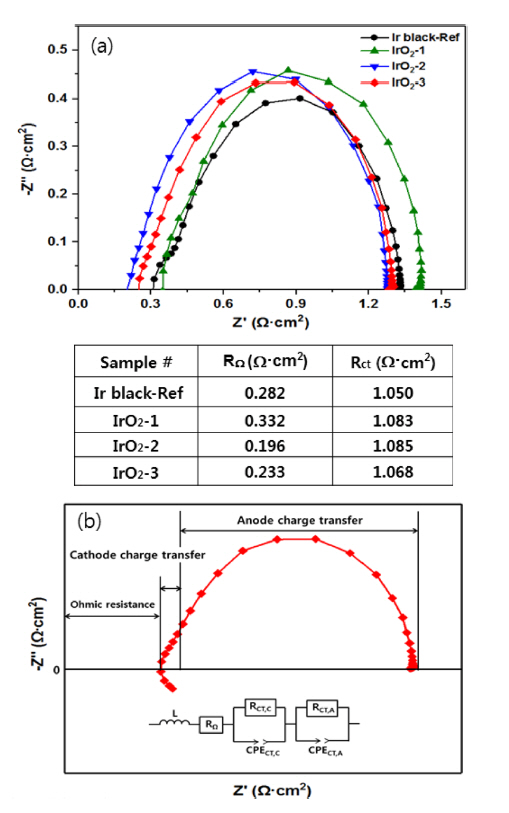
Impedance curves of MEA cells with various catalyst at 80°C and 10 mV (a), Nyquist plot feature (IrO2-3 as example) and the equivalent circuit for SPE water electrolysis (b).
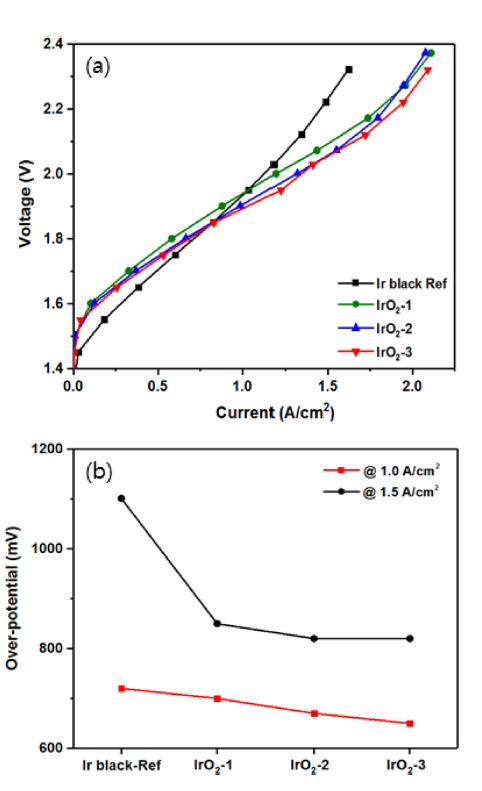
Polarization curves (a), and over-potential (b) of the SPE water electrolysis cell with the MEAs prepared with iridium oxide catalyst and iridium black electrode at atmospheric pressure and 80°C.
Figs. 7(a) and (b) show the polarization characteristics of the MEA with variation of the IrO2 catalyst loading and the change in the over-potential according to the current density, respectively, as compared with those of the counterpart employing the Ir black electrode. For the MEAs composed of Ir-black, IrO2-1, IrO2-2, and IrO2-3 (Fig. 7(a)), the cell voltage was 1.95, 1.93, 1.90, and 1.88 V, respectively, at a current density of 1 A cm−2. As shown in Fig. 7(b), the corresponding over-potentials were 720, 700, 670, and 650 mV, indicating a decrease with increasing catalyst loading. The cell voltages at the current density of 1.5 A cm−2 for the same MEAs were 2.24, 2.08, 2.05, and 2.05 V, respectively. The over-potential of the same cells decreased to 1101, 850, 820, and 820 mV, respectively. Here, it can be seen that the over-potential depended strongly on the current density. At a current density of 1 A cm−2, the cell over-potential decreased in proportion to the catalyst loading of IrO2. Moreover, for the catalytic IrO2 electrode, the cell voltage decreased even when the current density was increased to 2.0 A cm−2. Notably, the MEA composed of Ir black was operational at low cell voltage when the current density was less than 1 A cm−2, and the cell voltage increased rapidly at current densities of 1 A cm−2 or more. Overall, the polarization characteristics of the MEA with the IrO2-1 and IrO2-2 anodes were superior to those of the congener with Ir black, although the IrO2 cells were fabricated with a lower catalyst loading than the cathode of the Ir black catalyst cell. In particular, for the IrO2-3 cell, the cell voltage decreased when the current density was increased to about 2 A cm−2. This is in contrast with the fact that the cell employing the nanoparticle catalyst showed no significant change in voltage even when the catalyst loading was increased [14]. From the practical application point of view, the stability of the MEA is very important, and many studies on this feature are on-going [24–26]. Thus, water electrolysis was conducted with the MEA employing the IrO2-1 and IrO2-3 catalyst electrodes for 2 h at atmospheric pressure, 80°C, and 1 A cm−2. Fig. 8 shows that the MEAs employing both IrO2 electrodes exhibited good stability during water electrolysis. The cell voltages of the two electrodes showed almost similar characteristics without any performance degradation over 2 h. However, the voltage of the two electrode cells increased slightly as the operating time increased. From the above results, it was found that the cell voltage decreased in proportion to the increase in the loading of the IrO2 catalyst, which is a bulk nanoparticle. It is expected that the over-potential of the water electrolysis cell can be further reduced if further studies on the ionomer content based on the IrO2 catalyst particle size and specific surface area are undertaken.
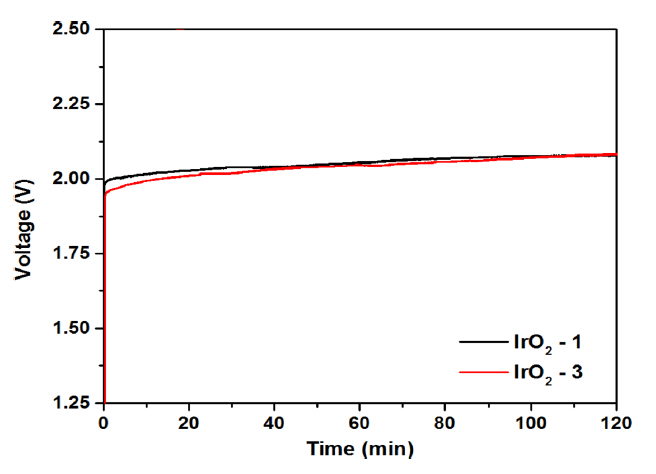
Evaluation of stability of SPE cells with the indicated MEAs at 80°C and 1 A cm−2.
4. Conclusions
The decal transfer method was successfully employed to transfer an electrode based on an IrO2 catalyst onto the membrane of a MEA with a catalyst loading of 1.1–1.7 mg cm−2. The contact between the electrode and the membrane interface was very good, and the resistance of the cell remained very uniform and low. Cross-sectional analysis of the MEA showed that the optimal anode and cathode catalyst layer thicknesses were 3 μm and 10 μm, respectively, for maximizing the catalytic activity of the electrode. Impedance measurement demonstrated that at an IrO2 catalyst loading of 1.4 mg cm−2, the resistance of the cell was the lowest and the cell voltage decreased in proportion to the increase in the catalyst loading. As a result of the polarization characteristics of the MEAs, the over-potential was reduced to about 650 mV in spite of the low IrO2 catalyst loading, and the electrochemical water decomposition reaction was very stable as the current density increased. In addition, the MEA performed stably at a constant current density.
Acknowledgement
This work was supported by the R&D project (PEO18281) of KITECH, Ministry of Science and ICT of the Republic of Korea.