Electrocatalyst for the Oxygen Reduction Reaction: from the Nanoscale to the Macroscale
Article information
Abstract
The use of nanoscale electrocatalysts is a promising strategy for achieving high catalyst activity due to their large surface area. However, catalyst activity is not directly correlated to particle size. To understand this discrepancy, many studies have been conducted, but a full understanding has still not been achieved, despite the importance of particle size effects in designing an active catalyst. In this review, we focus on the discussion of particle size effects on the oxygen reduction reaction, and also discussed the nanoscale design beyond the nanoparticle to the meso and macroscale design.
1. Introduction
Fuel cells are gaining interest as promising next-generation renewable energy sources due to their high efficiency and environmentally friendly zero emission process [1]. However, in order to commercialize fuel cell applications, one of the biggest hurdles still to overcome is the sluggish oxygen reduction reaction (ORR) at the cathode of the fuel cell. Platinum is one of the best materials for ORR, but its high cost and low abundance limits its use. Researchers are thus aiming to develop more active and cheaper materials to replace Pt. However, decreasing the material size to the nanoscale is also considered a promising solution. Considering that electrochemical reactions occur on the surface, nanoparticles are seen as prime candidates as they have an extremely high surface to volume ratio, and therefore a large number of active sites for reactions. Nanoparticle architecture can be applied to fuel cell applications, where, in particular, alloys with transition metals, coreshell structures, and shape-controlled strategies are considered promising and effective [2,3]. However, the fundamental understanding of size issues in fuel cell catalysts is still limited owing to the difficulty in controlling the nanoparticle synthesis and understanding the complexity of the surface properties of nanoparticles. Furthermore, the facet exposure and coordination number of bulk material catalysts can also be severely changed in the nanoscale and it is not known how this will affect catalyst activity. Moreover, nanoscale electrocatalysts, generally smaller than 10 nm in size, experience a quantum confinement effect and have characteristics quite different compared to bulk properties. Therefore, to design high activity and long-term stability in nanoscale electrocatalyts, a fundamental understanding of size issues is strongly required.
In this review, we discuss the effect of particle size, from the nanoscale to the macroscale, on fuel cell applications. We summarize the ongoing research regarding the effect of particle size on the specific and mass activities, for better designing of electrocatalysts. We also consider one-dimensional (1D) wire structures, nanoassembled structures such as agglomerate particles, etc. Finally, we discuss mesoscale and macroscale Pt electrocatalysts for the ORR, with the aim of bridging the gap from nanoscale applications to real-time applications in fuel cells.
2. Size effect on the oxygen reduction reaction activity
With the increasing commercialization of fuel cell applications, nanoparticle catalysts have been considered as promising alternatives due to their high mass activity compared to bulk particles. Despite having been studied for a long time, there still remain controversies about the effect of size on the activity of catalysts. Kinoshita et al. [4] reported on the particle size effect for ORR with highly dispersed platinum nanoparticles. They found that the mass activity was well correlated to the mass-average distribution of (100) and (111) as shown in Fig. 1, and that the specific activity trend was also well correlated with the surface- average distribution of (100) under the specific anion adsorption condition in their experiment.(Fig. 2) Their results showed that the ORR activity was a structure sensitive reaction. The mass activity has maximum values about 3 nm and the specific activity increase as increasing the particle size. Mayrhofer et al. [5] reported that the particle size effect on the ORR activity trend with electrochemical reaction such as potential of zero total charge (PZTC) and the CO bulk oxidation focused on the adsorption of oxygenated species. They found that the PZTC increased with increasing particle size, which meant that the oxophilicity, a measure of the coverage provided by oxygen species, decreased as shown in Fig. 3. The bulk CO oxidation and ORR activity was highly correlated with the oxophilicity. CO can be easily oxidized to CO2 when the size of the nanoparticle is small, considering that the oxidation of CO is governed by the Langmuir-Hinshelwood mechanism. However, in ORR, the high oxophilicity deactivates the surface, due to the blocking effect. From the relationship between ORR activity and the size of the nanoparticles, it appears that oxophilicity can be a good parameter for judging size issues. Considering that oxophilicity is also affected by the surface structure of the nanoparticles, for example, by defects, steps, and terrace sites, it is also well correlated with the previous surface-sensitive reaction.

Superimposed plots of mass activity for oxygen reduction and mass average distribution (MAD) (100) as a function of particle size: (solid lines) MAD (100), (a) ●, 98% H3PO4, 180℃ (1, 2); (b) ○, 0.5 M H2SO4, 25℃ (4); and (c) ☐, 97% H3PO4, 177℃ (3). All images are reproduced from Ref. [4] with permission Electrochemical Society.
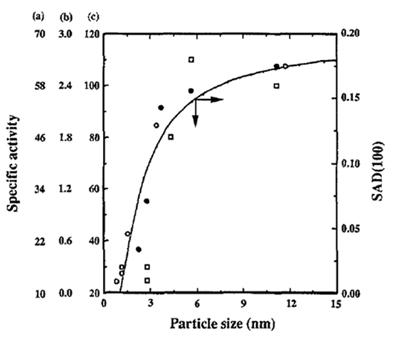
Superimposed plots of specific activity for oxygen reduction and surface average distribution (SAD) (100) as a function of particle size: (solid lines) SAD (100), (a) ●, 98% H3PO4, 180℃ (1, 2); (b) ○, 0.5 M H2SO4, 25℃ (4); and (c) ☐, 97 % H3PO4, 177℃ (3). All images are reproduced from Ref. [4] with permission Electrochemical Society.

Summary of the results from the CO-displacement (a) and cyclovoltammetry (b), as well as from CO bulk oxidation (c) and oxygen reduction reaction (d), showcasing the adsorption of OH and its impact on the electrochemistry at the Pt electrode-solution interface depending on the particle size. All images are reproduced from Ref. [5] with permission American Chemical Society.
Computational approaches have also been followed to estimate the size effect on ORR activity [6,7]. For Pt and Pd, the strong binding energy of the oxygen species leads to a low ORR activity, which means that increasing the particle size (thereby, decreasing the binding energy of the oxygen species) can increase the activity. However, as the particle size decreases, the ORR activity increases in a Au nanoparticle. Because Au binds the oxygen species only weakly, the barrier for ORR is binding to the metal surface of the reactants. Such opposite trends in size effects on the ORR clearly show that an understanding of the binding energy of the oxygen species by varying the nanoparticle size is a critical factor governing the catalyst activity. Tritsaris et al. [7] also reported on the computational atomic-scale modeling of particle size effects for the ORR activity of Pt nanoparticles, and found that when increasing the particle size, the portion of (111) and (100) increase, however that of the step decreases significantly. From the adsorption energy of the oxygen species, intermediates in the ORR, the dissolved edges and corner sites showed no catalytic effects, which lead to the specific activity decreasing with decreasing the size. The results from these computational approaches can help to understand the size-dependent ORR activity at the atomic level.
Generally, it was recognized that the specific activity increases with increasing particle size. However, Nesselberger et al. [8] suggested that the specific activity of Pt nanoparticles (between 1 nm and 5 nm) was insignificant, which suggests the absence of a size effect on ORR activity for Pt nanoparticles with a size less than 5 nm as shown in Fig. 4. They argued that the previous research was misleading due to the uncompensated resistance and support capacitance. The specific activity trend of extended Pt surfaces, Pt-black particles, and Pt nanoparticles are as follows: Pt surfaces (two-fold increase in ORR activity compared to Pt black) > Pt-black particle (two-fold increase in ORR activity compared to the nanoparticles) > Pt nanoparticles. This trend is in good agreement with previous reports. However, further studies on the size effect of small nanoparticles (from 5 nm to 2 nm) are required. The effect of size on ORR activity has also been reported based on the terrace ration as varying the nanoparticle size. On decreasing the nanoparticle size from 11 nm to 2 nm, the terrace ration also decreases, which has been confirmed by temperatureprogrammed desorption experiments.(Fig. 5) The ORR activity roughly correlated with the proportion of terrace sites on the nanoparticles. In terms of mass activity, the ORR activity showed a maximum value with a 3 nm particle size, which correlates well with previous results [9]. Recently, Nesselberger et al. [10] reported that the particle proximity is important in size-selected nanoparticles.(Fig. 6) On controlling the particle distribution, i.e., the edge-to-edge distance, the specific activity was found to be governed by the edge-to-edge distance and not the Pt cluster size. They proposed that the ORR activity was related to the OH coverage, which is, in turn, affected by the potential distribution in the electrochemical double layer. The electric double layer overlap increases when decreasing the distance, and this leads to a lowering of the adsorption potential of the adsorbed species (i.e., oxygen species), due to a decrease in the average potential.

Specific and mass activities vs the ECSA in the different electrolytes measured at room temperature at 0.9 V vs. RHE. Activities analyzed from the IR compensated positive-going sweeps at 50 mV s-1, after subtraction of the capacitive background. The lines only serve as a guide to the eye. (a) Specific activities vs the ECSA. (b) Mass activities vs the ECSA. (c) Specific activities normalized to the Pt-poly activity vs the ECSA. (d) Mass activity normalized to the 1 nm catalyst vs the ECSA. All images are reproduced from Ref. [8] with permission American Chemical Society.
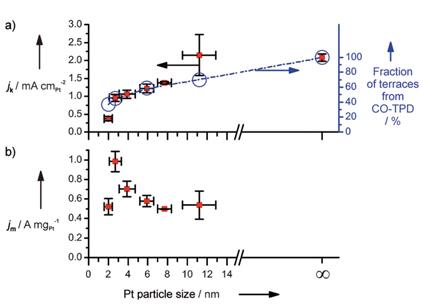
a) ORR kinetic current densities and b) mass activities at 0.9 V (reversible hydrogen electrode, RHE) of different particle sizes, from cyclic voltammograms in a O2-saturated 0.1 m HClO4 solution at a sweep rate of 50 mVs-1 and 1600 rpm at 23.8℃. The blue circles in plot (a) represent proportions of the terraced particle surface area calculated from CO TPD profiles. All images are reproduced from Ref. [9] with permission Wiley.

Specific activity versus edge-to-edge distance. Specific activity of the ORR determined at 0.85 V vs. RHE in rotating disc electrode measurements of Pt nanoclusters deposited onto a glassy carbon electrode. The activity is plotted versus the average nearest edge-to-edge distance calculated from the nanocluster density assuming a random nanocluster distribution on the glassy carbon surface. The measurements are performed at room temperature in 0.1M HClO4 electrolyte. The dashed line serves as a guide for the eye to highlight the observed trend. All images are reproduced from Ref. [10] with permission Nature Publishing Group.
The controversies on the particle size effects on ORR activity is mainly due to the different methods used to prepare the nanoparticles, the difficulty in synthesizing monodisperse particles, surface impurities affecting the activity, and inexactitudes in experimental procedures. An understanding of the results from the fundamental studies on ORR activity with respect to particle size is important and further research may be required to clearly understand all the issues. However, regardless of the controversies concerning the size effects on ORR activity, many studies still focus on the development of nanoparticle synthesis and characterization.
3. Beyond the nanoscale: nanoarchitectures, and meso- and macroscale Pt nanostructures for the oxygen reduction reaction
The other approach to size issues is to increase the dimension. Due to their instability under harsh acidic and potential conditions, nanoparticles are easily aggregated and dissolve in solution, leading to low long-term stability. To overcome this issue, the use of secondary particle types, i.e., porous aggregates, nanoassembled structures, or a one-dimensional (1D) strategy has been reported. Kim et al. proposed highly porous Pt nanoparticles with enhanced activity and durability. They found that the compressive strain induced by the high surface tension can tune the band structure, leading to a low oxygen binding energy [11]. Koenigsmann et al. reported the formation of 1D nanostructures through electroless deposition coupled with a template. Due to the properties of the 1D structure, the activity can be enhanced [12]. In Fig. 7, Guo et al. also suggested a core/shell nanowire structure, where both long-term stability and high activity were realized by the 1D structure [13].
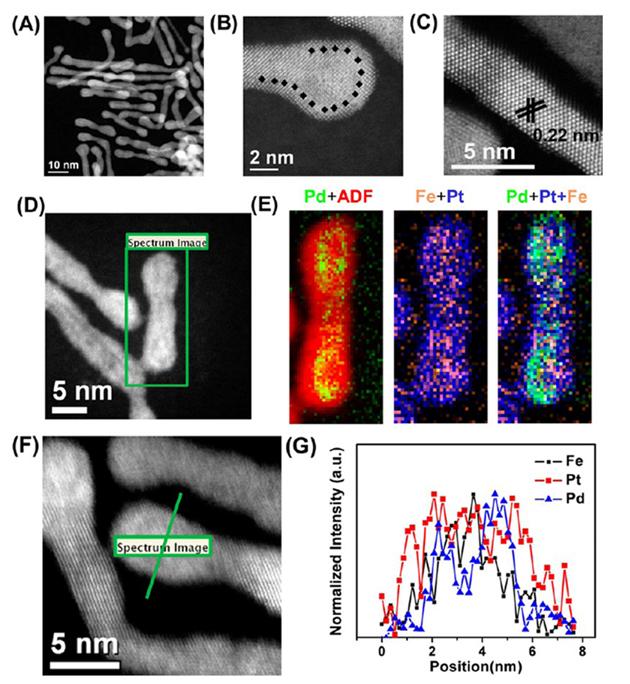
HAADF-STEM (A, D, F), high resolution HAADF-STEM (B, C), and STEM-EELS mapping (29×66 pixels, spatial resolution of 3 Å) (E) images of FePtPd/FePt-0.8. (F, G) High-resolution (1.7 Å) line-scan EELS analysis across one NW. All images are reproduced from Ref. [13] with permission American Chemical Society.
Mesostructured Pt thin films also have a great potential for high activity and long-term stability. Surface engineering with double gyroid morphology has low fractions of Pt undercoordination sites, which lower the oxygen species binding energy [14]. A mesoscale double gyroid structure also has the advantage of inhibiting particle growth through Ostwald ripening and inhibiting agglomeration and atom migration, ultimately leading to superior long-term stability. The other mesosacle approach is Pt thin films with whiskers. 3M suggest a whisker type nanostructured thin film (NSTF) catalyst for fuel cell applications(Fig. 8) [15]. This structure can overcome the limitations of nanoparticle catalysts and achieve high mass activity and specific activity owing to an extended surface area. Previous research has shown that NSTFs are simpler to process than is Pt/C and hence have great potential for practical applications. Recently, Van Der Vliet et al. reported the fabrication of a Pt3Ni (111) mesostructure by heat treatment under H2 conditions [16]. By tailoring the surface property, we could control the near-surface composition and achieve a proper surface orientation. When annealing under H2, the metal surface oriented to the (111) face, which was energetically more favorable, had few under-coordinated sites and exhibited a smooth continuous film like structure.(Fig. 9) In Fig. 10, Kim et al. [17] also reported macroscale Pt nanostructures for ORR with superior mass transport in membrane electrode assembly (MEA). They reported the development of an inverse opal structure, a 3D-ordered macroporous material, with interconnected pores and a relatively high surface area, and with the potential for use in energy devices. However, the use of an inverse opal structure in commercial devices is challenging. In experiments concerning the direct application of the Pt inverse opal structure in a gas diffusion layer, high performance was achieved due to the short diffusion path and open interconnected structure. From this multidimensional size strategy, high catalyst utilization and bridging of the nanoscale to the device can be achieved. Given the structural advantages of the nanoscale architecture, application to other electrochemical energy devices is desired.
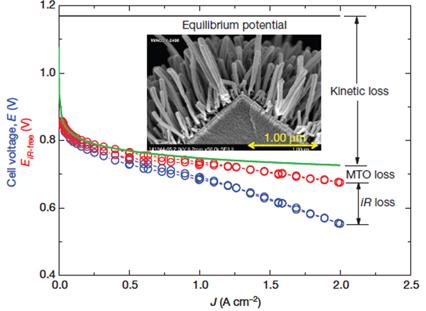
Fuel-cell polarization curve. Measured PEM fuel-cell MEA polarization curve (blue) and iR-free (red) compared to a hypothetical curve for kinetic losses only (green). The difference gives the losses due to mass transport overpotentials (MTO). The polarization curve is from an MEA having electrodes based on the NSTF PtCoMn catalyst (inset) under 150 kPa H2/air. All images are reproduced from Ref. [15] with permission Nature Publishing Group.
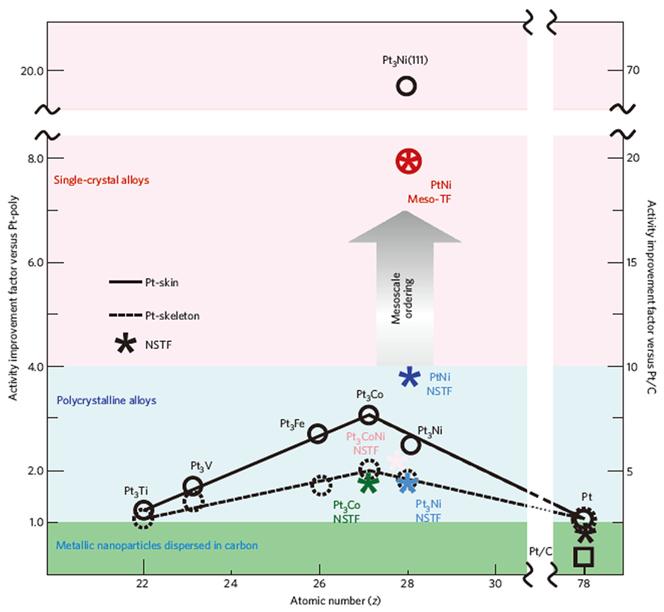
Activity map for the ORR obtained for different classes of Pt-based materials. Improvement factors are given on the basis of activities compared with the values for polycrystalline Pt and the state-of-the-art Pt/C catalyst established by RDE measurements in 0.1 M HClO4 at 0.95 V vs. RHE. All images are reproduced from Ref. [16] with permission Nature Publishing Group.
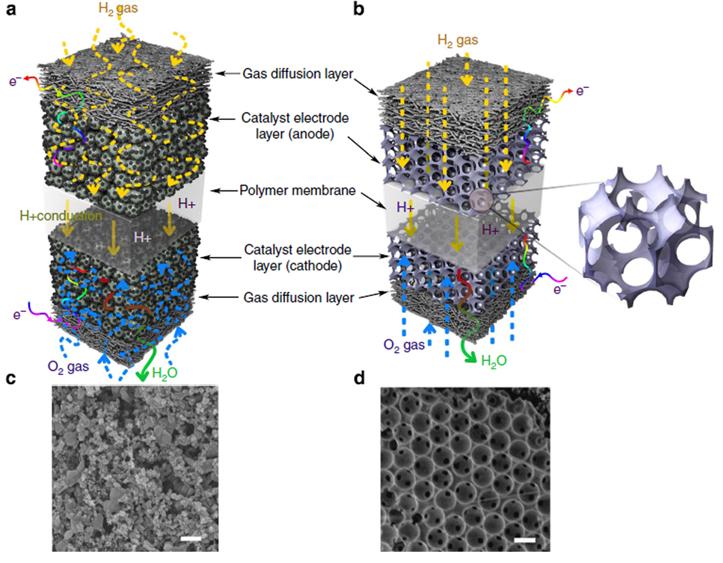
Conceptual diagrams of two MEAs. (a) Conventional MEA with CCM, (b) modified MEA with inverse-opalstructure (IO) electrode examined in this study. (c) FE-SEM image of a CCM surface prepared by commercial Pt/C ink spraying. (d) FE-SEM image of an IO electrode surface prepared by pulse electrodeposition according to colloidal crystal templating methods. Scale bar, 500 nm. All images are reproduced from Ref. [17] with permission Nature Publishing Group.
4. Summary
We discussed nanoscale electrocatalyst designs, focusing on size issues. In addition, we summarized the controversies surrounding the effect of particle size on the mass and specific activities. Generally, as the particle size increases, the specific activity increases and the mass activity decreases. However, recent research has suggested that particle size distribution is an important factor governing the specific activity, and hence, sophisticated studies and measurements may be required when considering the use of supported nanoparticles. We also discussed the strategies beyond nanoparticle issues such as 1dimensional structure and nanoassembled structure. Meso- and macroscale architectures, too, have great potential for practical use, not only because of their high activity and stability, but also because of the superior mass transport, which are important factors governing real-time applications in fuel cells.
Acknowledgements
This work was supported by IBS-R006-G1.
References
L. Su, W. Jia, C.M. Li, Y. Lei, ChemSusChem, 7, 361 (2014).
Su L., Jia W., Li C.M., Lei Y.. ChemSusChem 2014;7:361.S. Guo, S. Zhang, S. Sun, Angew. Chem. Int. Ed., 52, 8526 (2013).
Guo S., Zhang S., Sun S.. Angew. Chem. Int. Ed. 2013;52:8526.N. Jung, D.Y. Chung, J. Ryu, S.J. Yoo, Y.E. Sung, Nano Today, http://dx.doi.org/10.1016/ j.nantod.2014.06.006 (2014).
Jung N., Chung D.Y., Ryu J., Yoo S.J., Sung Y.E.. Nano Today 2014;http://dx.doi.org/10.1016/j.nantod.2014.06.006. 10.1016/j.nantod.2014.06.006.K. Kinoshita, J. Electrochem. Soc., 137 (1990) 845-848.
Kinoshita K.. J. Electrochem. Soc. 1990;137:845–848.K.J.J. Mayrhofer, B.B. Blizanac, M. Arenz, V.R. Stamenkovic, P.N. Ross, N.M. Markovic, J. Phys. Chem. B, 109, 14433 (2005).
Mayrhofer K.J.J., Blizanac B.B., Arenz M., Stamenkovic V.R., Ross P.N., Markovic N.M.. J. Phys. Chem. B 2005;109:14433.J. Greeley, J. Rossmeisl, A. Hellman, J.K. Nørskov, Z. Phys. Chem., 221, 1209 (2007).
Greeley J., Rossmeisl J., Hellman A., Nørskov J.K.. Z. Phys. Chem. 2007;221:1209.G.A. Tritsaris, J. Greeley, J. Rossmeisl, J.K. Nørskov, Catal. Lett., 141, 909 (2011).
Tritsaris G.A., Greeley J., Rossmeisl J., Nørskov J.K.. Catal. Lett. 2011;141:909.M. Nesselberger, S. Ashton, J.C. Meier, I. Katsounaros, K.J.J. Mayrhofer, M. Arenz, J. Am. Chem. Soc., 133, 17428 (2011).
Nesselberger M., Ashton S., Meier J.C., . Katsounaros I, Mayrhofer K.J.J., Arenz M.. J. Am. Chem. Soc. 2011;133:17428.F.J. Perez-Alonso, D.N. McCarthy, A. Nierhoff, P. Hernandez-Fernandez, C. Strebel, I.E.L. Stephens, J.H. Nielsen, I. Chorkendorff, Angew. Chem. Int. Ed., 51, 4641 (2012).
Perez-Alonso F.J., McCarthy D.N., Nierhoff A., Hernandez-Fernandez P., Strebel C., Stephens I.E.L., Nielsen J.H., Chorkendorff I.. Angew. Chem. Int. Ed. 2012;51:4641.M. Nesselberger, M. Roefzaad, R. Fayҫal Hamou, P. Ulrich Biedermann, F.F. Schweinberger, S. Kunz, K. Schloegl, G.K.H. Wiberg, S. Ashton, U. Heiz, K.J.J. Mayrhofer, M. Arenz, Nat. Mater., 12, 919 (2013).
Nesselberger M., Roefzaad M., Fayҫal Hamou R., Ulrich Biedermann P., Schweinberger F.F., Kunz S., Schloegl K., Wiberg G.K.H., Ashton S., Heiz U., Mayrhofer K.J.J., Arenz M.. Nat. Mater. 2013;12:919.D.S. Kim, C. Kim, J.K. Kim, J.H. Kim, H.H. Chun, H. Lee, Y.T. Kim, J. Catal., 291, 69 (2012).
Kim D.S., Kim C., Kim J.K., Kim J.H., Chun H.H., Lee H., Kim Y.T.. J. Catal. 2012;291:69.C. Koenigsmann, E. Sutter, T.A. Chiesa, R.R. Adzic, S.S. Wong, Nano Lett., 12, 2013 (2012).
Koenigsmann C., Sutter E., Chiesa T.A., Adzic R.R., Wong S.S.. Nano Lett. 2012;12:2013.S. Guo, S. Zhang, D. Su, S. Sun, J. Am. Chem. Soc., 135, 13879 (2013).
Guo S., Zhang S., Su D., Sun S.. J. Am. Chem. Soc. 2013;135:13879.J. Kibsgaard, Y. Gorlin, Z. Chen, T.F. Jaramillo, J. Am. Chem. Soc., 134, 7758 (2012).
Kibsgaard J., Gorlin Y., Chen Z., Jaramillo T.F.. J. Am. Chem. Soc. 2012;134:7758.M.K. Debe, Nature, 486, 43 (2012).
Debe M.K.. Nature 2012;486:43.D.F. Van Der Vliet, C. Wang, D. Tripkoviҫ, D. Strmcnik, X.F. Zhang, M.K. Debe, R.T. Atanasoski, N.M. Markovic, V.R. Stamenkovic, Nat. Mater., 11, 1051 (2012).
Van Der Vliet D.F., Wang C., Tripkoviҫ D., Strmcnik D., Zhang X.F., Debe M.K., Atanasoski R.T., Markovic N.M., Stamenkovic V.R.. Nat. Mater. 2012;11:1051.O.-H. Kim, Y.-H. Cho, S.H. Kang, H.-Y. Park, M. Kim, J.W. Lim, D.Y. Chung, M.J. Lee, H. Choe, Y.-E. Sung, Nat Commun., 4, 3473 (2013).
Kim O.-H.,, Cho Y.-H., Kang S.H., Park H.-Y., Kim M., Lim J.W., Chung D.Y., Lee M.J., Choe H., Sung Y.-E.. Nat Commun. 2013;4:3473.