1. Introduction
Voltammetric techniques are widely applied because voltammograms are quite useful in quick analysis of current behavior perturbed by electric potential. The most basic measurement technique is linear sweep voltammetry (LSV) that records the transient current while sweeping the potential linearly with time. Cyclic voltammetry (CV) involves the current change of the reverse reaction triggered by switching the direction of the potential sweep. As a result, considerable information can be obtained to determine the mechanisms of various faradaic reactions. Due to the simple measurement procedure and low cost of the instruments, CV has been the most widely used electrochemical measurement technique. More advanced voltammetric techniques were developed using various kinds of potential waves [1], such as normal pulses [2], differential pulses [3], square waves [4], ac waves [5] and their combinations [6]. Later, those classical voltammetric techniques were evolved into new types by not only measuring the apparent current, but also evaluating the veiled signals. Harmonic ac voltammetry [7-8] treats the veiled signals as the second and higher order harmonic waves and provides signal information under potential sweeping [9]. Potentio-dynamic impedance spectroscopy [9-11] measures current, but presents the resistance and impedance change over linear potential sweeping. More specifically, a voltammetric impedogram is constructed that presents the impedance data plotted vs. the potential values [12].
Despite extensive hardware development for obtaining voltammetric impedograms, there are only few studies on its analysis. This can be attributed to the large size and complexity of data arrays contained in a single voltammetric impedogram. Thus, the goal of this technical note is to propose an algorithm for extraction of useful information from voltammetric impedograms.
A singular point where multiple curves converge or cross over provides unique information about chemical observations and measurements [13]. For example, the isosbestic point corresponds to a specific wavelength, where independent spectral curves cross each other [14]. Even though those curves are measured using different techniques and under different controlled conditions, i.e., variables, the singular point is not varied, and can be used as a reference. An isoelectric point is found under varying pH of the solution [15]. More specifically, the particles possessing surface charges interact with surrounding charges and may have zero net charge for specific pH values, referred to as isoelectric point. With this point known, it is possible to control migration, solubility and functions of colloidal particles and biomaterials [16-17]. In our previous report, we described the singular point observed in the cyclic voltammograms recorded at different scanning rates [18]. The singular point is measured at the potential value, where the current changes from the reduction to the oxidation state or vice versa, and is dependent on the switching potential of the potential sweep. In this paper, we report another singular point obtained from the voltammetric curves of electrochemical impedance and explain how this point can be used for electrochemical analyses.
2. Background Theory
The rate of an electrochemical reaction is given by:
where n is the number of electrons transferred, F is the faradaic constant, A is the electrode area, k0 is the standard rate constant, Cox(0,t) and Cred(0,t) are the concentrations at the surface, α is the transfer coefficient, f = F/[the gas constant(R) × temperature(T)], E and E0’ are electrode and formal potentials, respectively. With potential applied to the electrode, the rate of electron transfer is controlled by the rate constant, whereas the mass transfer is controlled by the concentration gradients at the surface. While k0 is independent of time, the concentrations are timedependent, so that the changes in the measured current with time can only be explained by the changes in the mass concentrations with time. Most voltammetric measurements, such as LSV and CV, apply the dynamic potential as a function of time and simultaneously record the current (also as a function of time). Having the potential and the current bounded via time, a voltammogram includes an i-E curve that is apparently simple, but comprises a complex mixture of time-dependent and/or time-independent parameters.
However, in the optimal case, fast electron transfer with large k0 renders an equilibrium between Cox (0, t) and Cred (0, t) for reversible reactions. Its equilibrium constant is determined only by the electrode potential and given by the famous Nernst equation. Thanks to the constancy of concentrations at the equilibrium, the time-dependent terms of the current do not contribute in a process so that the potential is only considered and the voltammograms can be interpreted simply as a function of the potential. On the other hand, quasi-reversible and irreversible reactions have relatively slow electron transfer, so that the equilibrium described above cannot be achieved with the potential sweep. Consequently, the concentrations, Cox (0, t) and Cred (0, t), at the potential can vary with time. In such cases, an electrochemical reaction can show totally different voltammograms dependent on the potential change rate and current sampling time. Due to such different behavior of reversible, quasi-reversible and irreversible faradaic reactions, it is not easy to establish a unified measurement/analysis theory applicable to all types of electrochemical reactions. Only few studies provide a measurement/ analysis theory generally applied to any electrochemical reaction, as long as no additional chemical reactions are involved [7,19]. In those studies, the authors used ac cyclic voltammetry and stated that the first harmonic current produced a crossover point at a specific potential referred as cross-over potential. As the cross-over potential is a function of the half-wave potential and α, and excludes any other experimental parameters, it can be used to establish the relationship between half-wave potential and α, regardless of whether the reaction the reversible or non-reversible.
3. Considerations on Impedograms
The faradaic current is produced by the combination of electron and mass transfers, usually modelled by the Randles equivalent circuit. In this model, the two transfers are represented by the polarization resistance (Rp), and Warburg impedance (ZW) given by:
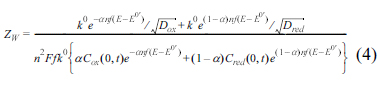
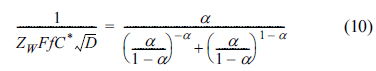
Here Zf is the total faradaic impedance, ω is the angular frequency and i is the imaginary unit. Dox and Dred are the diffusion coefficients of oxidative and reductive species, and D is used for both species. Considering that both equations for Rp and ZW have the same denominator, and the conservation of the total mass, Cox (0, t) + Cred (0, t) = C*, we arrive at:
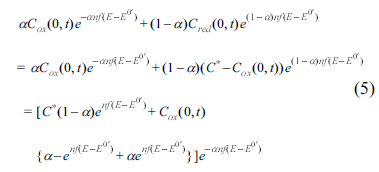
The last expression has two terms, the first one being time-independent and the second one being time-dependent, associated with the potential. For a certain case, there might exist a potential (Esp) that reduces the association to zero, as shown below:
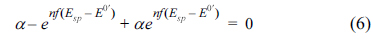
Solving eq (6) gives an explicit expression for Esp:
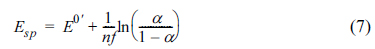
As can be seen from eq (7), Esp is the function of the transfer coefficient only. Plugging eq (7) in eqs (3) and (4), at E = Esp, the polarization resistance and Warburg impedance have unique values given by:

These expressions do not contain any experimental parameters or variables, with Esp being the only specified parameter and independent of experimental conditions. In this case the singular point will be observed at the voltammetric impedograms recorded during the multiple scans of forward and backward (oxidative and reductive) directions with various rates. Fig. 1 shows cyclic voltammograms measured for various k0 in (a) and impedograms of Warburg impedance and polarization resistance in (b) and (c), respectively. These results were obtained theoretically from numerical simulations using finite element method. Details of the numerical method can be found in the literature [20]. The simulation conditions were set at T = 25℃, C*=1.0 mM, and D = 5×10⁻⁶ cm2/s. Specific conditions are given in the captions of each figure. In Fig. 1(a), cyclic voltammograms typically shift to the higher over-potential region, as k0 is decreased in order to achieve low energy and slow electron transfer. On the other hand, for the impedograms given in Fig. 1(b) and (c), the singular point is observed for a specific potential value, even though the rate constants are quite different. This means that the singular point measurement is not limited by the reversibility of the faradaic reaction, but is rather universally applicable. Morever, the values of ZW are the same even with different k0 values and the values of Rp are linear with 1/k0 at Esp. While these unique properties are observed at the potential of Esp, the values of Zw and Rp at other potentials are still subject to time-dependent concentrations and the reversibility of the reactions.
Fig. 1.
(a) Cyclic voltammograms obtained by the finite element method simulations using different k0 values. From the simulation results, the polarization resistances and Warburg impedances are calculated and plotted in (b) and (c), respectively. Simulation conditions: E0’ = 0.0 V, α = 0.5, D = 5×10⁻⁶ cm2/s, ν = 100 mV/s, k0 = 1×100, 1×10⁻¹, 1×10⁻², 1×10⁻³, 1×10⁻⁴, 1×10⁻⁵, 1×10⁻⁶.
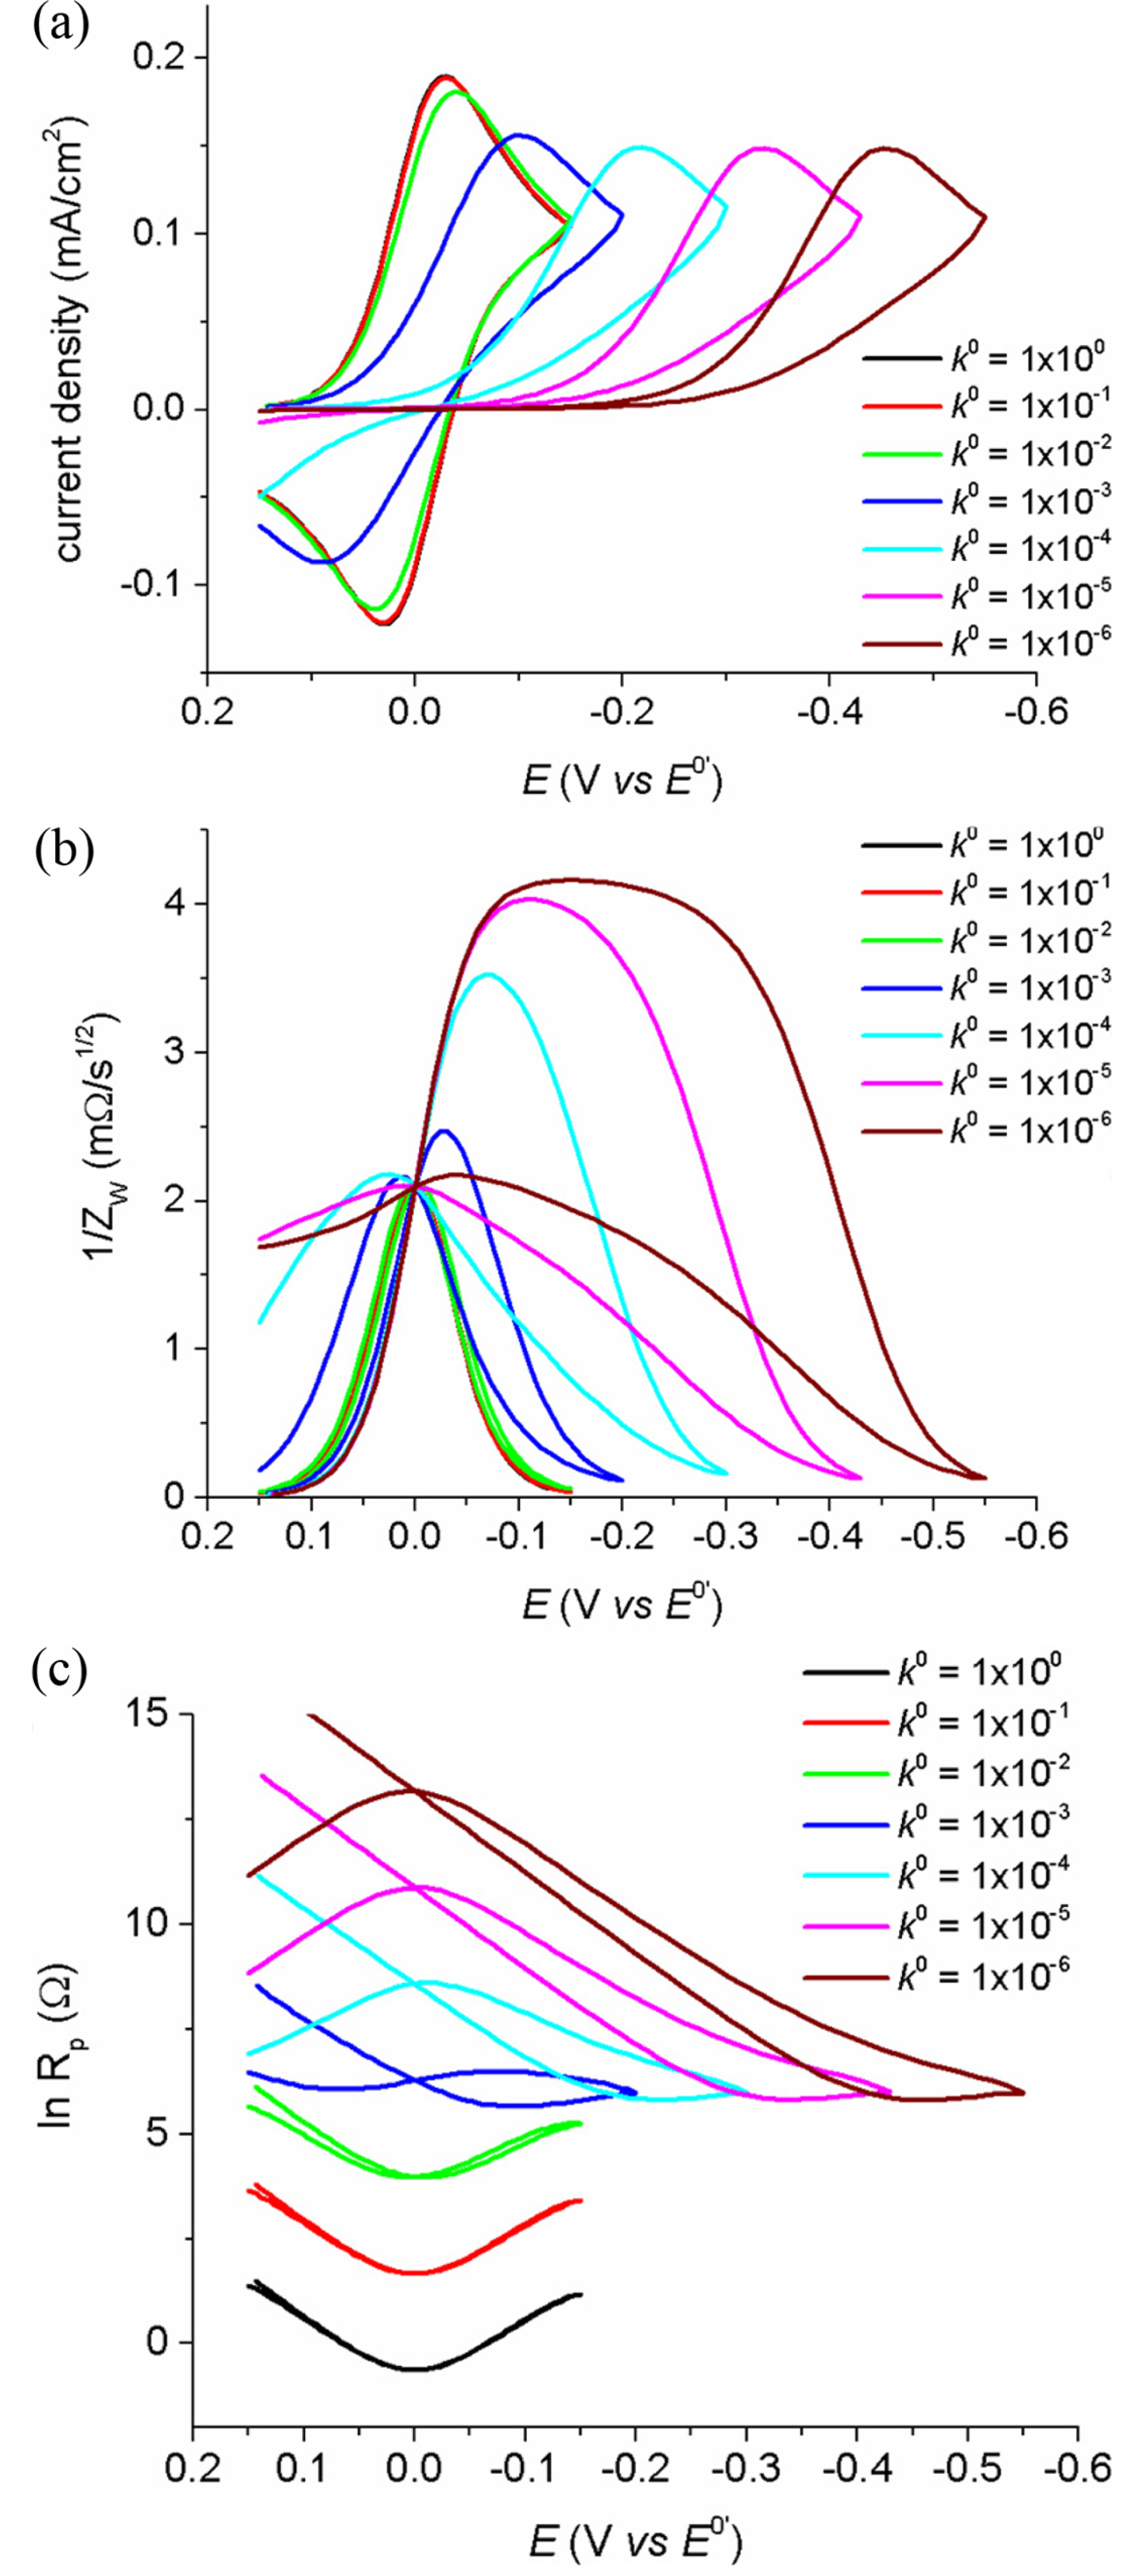
Fig. 2 shows the effect of the scanning rate, which is varied to obtain electrochemical information from the voltammograms. CVs of the irreversible reaction with k0=1×10⁻⁵ cm/s show different curves according to the scanning rates in (a), and so do the impedograms in (b) and (c). However, the singular point in the impedogram is always kept constant at Esp regardless of the scanning rate while nothing constant is seen in the voltammogram.
Fig. 2.
(a) Cyclic voltmmograms of irreversible reaction obtained from numerical simulation with different scanning rates. (b) and (c) show the plots of ln Rp vs. E and 1/ZW vs. E for each voltammogram in (a), respectively. Simulation conditions: E0’ = 0.0 V, k0 = 1×10⁻⁵, α = 0.5, D = 5×10⁻⁶ cm2/s, ν = 20, 50, 100, 200, 500 mV/s.

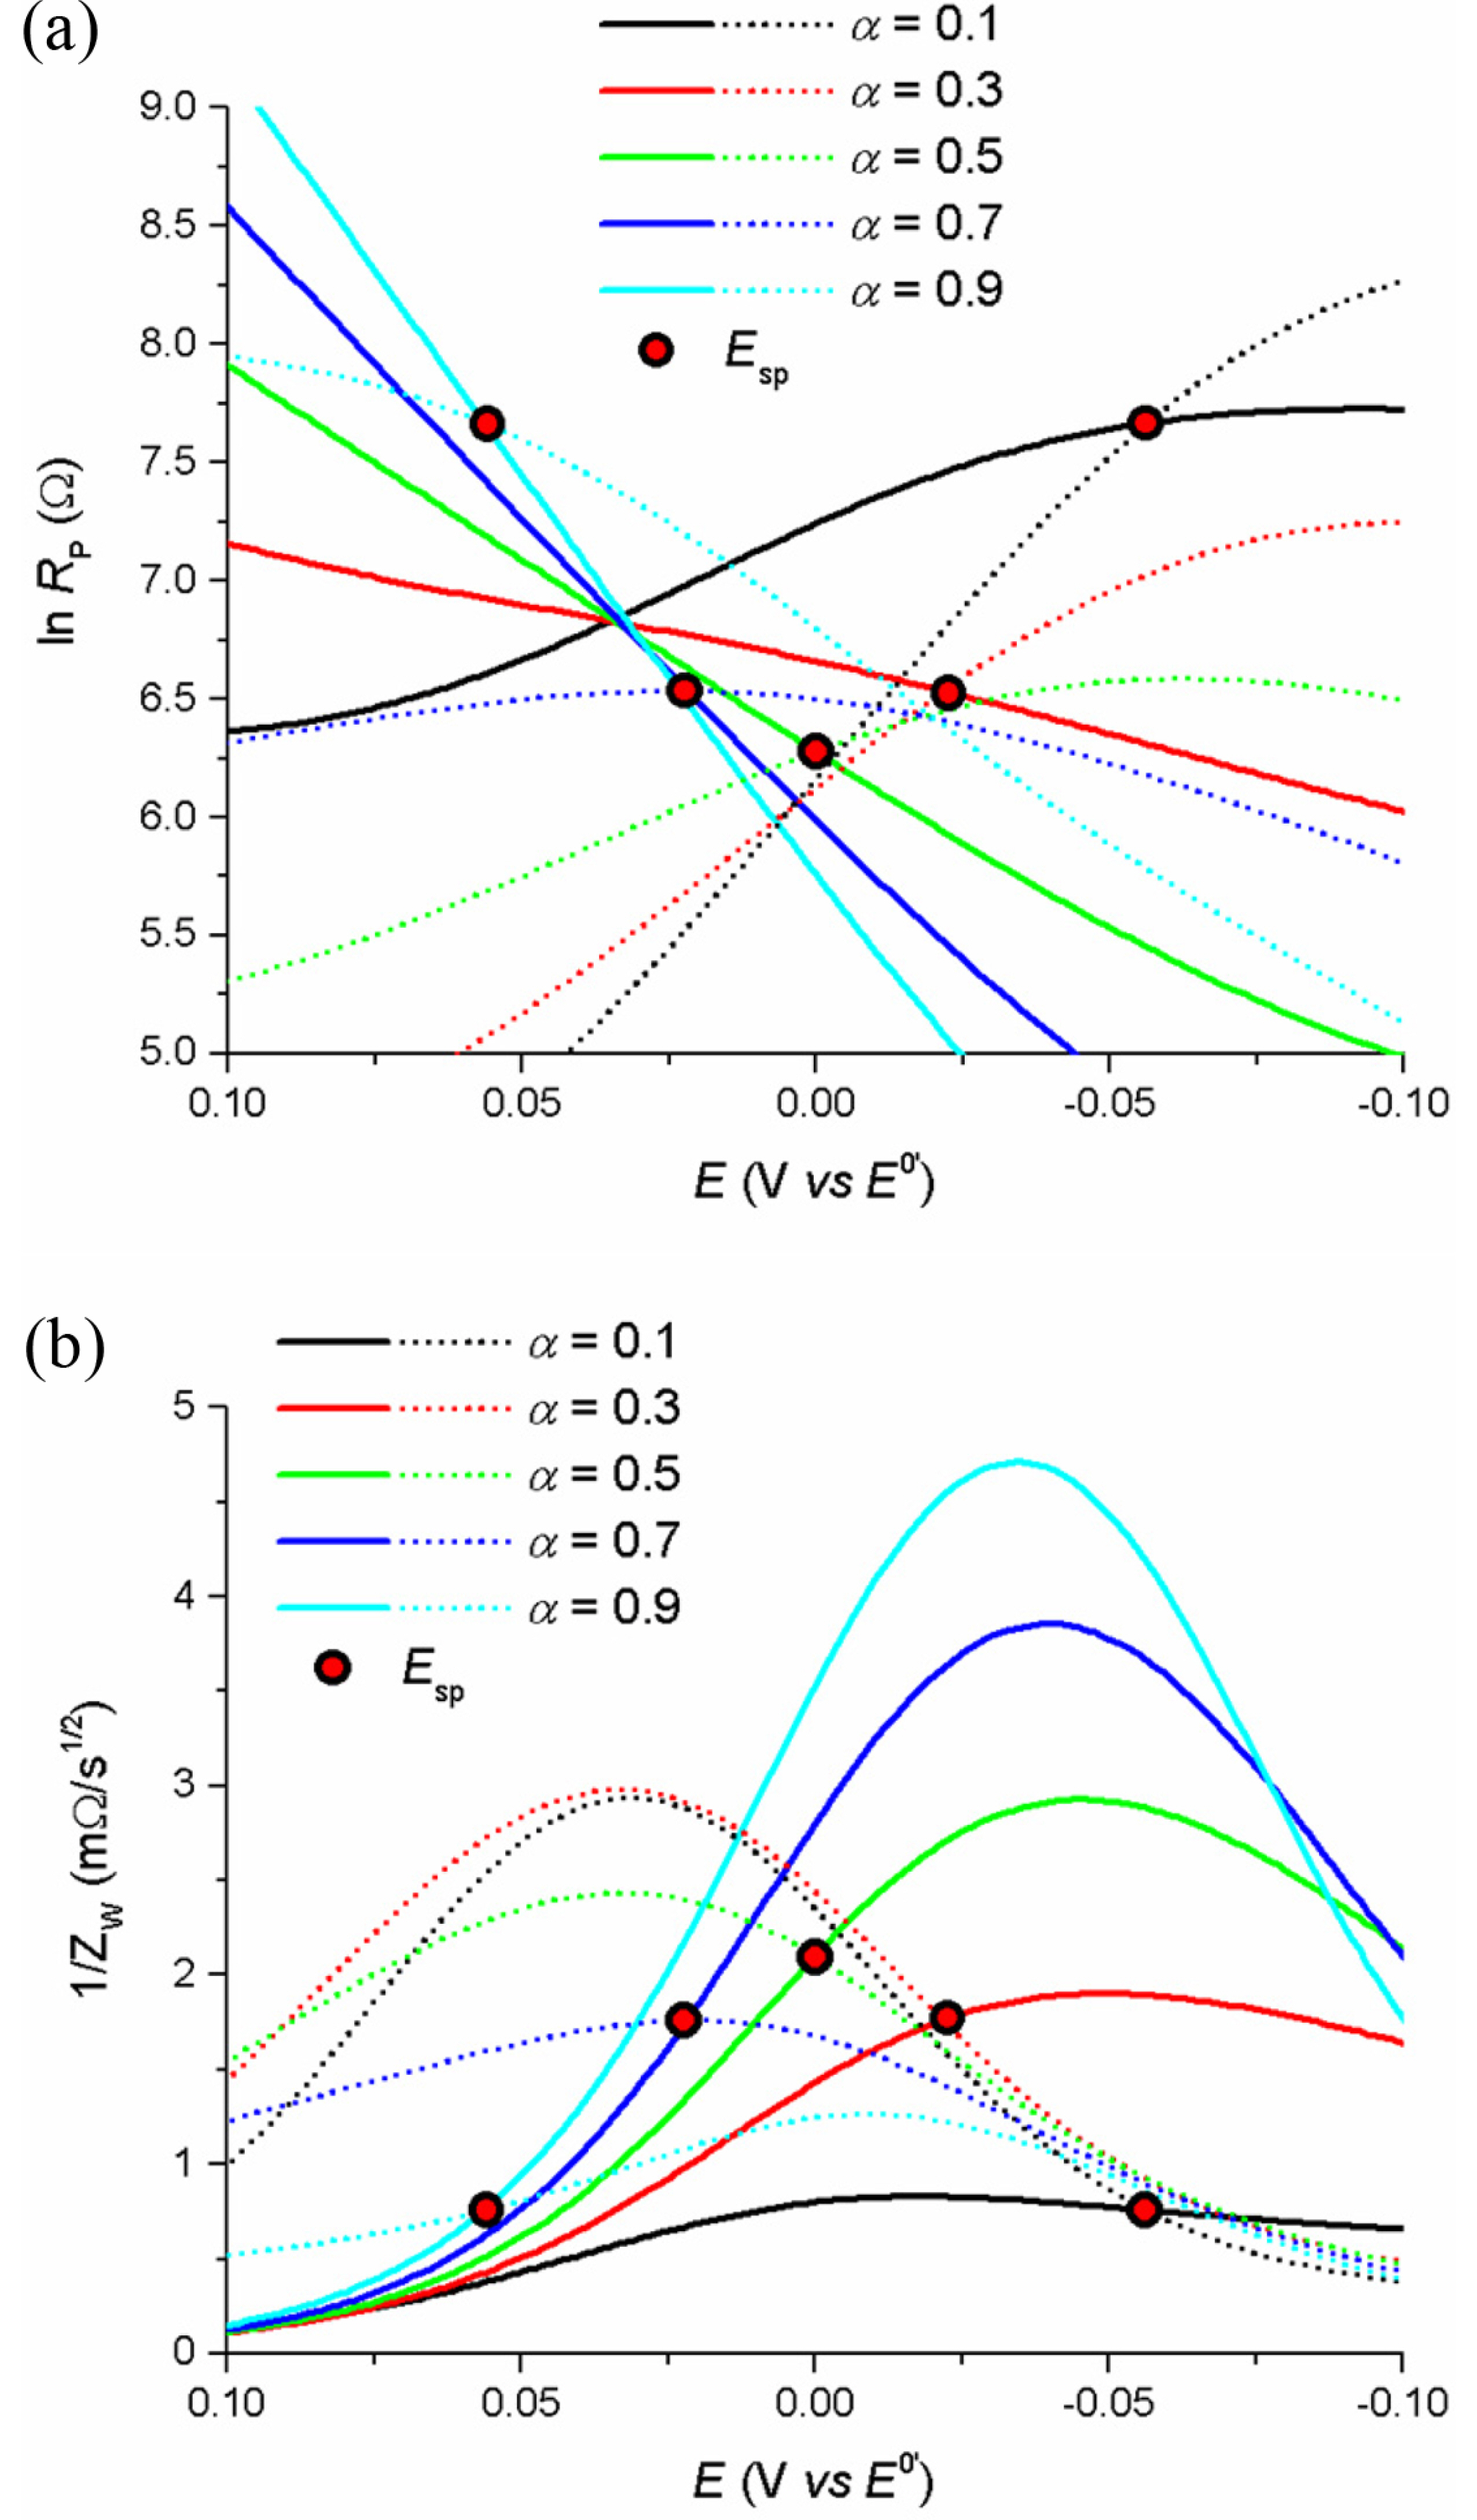
According to eqs (7) to (9), the transfer coefficient changes the potential of the singular point and the impedance values. Fig. 3 shows the changes in ZW and Rp with potential and Esp for the reaction with k0=1×10⁻³ cm/s and varying α. Here, the values of ZW and Rp can be determined by α, and are important to be studied in the context of shifts of Esp from E0’, as will be explained in the application section.
Fig. 3.
(a) and (b) show the plots of ln Rp vs. E and 1/ZW vs. E for different α values, respectively. For better readability, forward and backward scans are shown in solid and dashed lines, respectively, and Esps are marked by the filled circles. Simulation conditions: E0’ = 0.0 V, k0 = 1×10⁻³, D = 5×10⁻⁶ cm2/s, ν = 50 mV/s, α = 0.1, 0.3, 0.5, 0.7, 0.9.
While the Warburg impedance is generated by the mass transfer controlled by diffusion coefficients, the polarization resistance is generated by the electron transfer and controlled by the rate constant. Thus, Rp is directly related to k0. Traditionally, a reversible reaction has the lowest Rp at E=E0’, that is used to calculate the rate constant, and also has a linear relationship between ln Rp and E. The slope and intercept of this plot are used to extract the kinetic data [21]. However, this approach is not applicable to non-reversible reactions, because the surface concentrations of the mass are not fixed at the potentials. As can be seen from eq (8), Rp has a fixed value at E = Esp, regardless the surface concentrations, and easily yield the value of k0. Fig. 1(c) presents ln Rp vs. E plots for various k0 values. The singular points are measured only at Esp, while the minimums are achieved for different potentials, dependent on the rate constants, scanning rates or measurement times.
4. Application of the Singular Point
Using Fourier transform electrochemical impedance spectroscopy (FTEIS) or other potentiodynamic impedance techniques, impedograms of mass transfer impedance and polarization resistance are measured, as the cyclic voltammograms are obtained with the potential sweeping in both reductive and oxidative directions. Even though the measurements are technically straightforward, the analysis is not easy, because of the large data arrays acquired. Unfortunately, analysis algorithms have not been developed simultaneously with the measurement techniques. In this section, I suggest an analysis protocol for voltammetric impedance data acquisition using the singular point.
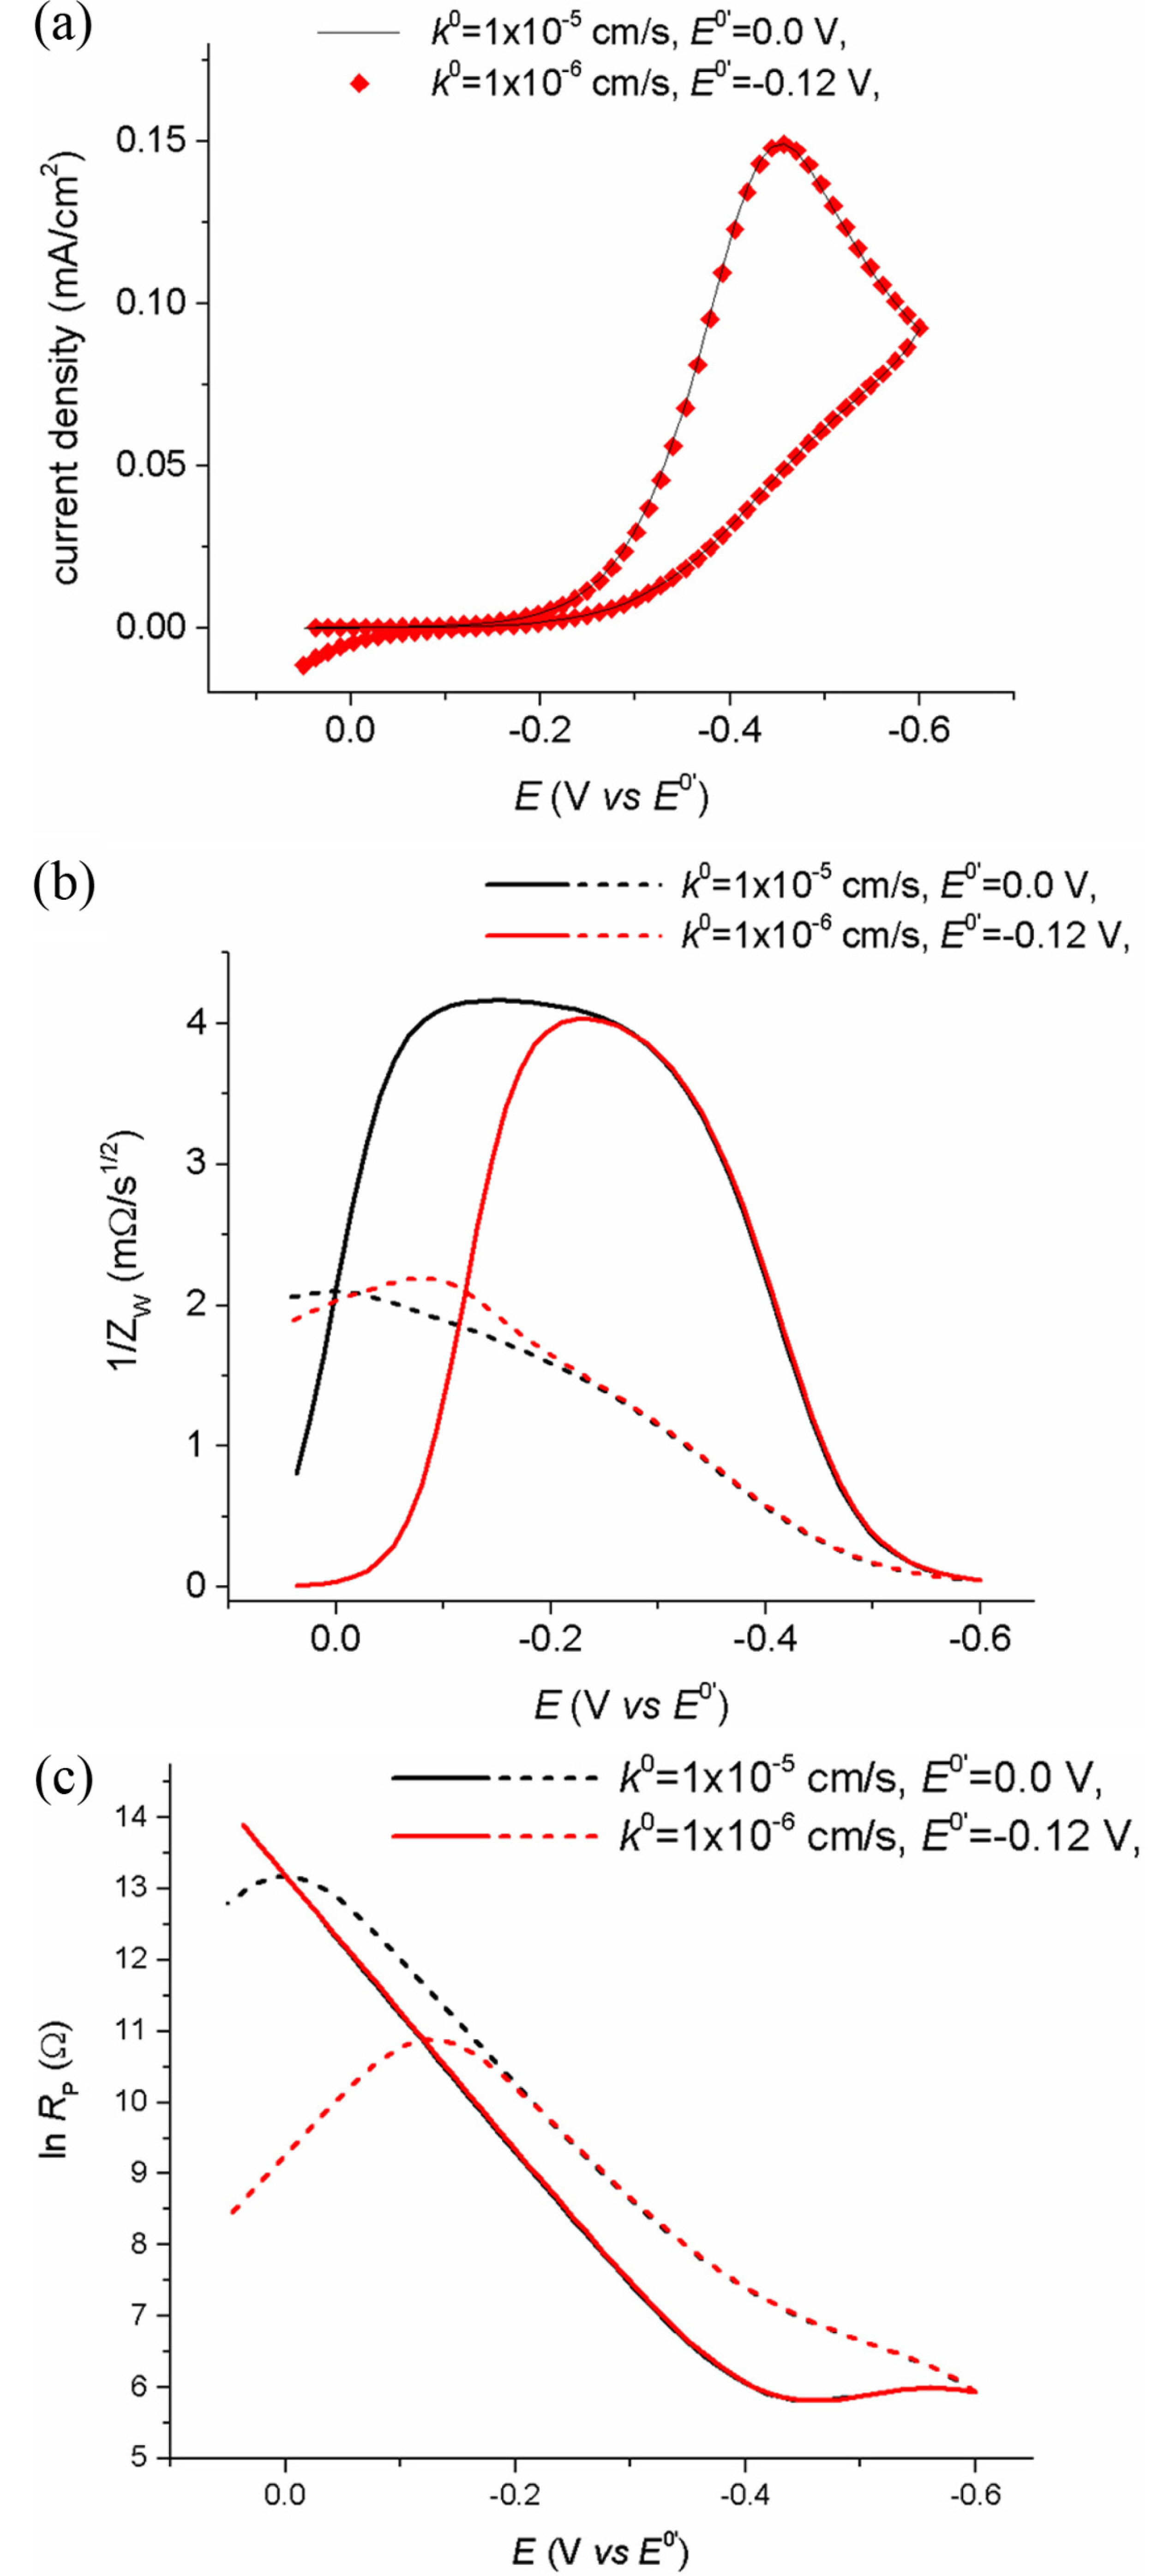
In order to obtain thermodynamic and kinetic data of faradaic reaction, its standard or formal potential has to be studied first, because the measured currents are dependent on the potential difference from the standard or formal potential. For a reversible reaction, the formal potential, E0’, can be easily measured by taking the mean value between the anodic and cathodic peak potentials. However, for non-reversible reactions, the lack of reversibility does not guarantee successful use of the peak couple to find E0’. As shown in Fig. 1(a), the peak potentials of the voltammograms shift by k0, not E0’, and two voltammograms of different reactions having different k0 and E0’ appear almost the same (Fig. 4(a)). These results reveal that there is no way to figure out whether the potentials shifts come from k0 and E0’, because the apparent current value is a compromised result between the potential and rates of electron and mass transfer. Thus, we cannot ensure the identification of peaks, and their related measurement results, until we get all the necessary information. However, the singular point will provide an easier way to achieve this.
Fig. 4.
(a) Cyclic voltammograms of two irreversible reactions having different E0’ and k0. Simulation conditions: D = 5×10⁻⁶ cm2/s, ν = 50 mV/s, α = 0.5, E0’ = 0.0 and −0.12 V, k0 = 1×10⁻⁵ and 1×10⁻⁶. (b) and (c) show plots of ln Rp vs. E and 1/ZW vs. E for each voltammogram in (a). The forward and backward scans are shown in solid and dashed lines, respectively,
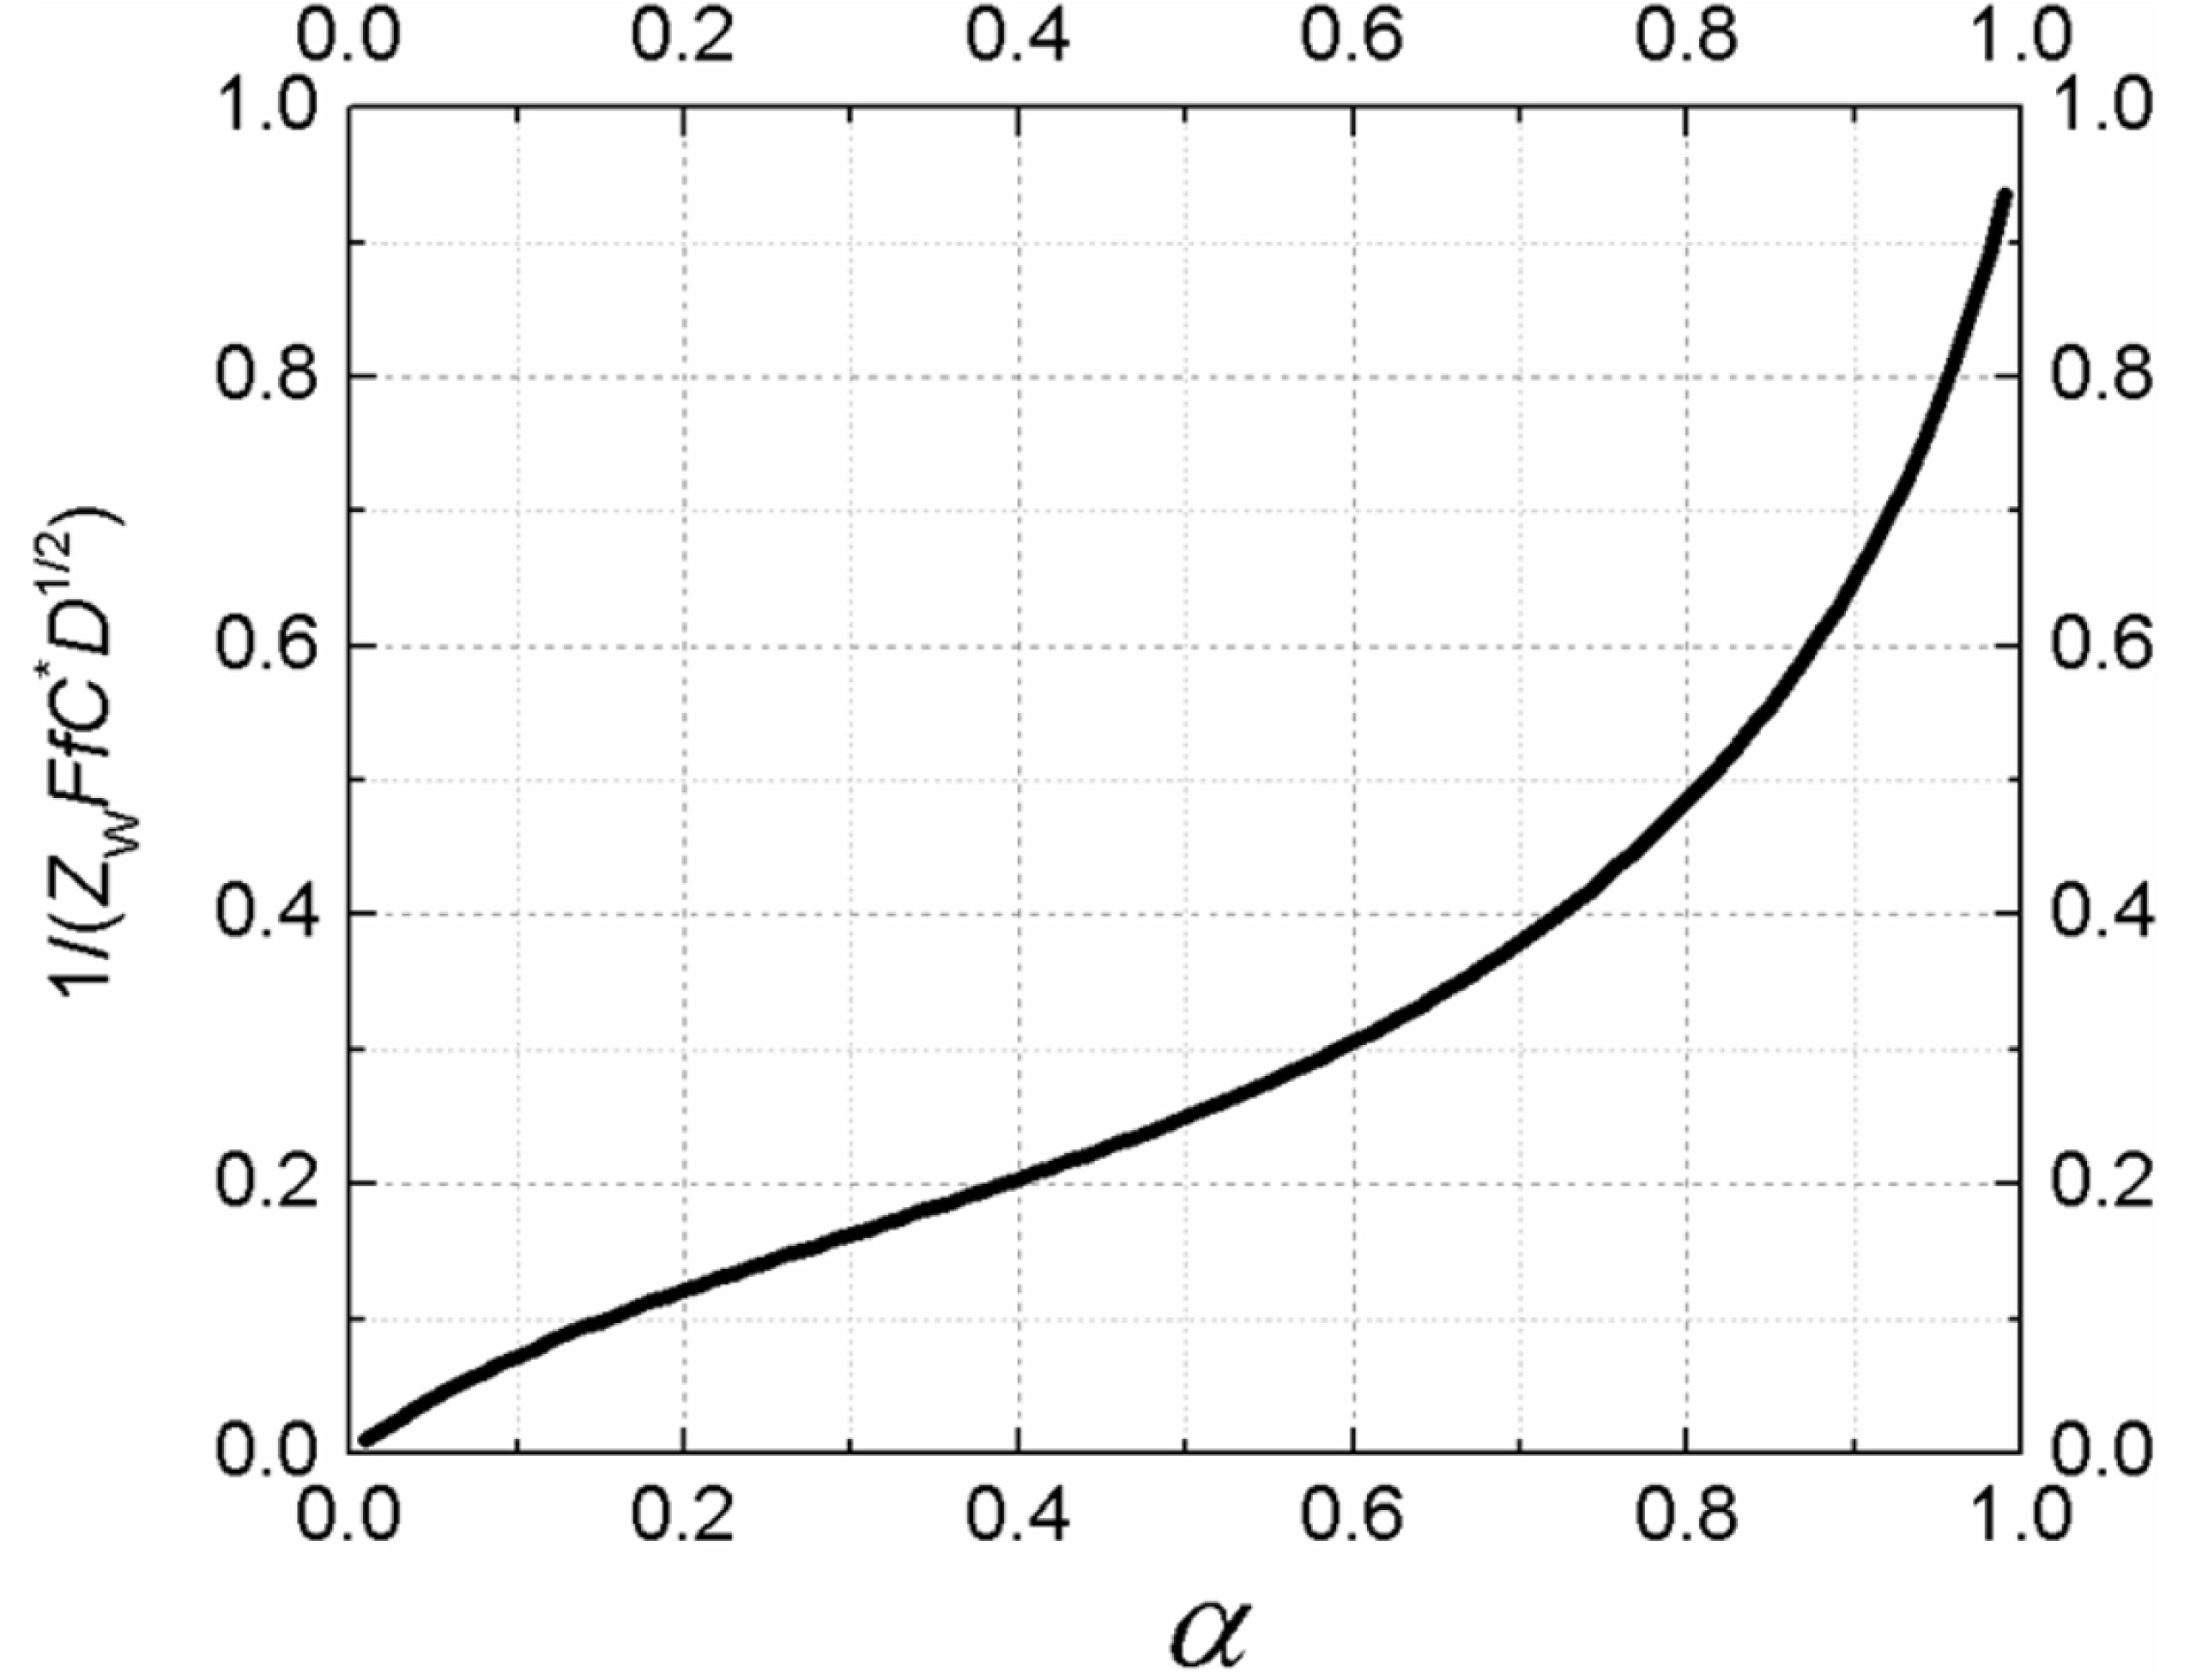
Before we construct an impedogram, the diffusion coefficient is easily calculated from the voltammograms for various scanning rates, as routinely done in many electrochemical studies (Fig. 2). Fig. 5 shows the plot of the below equation comprising measured Zw at Esp and other pre-known values.
As the singular point has a number along the curve in Fig. 5, we can find the value of the transfer coefficient by tracing the curve. For example, if 1/ZW is measured to be 500 Ω/s-1/2 at T = 25℃, C* = 1.0 mM, and D = 5.0×10⁻⁶ cm2/s, then  and consequently α = 0.48. Using this number, we can determine the formal potential from eq (7). Based on this, we can also calculate the exchange current and the rate constant [22]. Eventually, we can obtain almost all essential information about an irreversible electrochemical reaction using voltammograms and mass transfer impedance.
and consequently α = 0.48. Using this number, we can determine the formal potential from eq (7). Based on this, we can also calculate the exchange current and the rate constant [22]. Eventually, we can obtain almost all essential information about an irreversible electrochemical reaction using voltammograms and mass transfer impedance.
Another way to obtain the rate constant is to use eq (8) with α obtained above and the measured Rp. For non-reversible reactions, the values of Rp at E0’ of the same system can be different for different scanning rates, and the minimum values can also be found for different potentials. However, at Esp, Rp is fixed, regardless of the experiment conditions.
5. Conclusions
I have discussed the ways we can use voltammetric impedogram to extract useful data. To meet the demand for better electrochemical measurement techniques, substantial instrumental developments have been made, but complementary analysis treatments have not advanced simultaneously. To address this issue, I propose an analysis algorithm using voltam-metric impedogram. A voltammetric impedogram has a specific potential, where the surface concentrations of the redox species are inactive, and consequently the measured values are constant, regardless of the experiment conditions. The constant value is shared by many voltammetric impedance curves; a singular point is observed by overlapping the curves.
Based on this unique property, an analysis algorithm for electrochemical impedance data was developed by using the singular point as a reference. Using this method, it is possible to perform straight-forward calculation of the transfer coefficient, formal potential, and rate constant of non-reversible reactions. Even though only the concepts and theoretical proofs are presented now, it will be reported in the future how the proposed analysis protocol is used for experimental impedance data of complex reactions involving electrochemical and chemical reaction mechanisms.
6. Digital Simulation by the Finite Element Method
In order to obtain the ideal cyclic voltammograms and the values of polarization resistance and Warburg impedance, numerical simulations were performed using finite element method. The molecular species Ox and Red have their concentrations denoted by Cox and Cred, of which the values are digitized in finite elements defined by the distance (d) and time (t), as Cox(d,t) and Cred(d,t). For numerical simulation using MATLAB, the values were nondimensionalized replacing d with d/Δd, and t with t/Δt. Here, Δd and Δt are the unit increments of d and t.
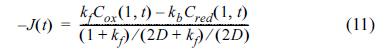
The calculations of Cox (d, t) and Cred (d, t) were carried out taking the charge transfer and the mass transfer into account, which were finally evaluated as the flux of the Ox and Red. For the consistency of the dimensionless unit, the rate constants, kf and kb, were multiplied by Δt/Δd and the diffusion coefficient, D, was multiplied by DΔt/Δd2. Then, the dimensionless flux at the electrode surface was calculated as:
Meanwhile, the change of the concentrations in the bulk solution were determined by diffusion, so that they can be calculated from Fick’s laws, as shown below: