Effects of Diffusion Layer (DL) and ORR Catalyst (MORR) on the Performance of MORR/IrO2/DL Electrodes for PEM-Type Unitized Regenerative Fuel Cells
Article information
Abstract
This study aims to examine the influences of substrates/diffusion layers (DL) and oxygen reduction reaction catalysts (MORR) on the performance of MORR/IrO2/DL-type bifunctional oxygen electrodes for use in polymer electrolyte membrane (PEM)-type unitized regenerative fuel cells (URFC). The MORR/IrO2/DL electrodes were prepared via two sequential steps: anodic electrodeposition of IrO2 on various DLs and fabrication of MORR layers (Pt, Pd, and Pt-Ru) by spraying on IrO2/DL. Experiments using different DLs, with Pt as the MORR, revealed that the roughness factor of the DL mainly determined the electrode performance for both water electrolyzer (WE) and fuel cell (FC) operations, while the contributions of porosity and substrate material were insignificant. When Pt-Ru was utilized as the MORR instead of Pt, WE performance was enhanced and the electrode performance was assessed by analyzing round-trip efficiencies (εRT) at current densities of 0.2 and 0.4 A/cm2. As a result, using Pt-Ru instead of Pt alone provided better εRT at both current densities, while Pd resulted in very low εRT. Improved efficiency was related to the additional catalytic action by Ru toward ORR during WE operation.
1. Introduction
Regenerative fuel cells (RFCs) are large-scale energy storage devices that utilize H2 gas as an energy medium [1-3]. Such devices are capable of both producing H2 gas from electrical energy via water electrolysis and reconverting it into electricity. RFCs have various advantages over conventional batteries (Li ion battery, Ni/Cd battery, Pd/acid battery etc.), such as the absence of self-discharge and high specific energy density (up to 450 Wh kg−1 ) [1]. Therefore, RFCs have received attention in applications where long-term energy storage is required, such as off-grid power supply systems, uninterruptible power supply systems, military applications, and space applications [1-6]. RFCs can be classified into two categories: discrete regenerative fuel cells (DRFCs) and unitized regenerative fuel cells (URFCs). DRFCs, which comprise separate fuel cell (FC) and water electrolyzer (WE) units, have lower technical barriers due to well-developed FC and WE technologies, but require high system volumes and complex integration. In contrast, URFCs employ bifunctional electrochemical cells that can work as both WE and FC; therefore, they have various benefits like lower capital cost, simpler structure, higher specific energy, and no need for auxiliary heating [1-6]. However, as the cell performance of URFC is typically lower than those of individual WE and FC systems, the application of URFC is currently limited to space applications where stack weight is critical [4].
In addition to the above-mentioned factors, URFCs require large amounts of novel catalysts to catalyze both FC and WE reactions, which is considered one of the significant hurdles. The use of a large amount of noble catalyst makes the URFC costly, and thus, efforts to reduce cost are necessary for the commercialization of URFC. According to Gabbasa et al., the total expense for a URFC stack (98 $/kW) is almost two times higher than the target value (51 $/kW) [5]. Therefore, substantial efforts have been devoted to improve cell efficiency while simultaneously reducing the cost. In particular, the development of an efficient bifunctional oxygen electrode imposing low overpotential toward both oxygen evolution reactions (OER) and oxygen reduction reactions (ORR) has been intensively researched. When bifunctional oxygen electrodes are prepared by mixing OER (Ir, IrO2, Ru, RuO2, etc.) and ORR (Pt) catalyst particles, relatively high performances can be obtained (>1.0 A/cm2 @ 1.7 V in WE mode and >0.7 A/cm2 @ 0.6 V in FC mode), but this process requires large amounts of novel catalysts at the oxygen electrode (1.5-4.0 mg/cm2) [7-14]. For an oxygen electrode where the catalyst loading is less than 1.0 mg/cm2 [15, 16], the performance is not satisfactory, especially when operating in the FC mode (<0.5 A/cm2 @ 0.6 V). In order to achieve acceptable performance with low catalyst loading, novel catalyst composites that catalyze both OER and ORR, such as SiO2-SO3H-supported Pt [17], deposited RuO2-IrO2/Pt [18], Ti/Pt-IrO2 [19], Pt/porous-IrO2 nanocomposites [20], and Pt/Irx(IrO2)10-x [21] have been suggested, but their applications to single cells or stacks have rarely been reported.
Previously, we demonstrated a sprayed ORR catalyst (MORR)/electrodeposited IrO2/diffusion layer (DL)-type oxygen electrode that achieved high performance (1.56 A/cm2 @ 1.7 V in the WE mode and 0.87 A/cm2 @ 0.6 V in the FC mode) despite low catalyst loading (0.4 mg/cm2) [22]. Here, the DL also acts as a substrate for electrodeposition and thus determines the interfacial area between the electrolyte (ionomer, membrane) and electrode, which is a part of the 3-phase boundary where the electrode, electrolyte, and reactant feed meet. Hence, designing the DL for an MORR/IrO2/DL-type electrode is a difficult task: both the mass transfers of reactant/product feeds and the electrode/electrolyte interface should be considered to ensure cell efficiency. Though the roles of the DL as a current collector and mass transfer pathway have been intensively researched [23-27], additional study is required to detail the factors affecting electrode performance.
In addition, research on alternative MORR to replace Pt is also necessary in order to reduce the overall cost of URFC. Though Pt is the most commonly preferred MORR, it is very expensive and its usage is as high as 50–80% of total loading [7-14]. Hence, it is important to find alternative MORRs that are less costly and provide acceptable performance. However, no single metal has been reported to surpass the activity of Pt toward ORR [28]. Instead of searching for new single-metal MORRs, adding more efficient OER catalysts, such as Ru [29], could be a feasible plan to reduce Pt loading without significant performance deterioration. Generally, the round-trip efficiency (εRT), a parameter used to evaluate the total voltage efficiency of URFCs, is defined as the voltage requirement for the FC mode over that for the WE mode at a given current density. Accordingly, voltage loss during FC operation could be offset when the voltage during WE operation is simultaneously reduced. From this point of view, Pd is also an attractive candidate because its activity toward OER surpasses that of Pt [29], while that toward ORR is relatively low. According to previous reports [28, 29], the catalytic activity of Pt, Pd, and Ru toward OER is in the order Ru > Pd > Pt, while that toward ORR is in the order Pt > Pd > Ru. It is also important to note that the average price of Pt from 2005 to 2015 is ~1363 US$/oz., while those of Pd, Ru, and Ir are 514 US$/oz., 175 US$/oz., and 592 US$/oz., respectively [30].
In this study, we investigated the influences of the DL and alternative MORR (Pd and Pt-Ru) on the performance of an MORR/IrO2/DL electrode. Three DLs (two carbon papers and one Ti paper)—characterized in terms of material, porosity, and roughness factor—were selected as the model systems. The influences of material, porosity, and roughness factor on the cell performance are discussed in detail by comparing single-cell performances with different DLs. In addition, the applicability of MORRs (Pd and Pt-Ru) as alternatives to Pt was assessed by considering the cost in addition to the cell efficiency. Total cell efficiency was evaluated based on the analysis of εRT at current densities of 0.2 and 0.4 A/cm2.
2. Experimental Section
The MORR/IrO2/DL electrode was prepared via the sequential steps of electrodeposition (IrO2) and spraying (Pt, Pd, Pt-Ru) on various DLs. First, an IrO2 film was electrodeposited based on our reported procedure [22,31,32]. A deposition potential (Edep) of 0.7 V (vs. standard calomel electrode (SCE)) was constantly applied for a deposition time (tdep) of 10 min, which resulted in an IrO2 loading of 0.1 mg/cm2. Electrodeposition was carried out with a potentiostat of commercial design (AUT302N, Auto Lab Ltd.). One among the two commercial carbon papers called CP1 and CP2 or a titanium paper called TP was used as the DL. The roughness factor, which is the ratio between real surface area and geometric area, was calculated from the thickness of papers (t), porosity of papers (p), and diameter of fibers (D) as: roughness factor = 4t(1-p)/D.
After IrO2 electrodeposition, the catalyst ink—composed of catalyst particles, 5 wt% Nafion solution (Dupont), isopropyl alcohol (IPA, J.T. Baker), and deionized water—was sprayed onto the DL. Pt black (Johnson Matthey), Pd black (Alfa Aesar), or a 1:1 mixture of Pt black and Ru black (Alfa Aesar) was deposited via spraying. The loading of the catalyst was controlled to 0.3 mg/cm2. The resulting electrode structures were named MORR/IrO2/DL. The morphology and composition of the electrode were verified using a field-emission scanning electron microscope (FESEM, Inspect F50, Field emission Inc.) coupled with energy-dispersive spectroscopy (EDS) analyses. To prepare the hydrogen electrode, the catalyst ink composed of 46.5 wt% Pt/C, 5 wt% Nafion solution, IPA, and deionized water was sprayed on commercial carbon paper. The Nafion content was 30 wt%, and the loading amount of Pt was fixed at 0.4 mg/cm2.
The membrane electrode assembly (MEA) was prepared by placing the oxygen and hydrogen electrodes on either side of the Nafion membrane (NR-212, Dupont). To test the FC, fully humidified H2 and O2 gases at a flow rate of 100 mL/min were injected to the hydrogen and oxygen electrodes, respectively. The iV curve was obtained at current densities from 0 to 1.2 A/cm2. To test the WE, deionized water was fed to the oxygen electrode at a flow rate of 15 mL/min. The iV curves of the cells were obtained using multi-step chronoamperometry from 1.35 to 1.8 V. The duration of each step was fixed at 60 s. All measurements were conducted at 80℃ using a potentiostat (HCP-803, Biologics) combined with a power booster.
3. Results and Discussion
Though both CP1 and CP2 are composed of carbon fibers with an average diameter of 8 μm, CP2 has 14% higher porosity than CP2, which provides better transfer of reactants/products (water and O2 gases) [25], but its low roughness factor might be detrimental to the interfacial area between the electrolyte and the electrode. The TP consists of hydrophilic Ti fibers with an average diameter of 20 μm, and its hydrophilic surface might have a positive impact on water supply during WE operation relative to CP1 [23]. TP has porosity similar to CP1 and the lowest roughness factor among the DLs tested in this study. IrO2 (electrodeposition, 0.1 mg/cm2) and unsupported Pt particles (spraying, 0.3 mg/cm2) were sequentially deposited on the three DLs to fabricate MORR/IrO2/DL-type bifunctional oxygen electrodes: Pt/IrO2/CP1, Pt/IrO2/CP2, and Pt/IrO2/TP. The morphologies and corresponding EDS results for Pt and Ir are shown in Fig. 1. Consistent with our previous study [22], a porous Pt layer with submicron-sized pores was observed regardless of the DL. Moreover, the EDS results revealed that both IrO2 and Pt black were uniformly distributed and did not cause any noticeable changes in the macroporous structures of the carbon and Ti DLs.
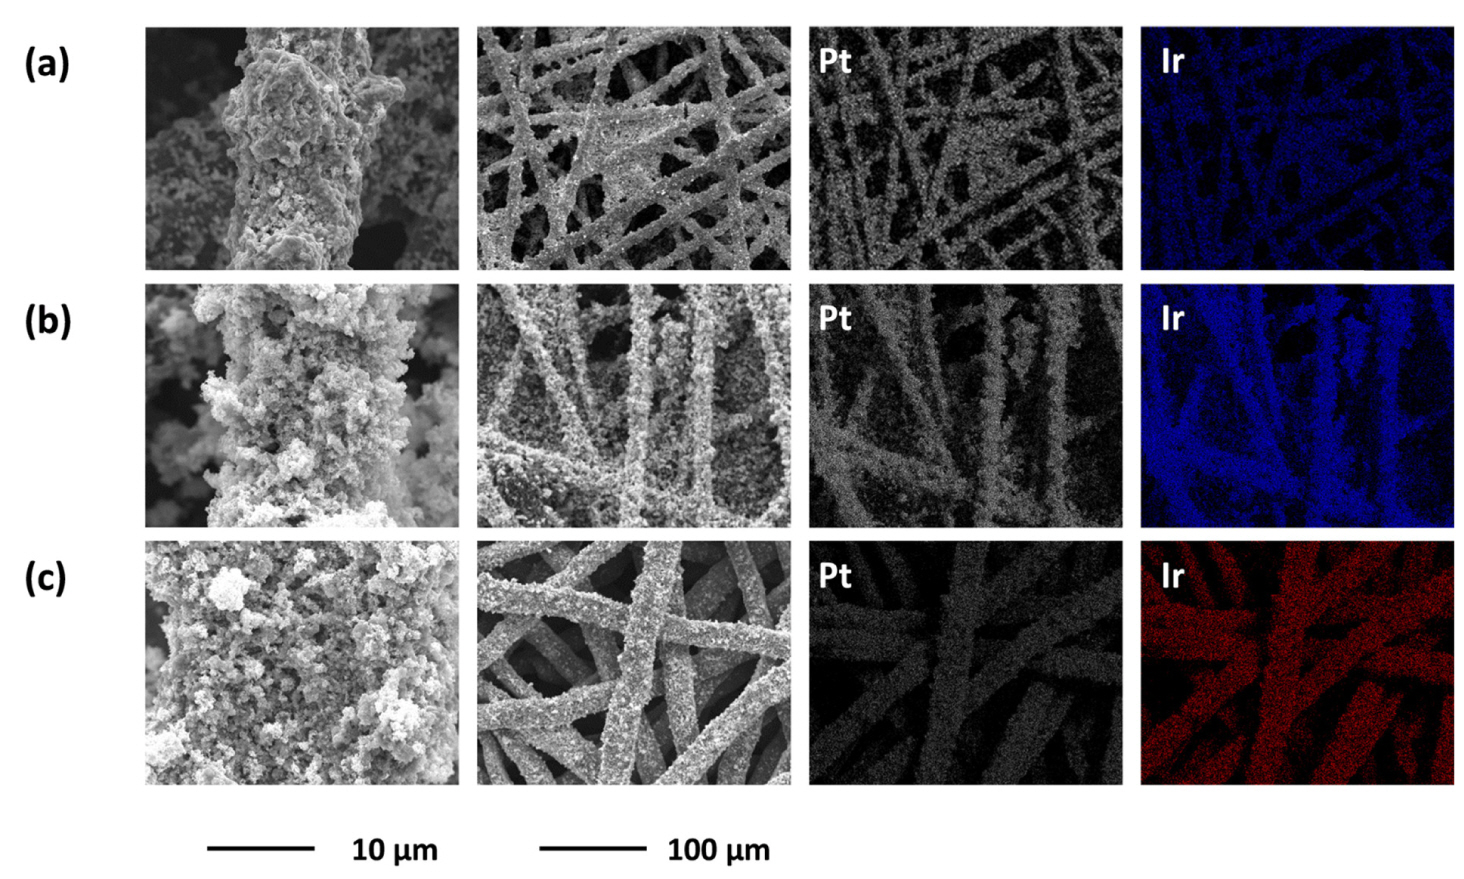
Surface morphologies (first and second columns) and corresponding EDS mapping results (third and fourth columns) of (a) Pt/IrO2/CP1, (b) Pt/IrO2/CP2, and (c) Pt/IrO2/TP electrodes. The magnifications of the third and fourth columns are equivalent to that of the second column.
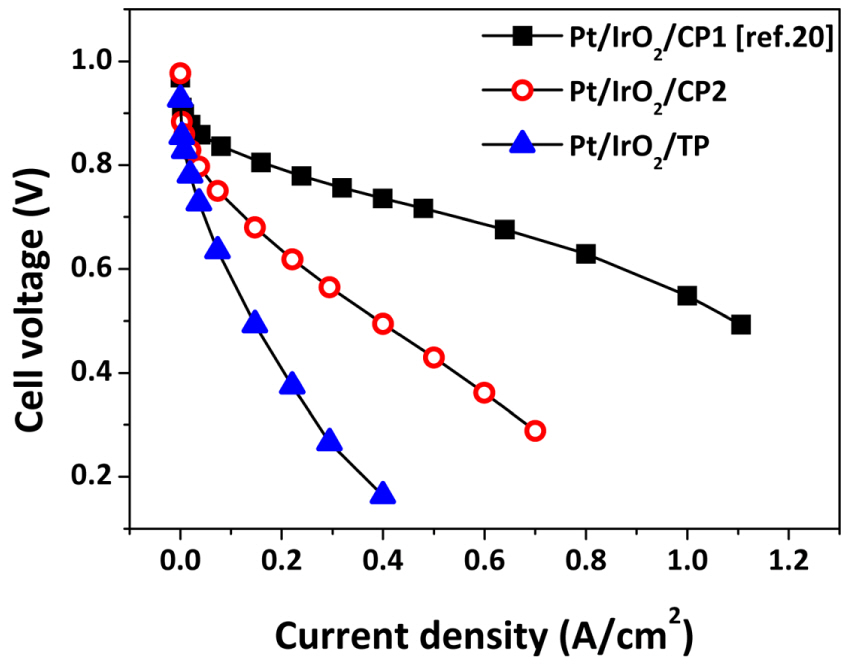
Fig. 2(a) presents the iV curves for the Pt/IrO2/CP1, Pt/IrO2/CP2, and Pt/IrO2/TP electrodes in the WE mode. The electrode performance was in the order Pt/IrO2/CP1 > Pt/IrO2/CP2 > Pt/IrO2/TP for all voltage ranges. Notably, this order corresponds to the roughness factor of the DL. As mentioned above, the DL influences the electrode/electrolyte interface and the mass transfer of the reactant, where the former should be dependent on the roughness factor while the latter is affected by porosity and the nature of substrate materials [23-27]. Hence, this result is an indication that the electrode/electrolyte interface is the dominant factor for cell performance rather than mass transfer. The correlations between the roughness factor and current density at 1.6, 1.7, and 1.8 V are presented in Fig. 2(b). The current density was approximately proportional to the roughness factor of DL at all cell voltages, indicating that the impact of mass transfer is less significant.

In the FC mode, cell performance was in the order Pt/IrO2/CP1 > Pt/IrO2/CP2 > Pt/IrO2/TP over the entire voltage range (Fig. 3), like in the WE mode. The roughness factor seems to be more significant than porosity and substrate material. However, unlike in the WE mode, the electrode performance was not perfectly proportional to the roughness factor. The specific current densities at 0.6 V (the current density divided by roughness factor) for Pt/IrO2/CP1, Pt/ IrO2/CP2, and Pt/IrO2/TP were 24.26, 13.04, and 7.44 mA/cm2, respectively, indicating that the cell performance is affected not only by the electrode/electrolyte interface, but also by other factors such as mass transfer. Figs. 2 and 3 show that the roughness factor should be primarily considered when designing the DL of MORR/IrO2/DL-type electrodes. The impacts of porosity and substrate material are relatively insignificant, although both affect the mass transfer of the reactant feed.
Using CP1—which provided the highest cell performance—as the DL, the effect of MORR was investigated by preparing Pd/IrO2/CP1 and Pt-Ru/IrO2/CP1, and compared to Pt/IrO2/CP1. Both Pd and Pt-Ru are candidates to replace Pt as MORR, being less costly and more active than Pt toward OER. Fig. 4 shows that the porous structured Pd and Pt-Ru were uniformly distributed over the surface of CP1, similar to Pt/IrO2/CP1. The pore size in the Pd and Pt-Ru layers in Pd/IrO2/CP1 and Pt-Ru/IrO2/CP1, respectively, were on the submicron scale similar to that of the Pt layer.
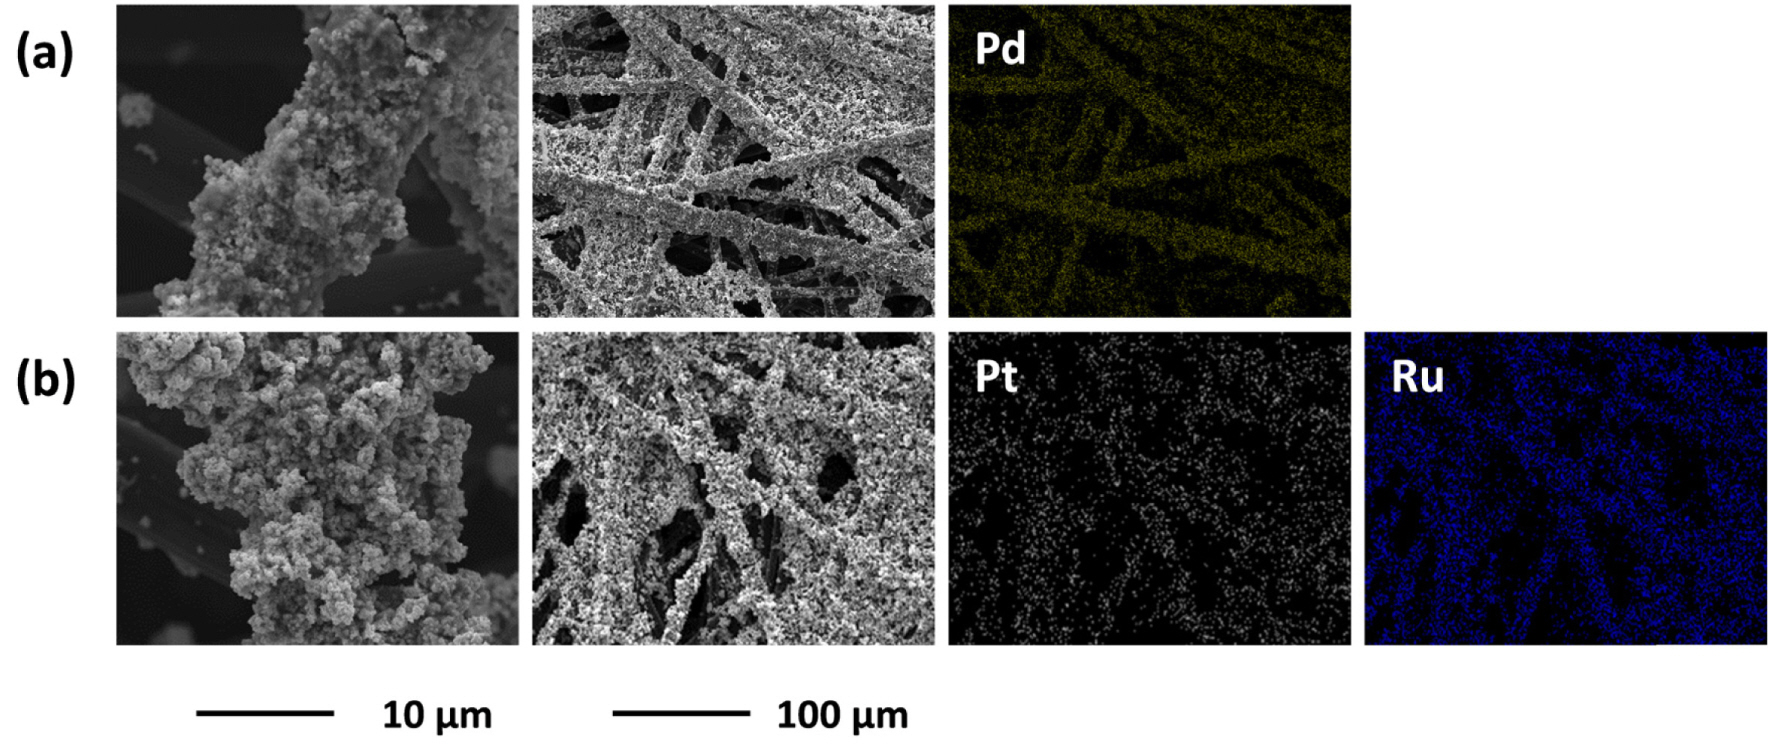
Surface morphologies (first and second columns) and corresponding EDS mapping results (third and fourth columns) of (a) Pd/IrO2/CP1 and (b) Pt-Ru/IrO2/CP1 electrodes. The magnifications of the third and fourth columns are equivalent to that of the second column.
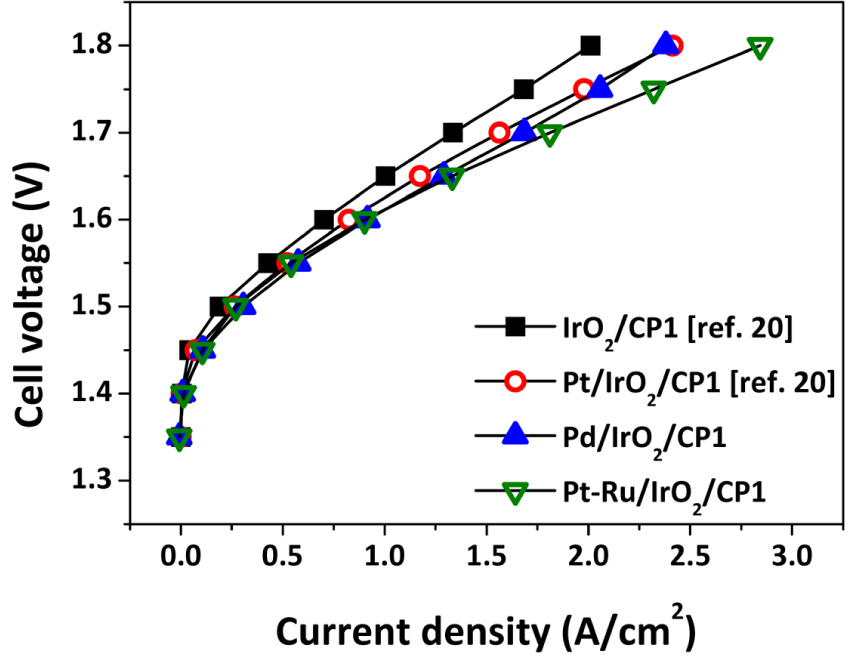
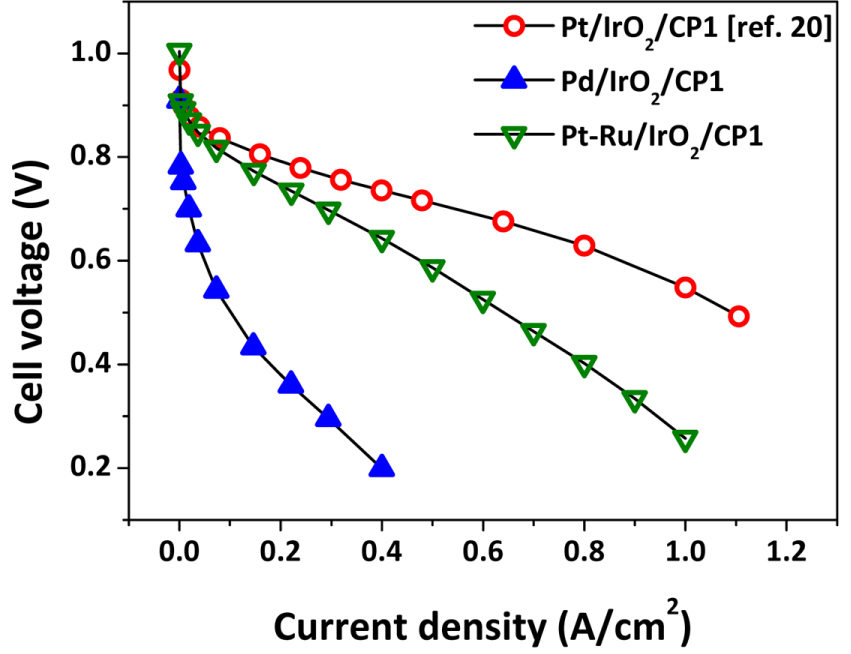
The iV curves for Pd/IrO2/CP1 and Pt-Ru/IrO2/CP1 electrodes during WE operation are shown in Fig. 5. For reference, those for IrO2/CP1 and Pt/IrO2/CP1 are also presented [22]. As shown, the performance at low voltage (<1.75 V), where activation overpotential is most significant, is in the order Pt-Ru/IrO2/CP1 > Pd/IrO2/CP1 > Pt/IrO2/CP1. Such high WE performance for Pt-Ru/IrO2/CP1 and Pd/IrO2/CP1 could be explained by the higher OER activities of Ru and Pd than Pt [29]. Fig. 6 presents the iV curves for Pt/IrO2/CP1, Pd/IrO2/CP1, and Pt-Ru/IrO2/CP1 during FC operation. As expected, both Pt-Ru/IrO2/CP1 (0.48 A/cm2 @ 0.6 V) and Pd/IrO2/CP1 (0.052 A/cm2 @ 0.6 V) underperformed relative to Pt/IrO2/CP1 (0.87 A/cm2 @ 0.6 V), probably due to the low catalytic activities of Ru and Pd toward ORR [28]. Notably, the current density of Pt-Ru/IrO2/CP1 at 0.6 V is as high as 55% compared to that of Pt/IrO2/CP1, while that of Pd/IrO2/CP1 is just 6%. Figs. 5 and 6 show that changing the MORR to Pt-Ru and Pd leads to better WE performance and lower FC performance simultaneously.
The performances of the electrodes used in this study, Pd/IrO2/CP1 and Pt-Ru/IrO2/CP1, during WE and FC operations are summarized in Fig. 7. Those for Pt/IrO2/CP1 electrodes as a function of Pt loading (0.1-0.3 mg/cm2) and other particle-type electrodes are also included based on literature reports [7-16, 22]. The summary of WE performance in Fig. 7(a) shows that Pt-Ru/IrO2/CP1 yields the highest current density of the electrodes used in this study, despite a low catalyst loading of 0.4 mg/cm2. Though the Pt-Ru/IrO2/CP1 electrode does not remarkably improve the FC performance (Fig. 7(b)), its excellent OER activity might give better results in terms of overall efficiency. Meanwhile, Pd/IrO2/CP1 yields acceptable performance in the WE mode but very low performance in the FC mode.

Current density at (a) 1.7 V (WE mode) and (b) 0.6 V (FC mode) as a function of catalyst loading for various electrodes.
Overall cell efficiencies of Pt-Ru/IrO2/CP1 and Pd/IrO2/CP1 were assessed based on analyses of εRT at 0.2 and 0.4 A/cm2 (Fig. 8). The literature values, at a lower Pt loading (<0.4 mg/cm2), are also presented for comparison. Considering the trend reported previously [22], it could be expected that using Pt alone, with a loading of 0.15 mgPt/cm2, MORR might result in εRT of 0.47 at 0.2 A/cm2 and 0.38 at 0.4 A/cm2. However, for Pt-Ru/IrO2/CP1 (0.15 mgPt/cm2, 0.15 mgRu/cm2), the εRTs are 0.50 at 0.2 A/cm2 and 0.42 at 0.4 A/cm2, implying the positive effect of Ru on overall cell efficiency. At 0.2 A/cm2, the εRT of Pt-Ru/IrO2/CP1 is even 0.02 points (4%) higher than that of Pt/IrO2/CP1, with a Pt loading of 0.2 mgPt/cm2. Meanwhile, it is clear that Pd/IrO2/CP1 results in low εRT at all current densities because of its poor FC performance. In order to confirm the cost-effectiveness of electrodes, the εRT was plotted as a function of catalyst cost at the oxygen electrode (Fig. 8(b) and (d)). For this, the average prices of Pt, Pd, Ru, and Ir from 2005 to 2015 were obtained from the price table provided by Johnson Matthey Co. [30], while that of IrO2 was assumed to be equal to that of metallic Ir. In terms of cost-effectiveness, Pd/IrO2/CP1 was inferior to Pt/IrO2/CP1 and the electrodes from literature. On the other hand, since the added Ru was less costly than Pt (Pt: 1363 US$/oz., Ru: 175 US$/oz.), Pt-Ru/IrO2/CP1 still exhibited high cost-effectiveness at both 0.2 A/cm2 and 0.4 A/cm2. Based on these results, it is found that using Pt-Ru instead of Pt alone could be a cost-effective strategy to improving εRT.
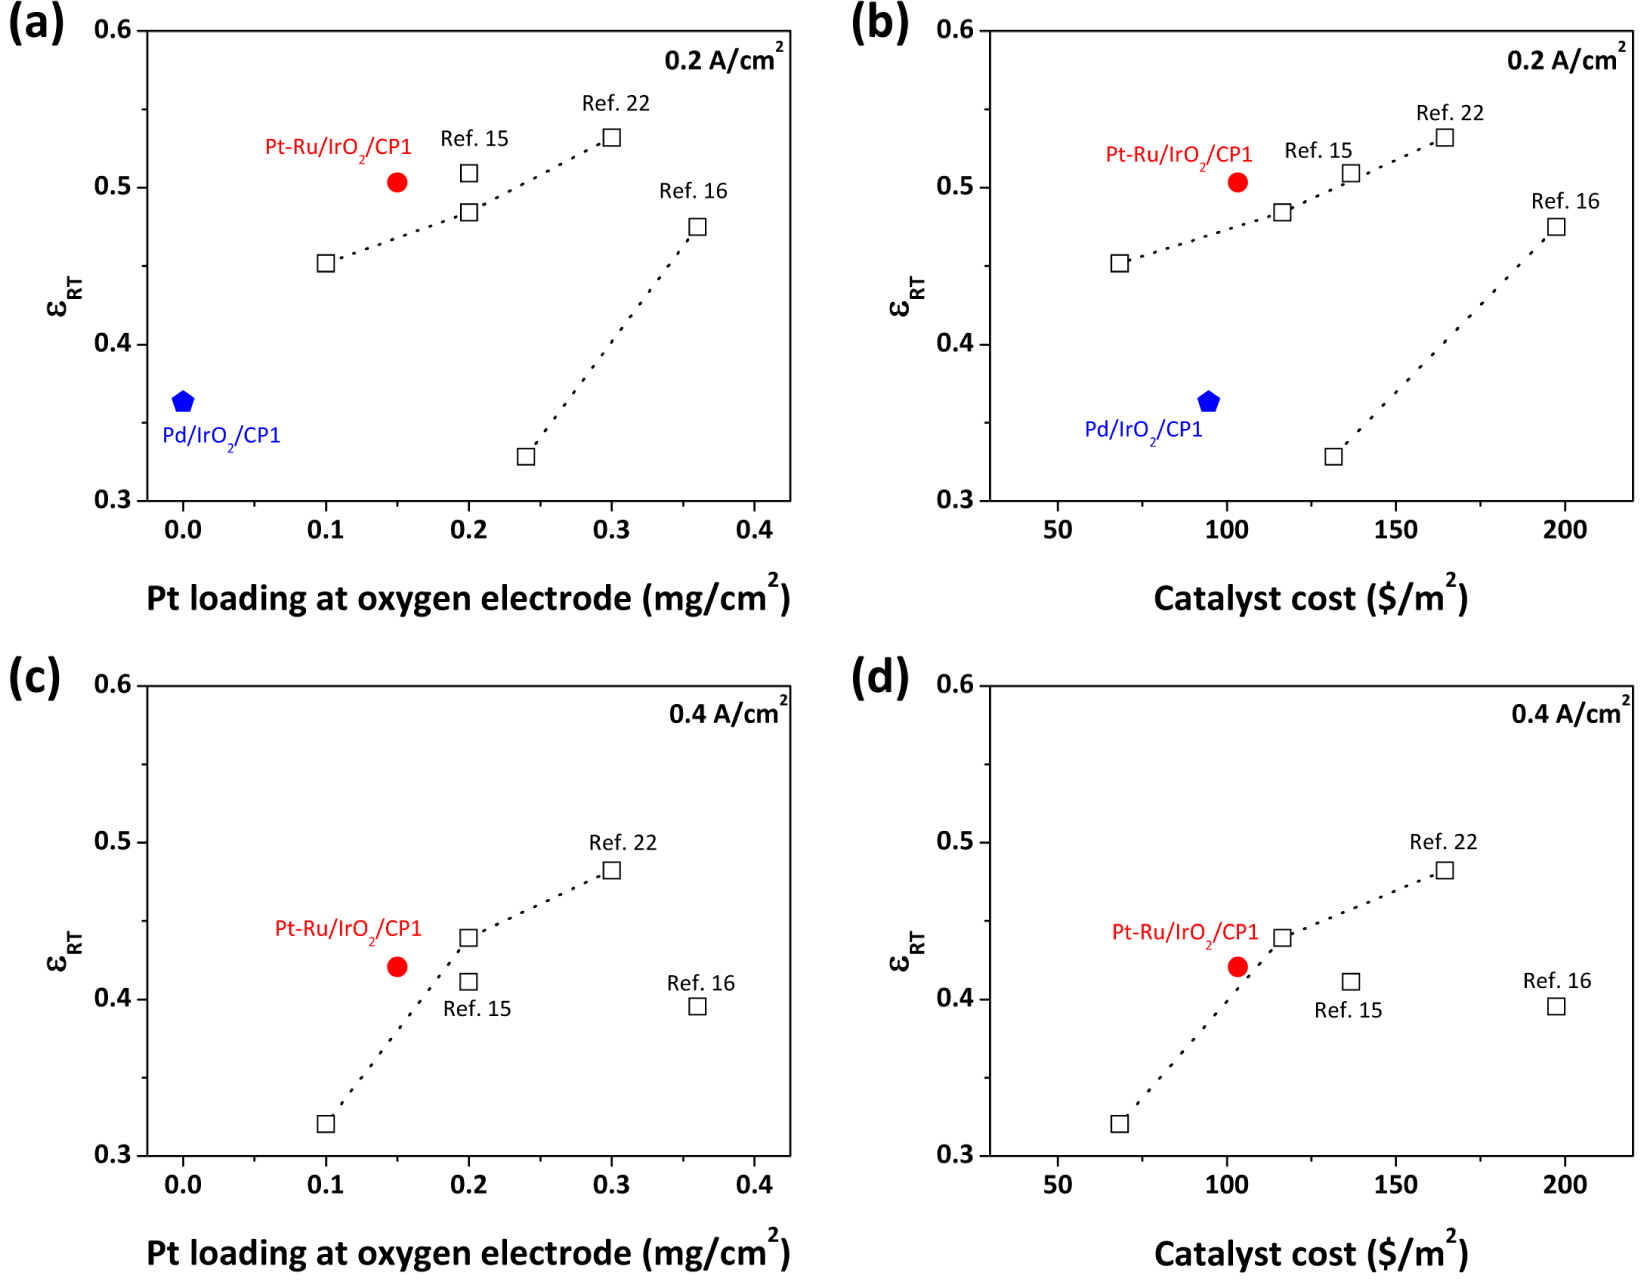
εRTs for various electrodes at (a, b) 0.2 A/cm2 and (c, d) 0.4 A/cm2 as functions of (a, c) Pt loading and (b, d) catalyst cost at the oxygen electrode. The price of IrO2 is assumed to be equal to that of Ir metal.
4. Conclusion
In this study, the effects of DL and MORR on the performance of MORR/IrO2/DL electrodes are discussed in detail. The roughness factor of DL mainly determines the electrode performance in both WE and FC modes, while the impacts of porosity and substrate material are relatively insignificant. This result indicates that the roughness factor should be primarily considered when designing DL of MORR/IrO2/DL electrodes. In addition, using Pt-Ru as the MORR instead of pure Pt is likely a promising solution to reduce Pt loading while improving εRT. This result reveals the applicability of the Pt-Ru/IrO2/CP1 electrode as an economical option for future URFC operations.
Acknowledgements
This work was supported by the Korean Government through the New & Renewable Energy Core Technology Program of the Korea Institute of Energy Technology Evaluation and Planning (KETEP) funded by MOTIE (No. 20133030011320 and No. 20143010031770). This study was also financially supported by KIST through the Institutional Project.