Electrochemical Performance of M2GeO4(M = Co, Fe and Ni) as Anode Materials with High Capacity for Lithium-Ion Batteries
Article information
Abstract
M2GeO4 (M = Co, Fe and Ni) was synthesized as an anode material for lithium-ion batteries and its electrochemical characteristics were investigated. The Fe2GeO4 electrode exhibited an initial discharge capacity of 1127.8 mAh g−1 and better capacity retention than Co2GeO4 and Ni2GeO4. A diffusion coefficient of lithium ion in the Fe2GeO4 electrode was measured to be 12.7 × 10⁻⁸ cm2 s−1, which was higher than those of the other two electrodes. The electrochemical performance of the Fe2GeO4 electrode was improved by coating carbon onto the surface of Fe2GeO4 particles. The carbon-coated Fe2GeO4 electrode delivered a high initial discharge capacity of 1144.9 mAh g−1 with good capacity retention. The enhanced cycling performance was mainly attributed to the carbon-coated layer that accommodates the volume change of the active materials and improves the electronic conductivity. Our results demonstrate that the carbon-coated Fe2GeO4 can be a promising anode material for achieving high energy density lithium-ion batteries.
1. Introduction
In the field of energy storage, many researchers have broadly investigated advanced electrode materials for rechargeable lithium-ion batteries (LIBs), which are widely used in portable electronic devices, electric vehicles and energy storage systems [1-5]. Graphite has been mainly used so far as an active anode material in commercialized LIBs. The available capacity of the graphite is about 360 mAh g−1, which is close to its theoretical capacity (372 mAh g−1). To improve the energy density of LIBs, identifying an alternative anode material with high capacity is mandatory [6,7].Recently, alloying/de-alloying and conversion-based materials have been actively investigated due to their high theoretical capacity compared to graphite [8,9]. For example, Si, Sn, Sb and Ge materials exhibit the alloying/de-alloying reaction (M + xLi+ + xe− ↔ LixM, M = Si, Sn, Sb and Ge) with high theoretical capacities of 4200, 994, 660 and 1600 mAh g−1, respectively [10-12]. However, these alloying/de-alloying materials undergo large volume change, which results in rapid capacity decline during cycling. On the other hand, the conversion-based anode materials, such as Co3O4, Fe3O4, Fe2O3, Mn2O3 and MoO3, could deliver relatively high reversible capacities ranging from 500 to 1000 mAh g−1 through their multiple oxidation states (MzOx + 2xLi+ + 2xe− ↔ zM + xLi2O, M = Co, Ni and Fe) [13-17]. Recently, the mixed-metal oxides such as Co2GeO4, Co2SnO4 and Co2SiO4 have been reported as the anode materials for high performance LIBs [18-21]. These mixed-metal oxides exhibited high capacity as well as good cycling stability. In this work, we synthesized various types of M2GeO4 (M = Co, Fe and Ni) materials and investigated their electrochemical performance. Here, germanium and metal elements (Co, Fe and Ni) are electrochemically active via conversion and the alloying/de-alloying reaction, respectively. To further enhance the cycling performance of Fe2GeO4 material, carbon coating was performed by using glucosamine as a carbon source. The carbon-coated Fe2GeO4 material (Fe2GeO4@C) exhibited high initial discharge capacity, good cycling stability and enhanced rate capability. The electrochemical characteristics of M2GeO4 and Fe2GeO4@C will be presented and discussed in detail.
2. Experimental
2.1 Synthesis of M2GeO4
For the synthesis of M2GeO4, CoCl2·6H2O, NiCl2·6H2O, FeCl2, GeO2 and NaOH were used as starting precursors. First, 6 mmol of metal chloride was dissolved in 20 mL of distilled water. Two mmol of GeO2 was dispersed in the 20 mL of H2O and 15 mmol of NaOH was added into the solution. Two solutions were mixed well through stirring and transferred into an autoclave kept at 180°C. After hydrothermal reaction for 24 h, the obtained powder was rinsed using water and ethanol. The powder was dried at 80°C for 12 h followed by calcination at 500°C for 3 h (Co2GeO4 and Fe2GeO4) and 800°C for 3 h (Ni2GeO4). Carbon coating of pristine Fe2GeO4 was performed using the hydrothermal method. A proper amount of glucosamine (0.8 g) was dissolved in 60 mL of distilled water, and then 0.4 g of Fe2GeO4 was dispersed in the solution using sonication for 30 min. The solution was transferred to an autoclave kept at 140°C and maintained at that temperature for 12 h. The obtained powder was dried at 80°C for 12 h, and then calcinated at 500°C for 2 h in argon atmosphere to obtain the carbon-coated Fe2GeO4 particles.
2.2 Electrode preparation and cell assembly
The electrode slurry was prepared by mixing 70 wt.% active material (M2GeO4) with 20 wt.% Ketjen black and 10 wt.% carboxymethyl cellulose (CMC) binder in water. The M2GeO4 electrode was prepared by coating the viscous slurry onto the Cu foil using a doctor blade and drying in a vacuum oven at 80°C for 12 h. The active mass loading in the electrode was about 1.0 mg cm−2. To evaluate the electrochemical performance of the M2GeO4 electrode, a CR2032-type coin cell was assembled by sandwiching a polyethylene separator (ND420, thickness: 20 μm, Asahi Kasei E-materials) between the lithium electrode and the M2GeO4 electrode. The lithium electrode consisted of a 200 μm-thick lithium foil (Honjo Metal Co. Ltd.) pressed onto a copper current collector. The cell was then injected with an electrolyte solution consisting of 1.15 M LiPF6 in ethylene carbonate (EC)/ethylmethyl carbonate (EMC)/diethyl carbonate (DEC) (3/5/2 by volume) containing 5 wt.% fluoroethylene carbonate (FEC) (battery grade, PANAX ETEC Co. Ltd.). All cells were assembled in a glove box under argon atmosphere.
2.3 Characterization and measurements
X-ray diffraction (XRD) patterns of the M2GeO4 particles were recorded on a Rigaku Mini Flex X-ray diffractometer (XRD) using Cu-Kα radiation. The morphological features of the synthesized M2GeO4 particles were examined using a scanning electron microscope (FE-SEM, JEOL JSM-6300) and transmission electron microscope (TEM, JEOL, JEM 2100F). Thermogravimetric analysis (TGA) was performed using a TGA analyzer (SDT Q600, TA Instrument) in the temperature range from 30 to 800°C at a heating rate of 5°C min−1. Raman spectrum of the carbon-coated Fe2GeO4 particles was obtained using NRS-3100 Laser Raman spectrometer with 532-nm excitation. The electronic conductivity of the pristine and carbon-coated Fe2GeO4 materials was measured using the CMT-100s four-point probe instrument. Cyclic voltammetry (CV) was carried out in the potential range of 0.01 to 3.0 V with counter and reference electrodes of lithium metal, at various scan rates (0.1 to 1.0 mV s−1) using the CHI660D electrochemical workstation. Charge and discharge cycling tests were conducted at a constant current density over the voltage range of 0.01 to 3.0 V using a battery testing equipment (WBCS 3000, Wonatech) at room temperature. The specific capacity was calculated based on the mass of the active materials (M2GeO4) in the electrode.
3. Results and Discussion
Metal germanates were synthesized by the facile hydrothermal method. Fig. 1 shows the XRD patterns of the synthesized M2GeO4 particles. The XRD pattern of Co2GeO4 in Fig. 1(a) shows the crystalline peaks at 30.7, 36.1, 43.6, 58.2 and 63.8°, which correspond to (220), (311), (400), (511) and (440) lattice planes, respectively. All the crystalline peaks are consistent with the standard pattern (JCPDS-73-0237), indicating pure phase formation of Co2GeO4. The XRD patterns shown in Fig. 1(b) and (c) also matched well with the cubic spinel crystal structure of Fe2GeO4 (JCPDS-25-0359) and Ni2GeO4 (JCPDS-80-1673), respectively. The Ni2GeO4 particles exhibited sharp peaks compared to other M2GeO4 materials due to phase formation at a higher temperature.
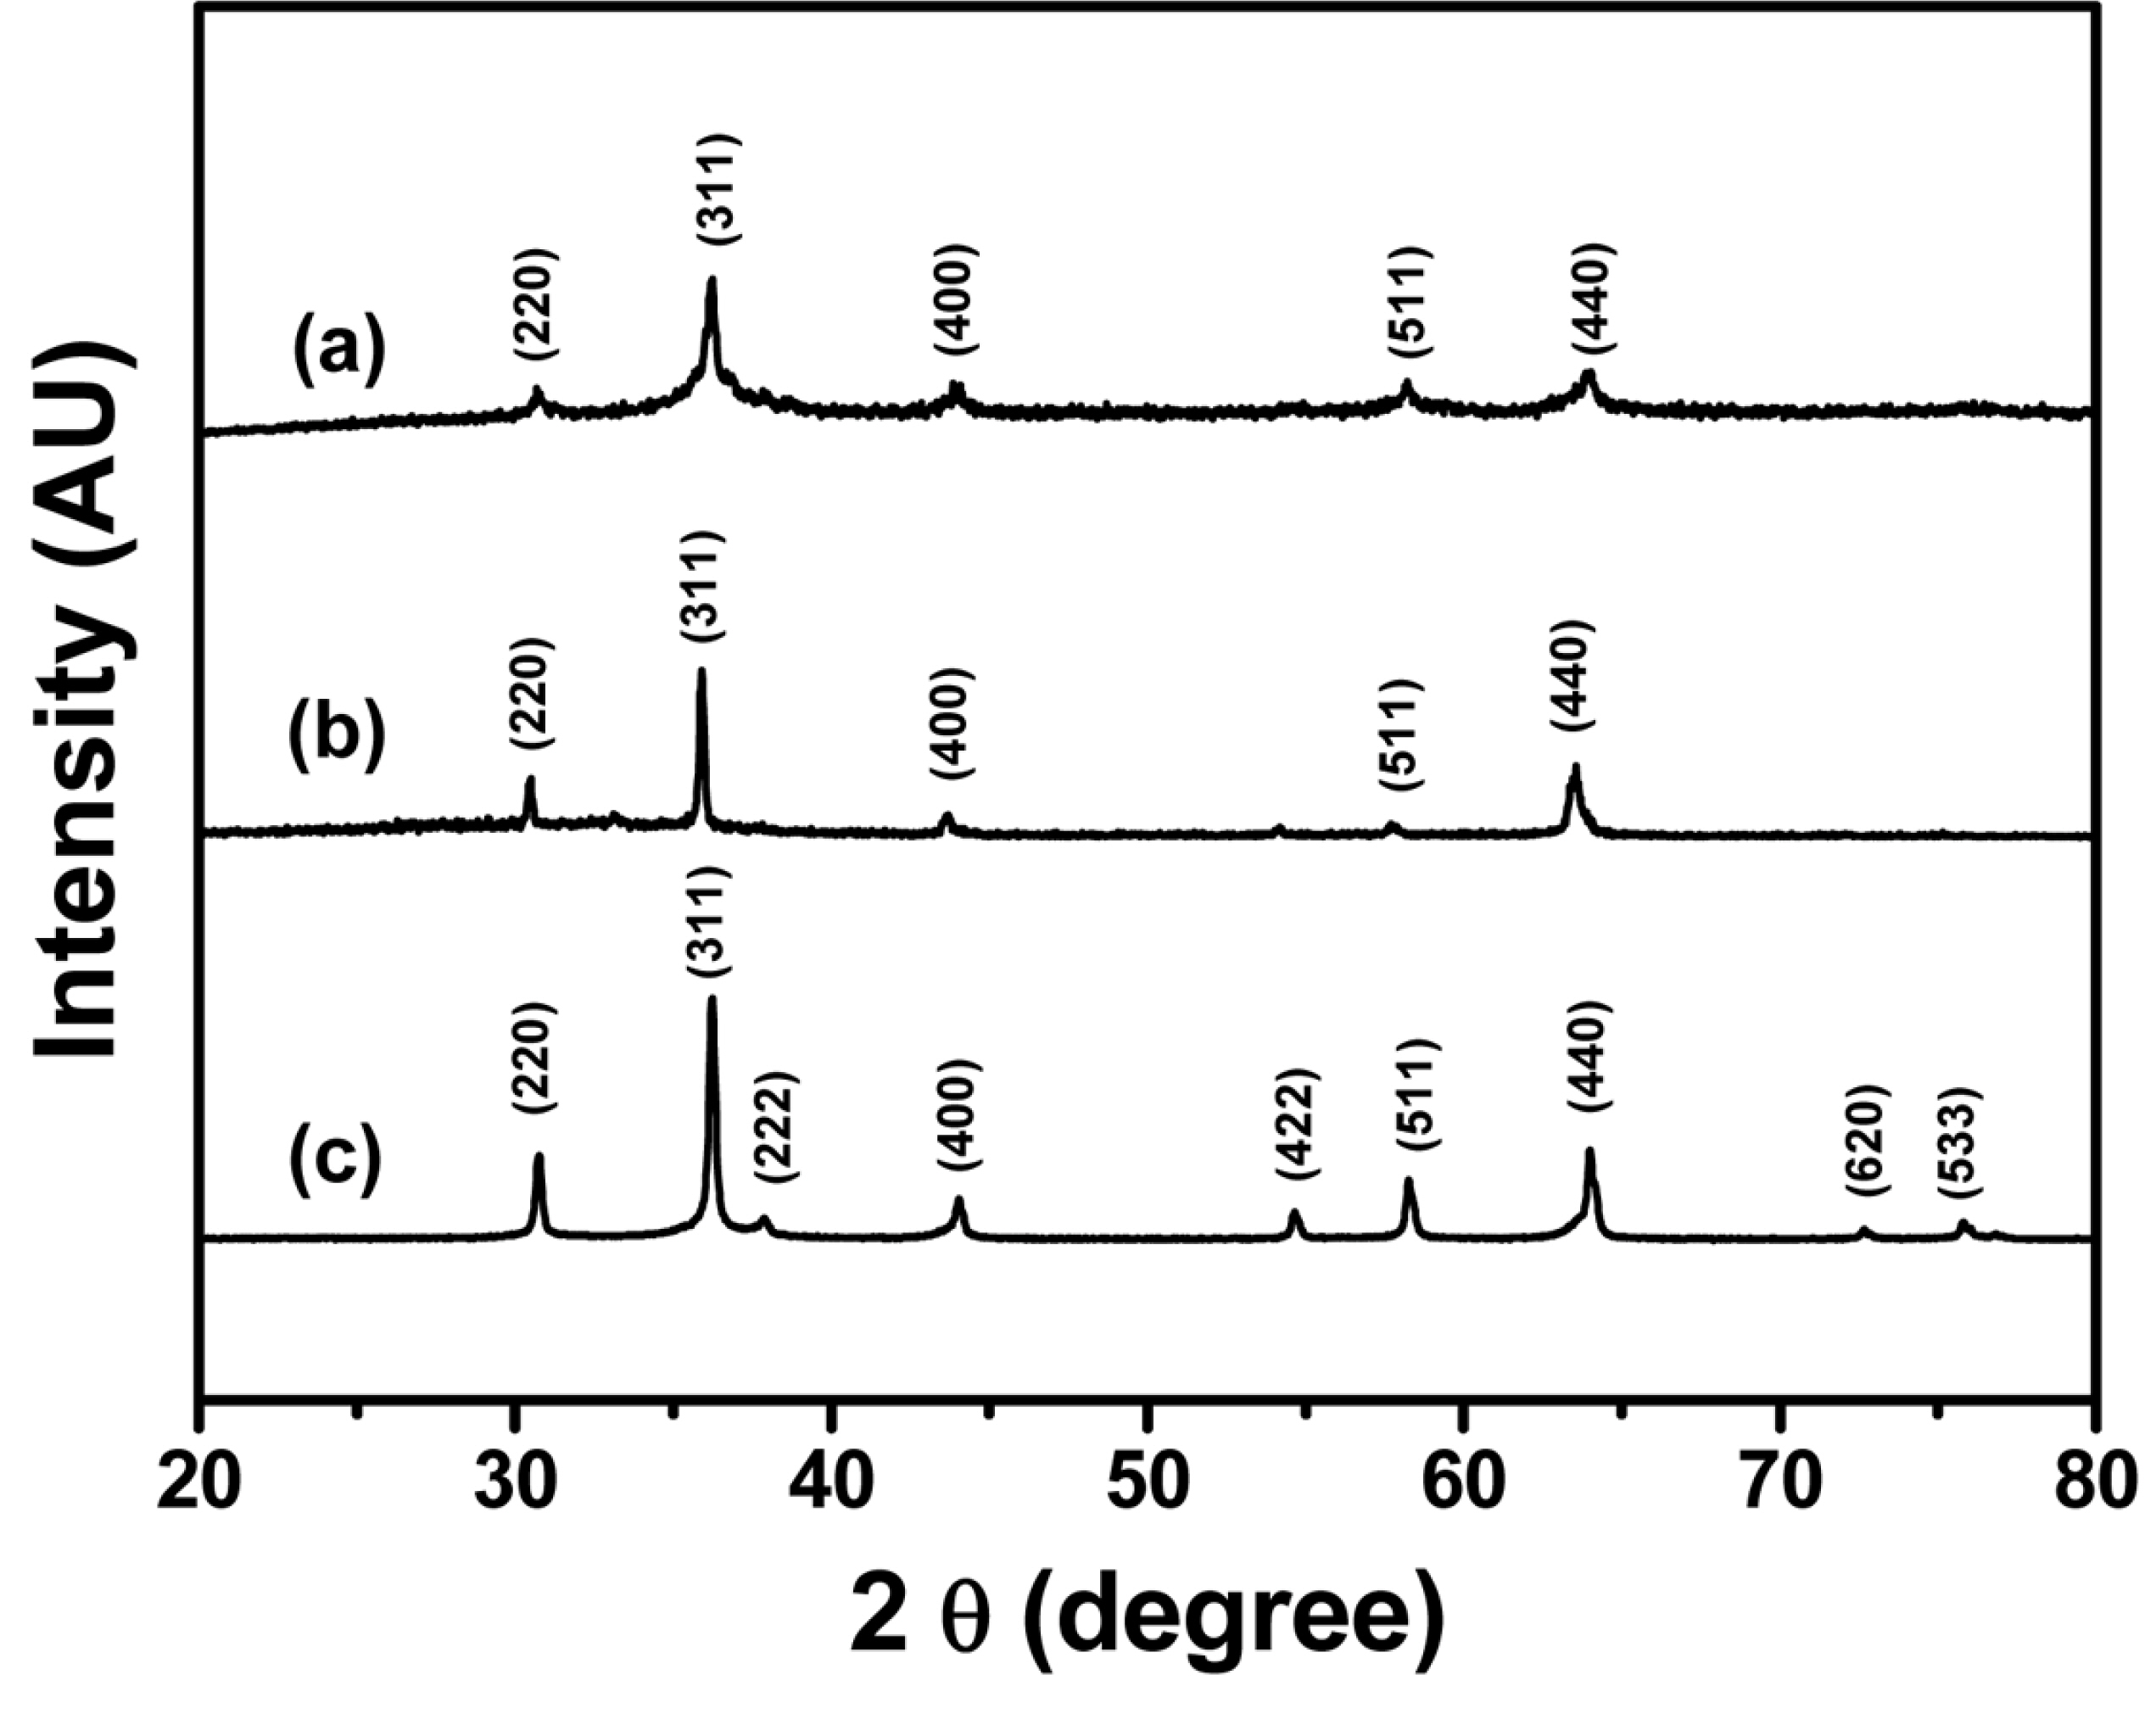
XRD patterns of (a) Co2GeO4, (b) Fe2GeO4, and (c) Ni2GeO4 particles.
Fig. 2 shows the FE-SEM images of M2GeO4 particles. The Co2GeO4 particles shown in Fig. 2(a) exhibit a triangular cube shape of 0.8 to 1.2 µm in size. The triangular cube-shape particles were formed during an Ostwald ripening process, which implies that dissolution and re-crystallization occurred at a high temperature during the hydrothermal process [22,23]. The Fe2GeO4 particles shown in Fig. 2(b) have a uniform cube shape with an average particle size of 500 nm. The Ni2GeO4 particles show a uniform spherical shape with a particle size of less than 200 nm without any agglomeration.

FE-SEM images of (a) Co2GeO4, (b) Fe2GeO4, and (c) Ni2GeO4 particles.
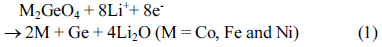
Cyclic voltammetry of the M2GeO4 electrodes was performed in the potential range of 0.01-3.0 V versus Li/Li+ at a scan rate of 0.1 mV s−1, and the resulting cyclic voltammograms are shown in Fig. 3. The Co2GeO4 electrode shows two reduction peaks at 0.78 and 0.37 V in the first cycle, which can be assigned to the disintegration of Co2GeO4 crystal structure into its individual components such as Co, Ge, and the formation of Li2O, as given in equation (1) and the electrolyte decomposition [24,25]. The reduction peak at 0.02 V was associated with the alloying reaction of lithium with Ge to form the Li4.4Ge phase, as presented in equation (2) [26]. The small and broad oxidation peaks at 0.52 and 1.38 V during anodic scan could be attributed to the dealloying reaction of Li4.4Ge into Ge followed by the formation of GeO2 [24]. The broad peak at a higher potential between 1.80 and 2.50 V elucidates the multiple oxidation reaction of Co0 to Co2+ and Co2+ to Co3+ [27]. After the first cycle, the reversible reactions take place according to the electrochemical reactions given in equation (2) to (4). The redox peaks observed at 0.02/0.52, 0.82/1.38 and 1.26-1.53/1.97-2.22 V correspond to the alloying/de-alloying reaction of Ge, and the conversion reaction of GeO2 and cobalt oxide, respectively [24]. In Fig. 3(b) and (c), the cyclic voltammograms of Fe2GeO4 and Ni2GeO4 exhibited a reduction peak at 0.61 V and 0.35 V, which can be ascribed to the reduction of Fe2GeO4 and Ni2GeO4 according to electrochemical reaction (1). After the first cycle, they showed similar oxidation and reduction peaks as in Co2GeO4. Among the three materials, Fe2GeO4 showed the highest oxidation and reduction peaks, indicating its high reversible capacity during the electrochemical reaction.
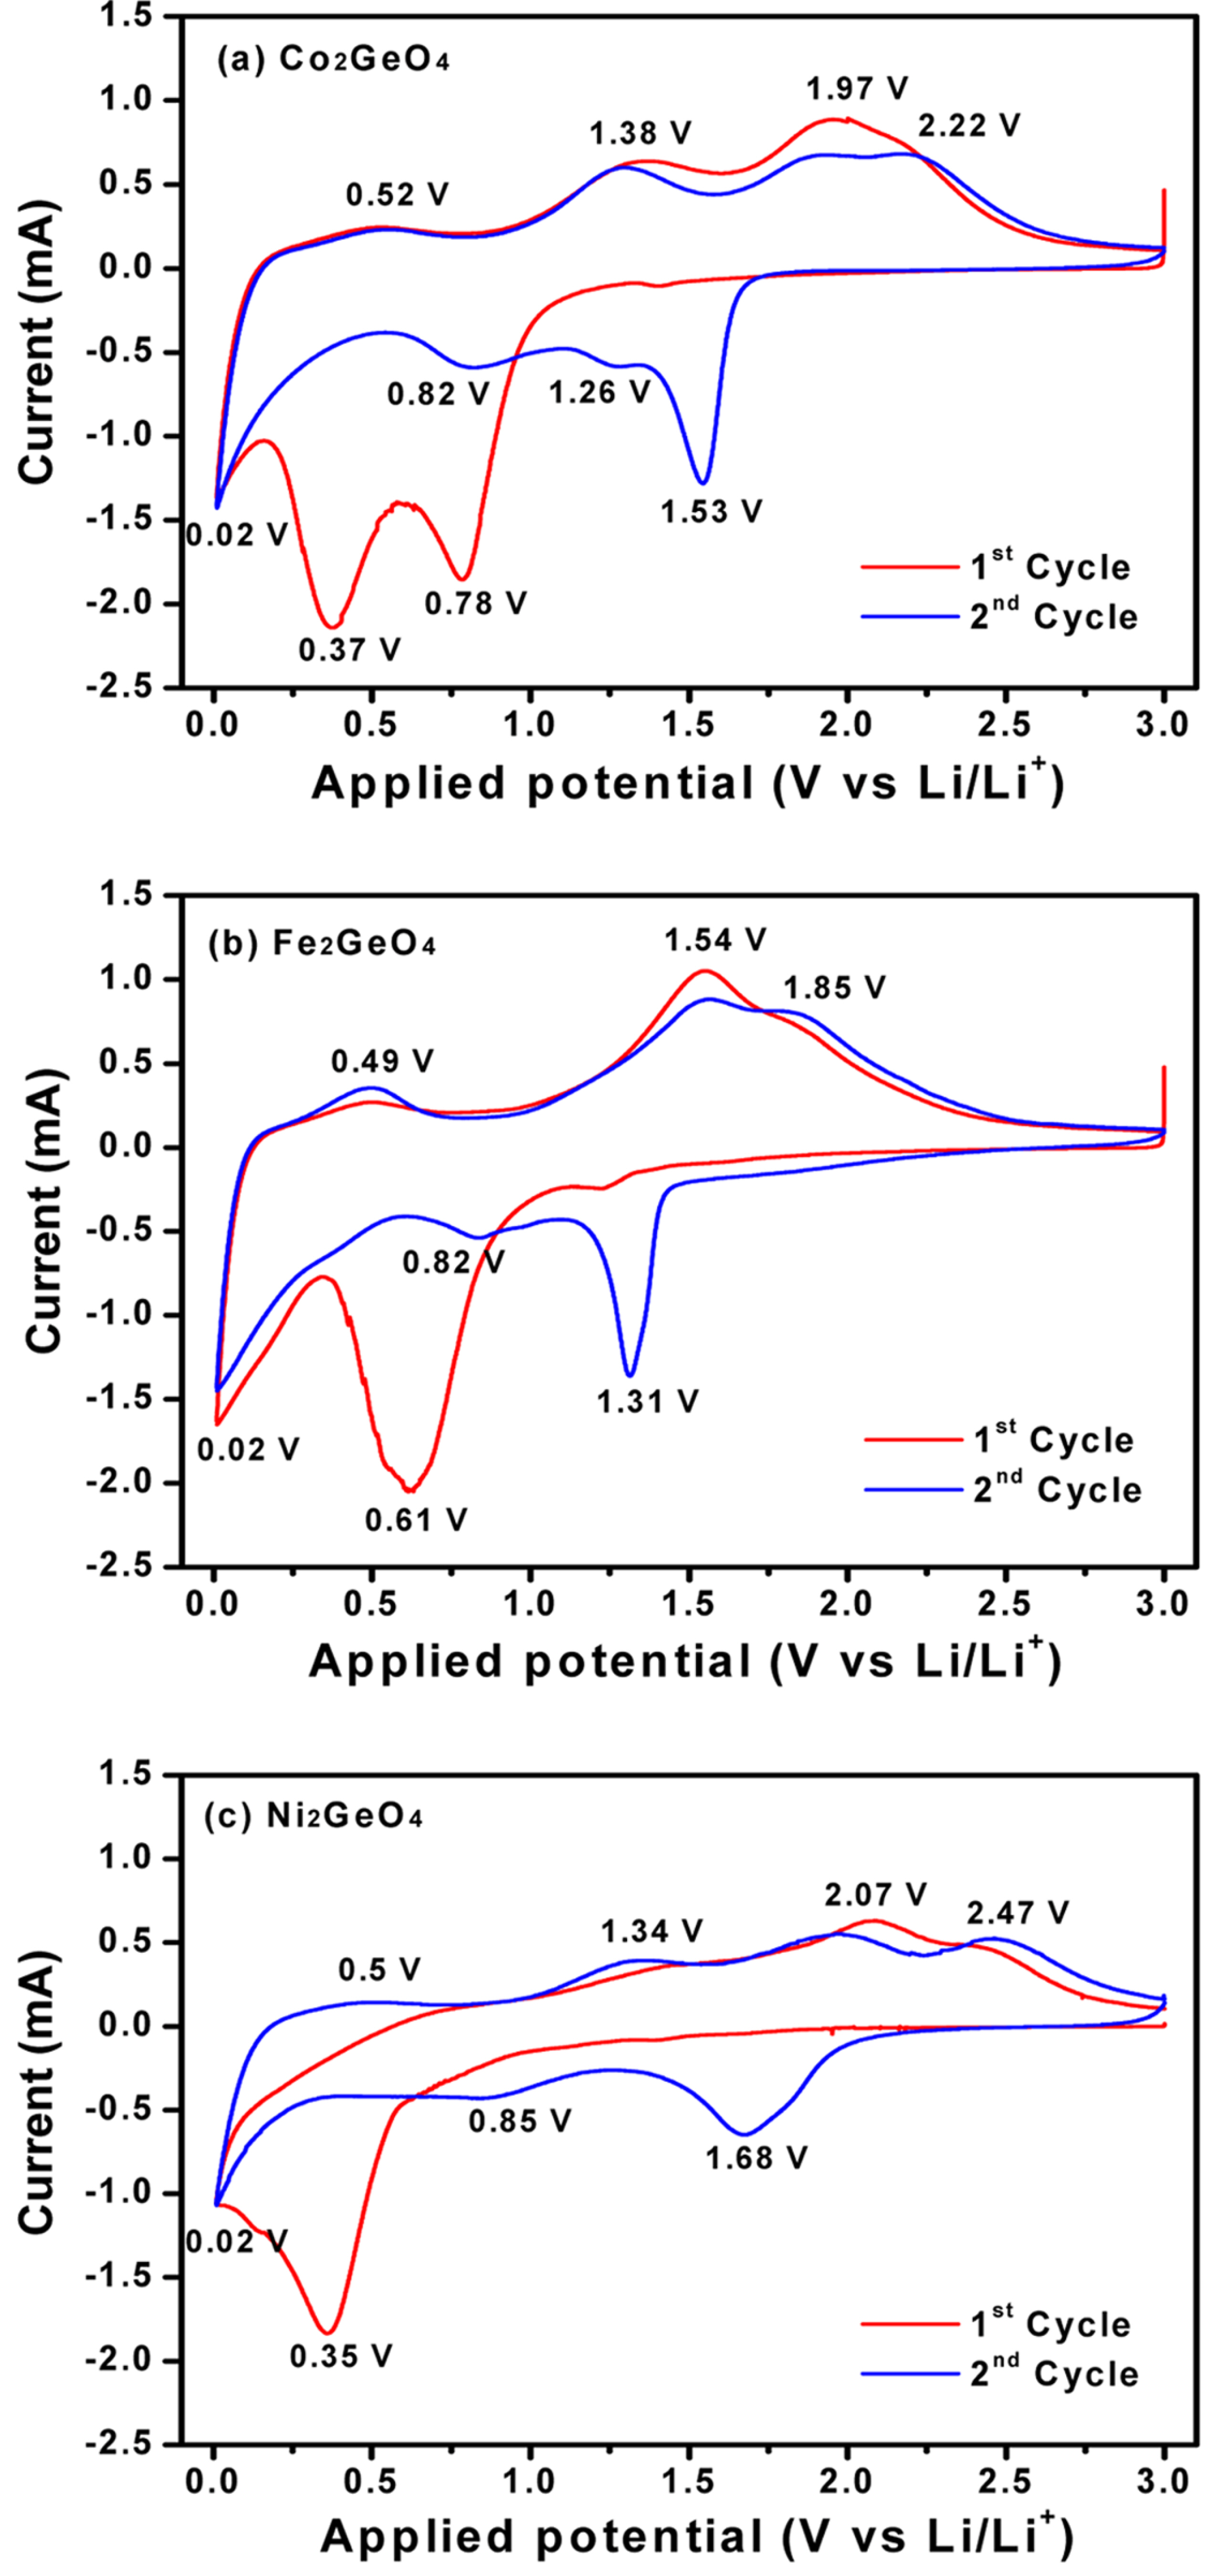
Cyclic voltammograms of (a) Co2GeO4, (b) Fe2GeO4, and (c) Ni2GeO4 electrodes at a scan rate of 0.1 mV s−1.


Cyclic voltammograms of M2GeO4 electrodes were obtained at different scan rates from 0.1 to 1.0 mV s−1, as given in Fig. 4. The oxidation and reduction peaks for all the electrodes were found to be shifted to higher (oxidation) and lower (reduction) potentials due to the increase in electrode polarization [27]. Fig. 4(d) shows the peak current versus the square root of scan rate, which demonstrates the linear relationship between them, indicating the charge storage mechanism pertaining to diffusion controlled process [28,29]. The diffusion coefficient of Li+ ions in the electrode can be calculated from the slope of the line given in Fig. 4(d) using the Randles-Servick equation,

Cyclic voltammograms of (a) Co2GeO4, (b) Fe2GeO4 and (c) Ni2GeO4 electrodes at different scan rates, and (d) peak current versus square root of scan rate.

where ip is the anodic peak current (mA), n is the charge transfer number (n = 1), A is the electrode area (1.53 cm2), DLi+ is the diffusion coefficient of Li+ ion, C is the concentration of electrolyte (1 M) and v is the scan rate (mV s−1). The calculated diffusion coefficients of Co2GeO4, Fe2GeO4 and Ni2GeO4 are 6.3×10⁻⁸, 12.7×10⁻⁸ and 3.6×10⁻⁸ cm2 s−1, respectively. The Fe2GeO4 electrode has the highest diffusion coefficient, which implies the fastest lithium-ion diffusion in the Fe2GeO4 electrode.
Fig. 5(a)-(c) show the charge and discharge curves of M2GeO4 electrodes at a constant current density of 100 mA g−1. In the first cycle, the discharge capacities of Co2GeO4, Fe2GeO4 and Ni2GeO4 are 1046.6, 1127.8 and 1067.2 mAh g−1 with Coulombic efficiencies of 72.9, 76.3 and 74.1%, respectively. The low Coulombic efficiency in the first cycle is related to the decomposition of electrolyte to form a solid electrolyte interphase (SEI) layer on the electrode surface. The Coulombic efficiency was steadily increased and reached 99.2% at the 50th cycle. Fig. 5(d) shows the discharge capacities of the M2GeO4 electrodes as a function of cycle number at a constant current density of 100 mA g−1. The discharge capacities of the M2GeO4 electrodes decreased gradually with cycling, which results from the large volume change during the alloying/de-alloying and conversion reaction, which can lead to cracks on the electrode as well as the peeling of the electrode material from the current collector. Among the M2GeO4 electrodes investigated, the Fe2GeO4 electrode exhibited the best cycling stability. The Fe2GeO4 electrode showed a discharge capacity of 740.3 mAh g−1 at the 50th cycle, which corresponds to 65.6% of its initial discharge capacity.

Charge and discharge curves of (a) Co2GeO4, (b) Fe2GeO4 and (c) Ni2GeO4 electrodes at a current density of 100 mA g−1, and (d) discharge capacities of M2GeO4 (M = Co, Fe and Ni) electrodes as a function of cycle number.
To improve the electrochemical performance of the Fe2GeO4 particles, they were coated with carbon using glucosamine as a carbon source through the hydrothermal method. The TGA results depicted in Fig. 6(a) reveals that 5.2 wt.% of carbon is coated on the surface of pristine Fe2GeO4 particles. Fig. 6(b) presents the Raman spectrum of the carbon-coated Fe2GeO4 particles. It clearly shows two characteristic peaks at 1318 and 1589 cm−1, which can be ascribed to the sp3-hybridized disorder carbon (D-band) and the sp2-hybridized ordered graphitic carbon (G-band), respectively [30]. The calculated ID/IG ratio is about 1.14, indicating the presence of amorphous carbon on the surface of Fe2GeO4. Fig. 6(c) shows the TEM image of the carbon-coated Fe2GeO4 particle, which reveals that Fe2GeO4 is non-uniformly coated by the carbon layer with a thickness of 2.0 to 8.0 nm. The flexible nature of the amorphous carbon layer on the Fe2GeO4 particle is expected to act as an efficient buffer in volume changes during the repeated cycling. The electronic conductivity of the Fe2GeO4@C measured using the four-point probe method was 1.30×10⁻⁵ S cm−1, which is much higher than that of pristine Fe2GeO4 (1.49×10⁻⁸ S cm−1). The higher electronic conductivity of Fe2GeO4@C is expected to enhance the rate capability of the electrode material.

(a) TGA thermogram, (b) Raman spectrum, and (c) HRTEM image of Fe2GeO4@C particle.
The cycling performance of the Fe2GeO4@C electrode was evaluated at a constant current density of 100 mA g−1, with the results shown in Fig. 7(a). In the first cycle, the Fe2GeO4@C electrode delivered a high discharge capacity of 1144.9 mAh g−1 with a Coulombic efficiency of 79.8%. The Coulombic efficiency increased steadily with cycling and reached around 99.6% at the 100th cycle. The Fe2GeO4@C electrode exhibited a discharge capacity of 904.2 mAh g−1 with a capacity retention of 79.0% at the 100th cycle. Clearly, the Fe2GeO4@C electrode showed better electrochemical performance than the pristine Fe2GeO4 electrode, because the carbon coating of Fe2GeO4 can provide many advantages such as, (i) it forms the protective layer that suppresses the irreversible reaction between the Fe2GeO4 electrode and the liquid electrolyte, (ii) the flexible nature of amorphous carbon mitigates the mechanical stress due to the volume change during charge and discharge cycles, and (iii) the carbon coating enhances the electron transport in the electrode. The rate capabilities of pristine and carbon coated-Fe2GeO4 electrodes were evaluated at different current densities. The electrodes were charged to 0.01 V at a constant current density of 100 mA g−1, and then discharged to 3.0 V at different current rates. The discharge capacities of the Fe2GeO4 and Fe2GeO4@C electrodes at current densities increasing from 100 to 1600 mA g−1 every five cycles are shown in Fig. 7(b). The effect of carbon coating on the rate performance of the Fe2GeO4 electrode was noticeable as the current density was increased. At 1600 mA g−1, the Fe2GeO4@C electrode delivered a discharge capacity of 581.3 mAh g−1, corresponding to 50.7% of the initial discharge capacity at 100 mA g−1. The carbon layer could provide a continuous electronic pathway between the Fe2GeO4 particles, which resulted in rate capability improvement. The Fe2GeO4@C electrode also retained high reversible capacity when current density was returned to 100 mA g−1, which assured good cycling stability of the Fe2GeO4@C electrode material.

(a) Discharge capacity and Coulombic efficiency of Fe2GeO4@C electrode at 100 mA g−1, and (b) discharge capacities of pristine Fe2GeO4 and Fe2GeO4@C electrodes as a function of current rate. Current rate was increased from 100 to 1600 mA g−1 after every five cycles.
4. Conclusions
We successfully synthesized M2GeO4 (M = Co, Fe and Ni) particles by the hydrothermal method and their electrochemical characteristics were investigated. Among the three types of electrodes, the Fe2GeO4 electrode exhibited the highest reversible capacity of 1127.8 mAh g−1. Its cycling stability and rate capability were improved by carbon coating. The carbon-coated Fe2GeO4 electrode delivered a high initial discharge capacity of 1144.9 mAh g−1 with a capacity retention of 79.8% after 100 cycles. It also retained a relatively high discharge capacity of 581.3 mAh g−1 at a high current density of 1600 mA g−1, which was superior to that of the pristine Fe2GeO4 electrode. These results indicate that the carboncoated Fe2GeO4 is expected to be a promising anode material for improving the energy density of lithium-ion batteries.
Acknowledgements
This work was supported by the research fund of Hanyang University (HY-2017) and the Basic Science Research Program of the National Research Foundation of Korea (NRF), funded by the Ministry of Science, ICT, and Future Planning (2016R1A4A1012224).