1. Introduction
In order to achieve the 1.5°C target of global warming along with net zero emissions, the utilization of hydrogen as a renewable energy carrier is essential [1]. Green hydrogen produced via water electrolysis powered by renewable energy sources is considered as a key component of hydrogen economy. To realize the industrial utilization of green hydrogen, it is essential to develop an energy-efficient and highly durable water electrolysis system [2,3]. Among the various types of water electrolysis, proton exchange membrane water electrolysis (PEMWE) is one of the most promising technologies because of its high current density, rapid response of system, and compact design of the system [4–7]. The renewable energy sources, such as solar and wind energy exhibit unpredictable and variable patterns of power fluctuations because of diverse weather and climate conditions. Especially, wind exhibits a highly irregular fluctuations in its speed, regardless of the time of the day [8], while solar radiance typically exhibits diurnal and seasonal patterns with periods of decrease during the rainy seasons [9]. Several studies have reported that fluctuating power can deteriorate the stability of PEMWE [8–27] in assoication with the catalyst dissolution [8–10,11,13,14,17–22], membrane thinning [10,12,18], and the passivation of porous transport layer [13,18,19], addressed through various in-situ cell diagnostics such as cyclic voltammetry and impedance analyses, and post-mortem analyses on the cell components using electron microscopy and X-ray spectroscopy. Recent developments on operando method such as synchrotron radiography [28], X-ray computed tomography [29] provided more clear understanding on degradation phenomena. Although the fluctuating power characteristics of renewable energy sources can be compensated by using energy storage systems, such as batteries and capacitors, the direct use of renewable energy sources in PEMWE would be more desirable for minimizing the total cost of a water electrolysis system [30].
The wind power, which is more irregular and fluctuating than the solar power, caused greater performance losses in the electrolyzer [9]. Accordingly, there have been several reports to study the effect of the wind power fluctuation on PEMWE [8,15,17], while similar studies were also carried out for solar power cases [11,12]. Irregularity of input power source sometimes makes it hard to address the degradation factor. As a simplified strategy to simulate wind power, triangle patterns of the voltage were applied in the evaluation of the PEMWE’s stability [8,9,17,18,20].
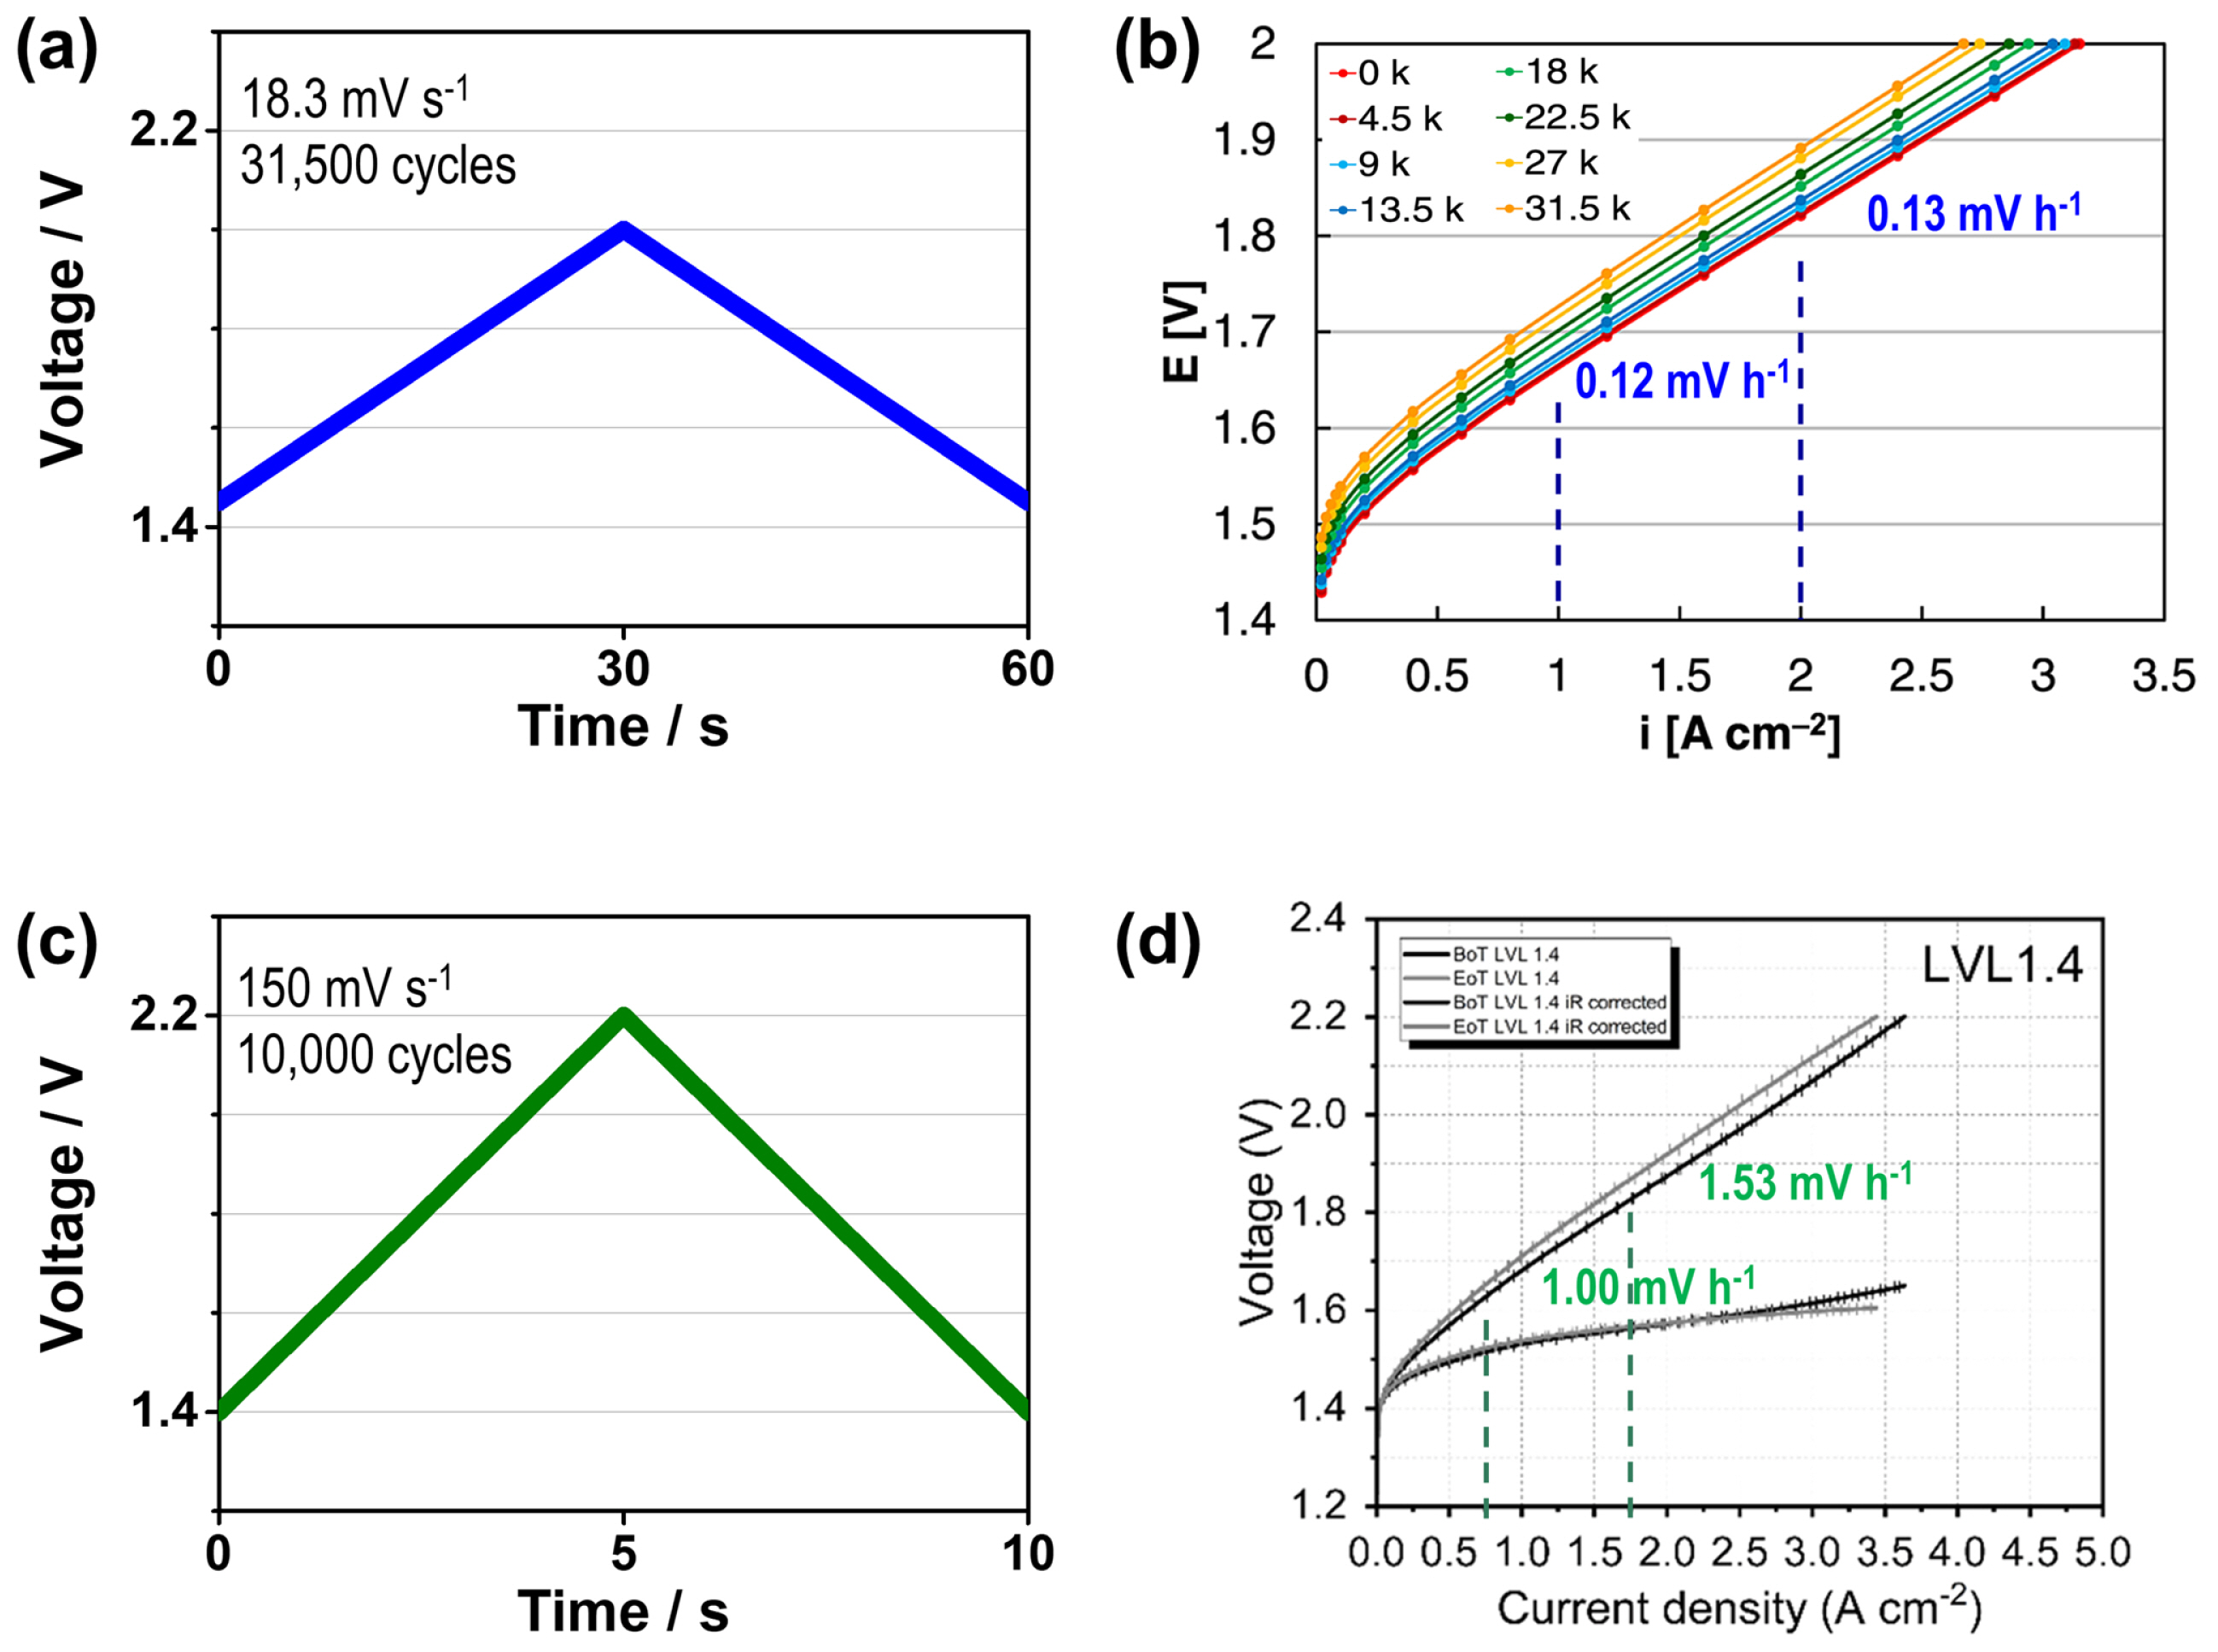
A few studies have investigated the effect of triangular voltage cycling on the performance of PEMWE cells [8,17,18,20], and Fig. 1 shows the triangular voltage profiles and the relevant polarization curves reported in previous studies [17,18]. These studies focused on the effect of the voltage limits of triangular voltage cycling on the cell performance of PEMWE. Voronova et al. [18] investigated the impact of the lower voltage limit (LVL) on cell performance and found out that a low LVL (1.4 V) generates a reversal current, which degrades the cathode catalyst and subsequently deteriorates the cell performance (Fig. 1c,d). In contrast, the performance deterioration at a high LVL (1.9 V) was associated with an increase in the mass transport loss. Honsho et al. [8] examined the effects of the upper voltage limit (UVL) of triangular voltage cycling on cell performance. They reported that an increase in the UVL from 2.0 V to 2.3 V causes the enhanced partial dissolution of IrO2, followed by its transition into a dense structure and the decrease in the rate of the oxygen evolution reaction.
Meanwhile, voltage ramping rate is also an important variable for the triangular voltage cycling, but its effect on the durability of PEMWE has not yet been studied intensively. It is noticeable that the voltage fluctuation of wind power has various time periods for voltage change, ranging from tens to hundreds of mV s−1 in terms of ramping rate [8]. Therefore, it is necessary to investigate the effect of ramping rate on the degradation of PEMWE. As the dynamic operation with the voltage cycling of PEMWE accelerates its performance degradation, it is expected that an increase in the ramping rate leads to a more severe degradation of the PEMWE. Alia et al. [17] employed a ramping rate of 18.3 mV s−1 and reported the degradation rates of 0.12 and 0.13 mV h−1 at 1 and 2 A cm−2, respectively. In contrast, Voronova et al. [18] reported the degradation rates of 1.00 and 1.53 mV h−1 (at 1 and 2 A cm−2, respectively) at the ramping rate of 150 mV s−1. However, these degradation rates cannot be directly compared because they were obtained using different experimental conditions (catalyst, membrane, PTL, etc.). In this study, we investigated the effect of ramping rate on the durability of PEMWE performance during triangular voltage cycling. Prior to investigate the effect of the ramping rate on each component of PEMWE cell, we evaluated the change in overall cell performance after the dynamic operations at the ramping rate of 30 and 300 mV s−1 and investigated the difference in the degradation rate according to the ramping rate. In addition, the catalyst layer was analyzed using scanning electron microscopy (SEM), transmission electron microscopy (TEM), and X-ray photoelectron spectroscopy (XPS) to understand the degradation behavior.
2. Experimental
Fig. 2 shows the schematic of a PEMWE single cell, its configuration, and its constituents. The single cell comprised seven components: (1) a Ti bipolar plate bearing a flow field, (2) a Ti felt as a PTL, (3) an Ir black nanoparticle anode catalyst layer, (4) an N212 membrane, (5) a Pt/C cathode catalyst layer, (6) a gas diffusion layer (GDL) composed of carbon paper, and (7) a graphite bipolar plate bearing a flow field. The membrane electrode assembly (MEA) was purchased from WESPE (Seoul, South Korea). The amount of Ir black (10 wt.% ionomer content) loaded on the bare Ti felt was 2.0 mg cm−2. The amount of Pt/C (33 wt.% ionomer content) coated on the bare carbon paper was 0.4 mg cm−2. All MEAs had a 50 μm-thick N212 membrane. The MEAs were clamped in a 4 cm2 cell with a Ti anode flow field and a graphite cathode flow field using a force of 70 In·lb.
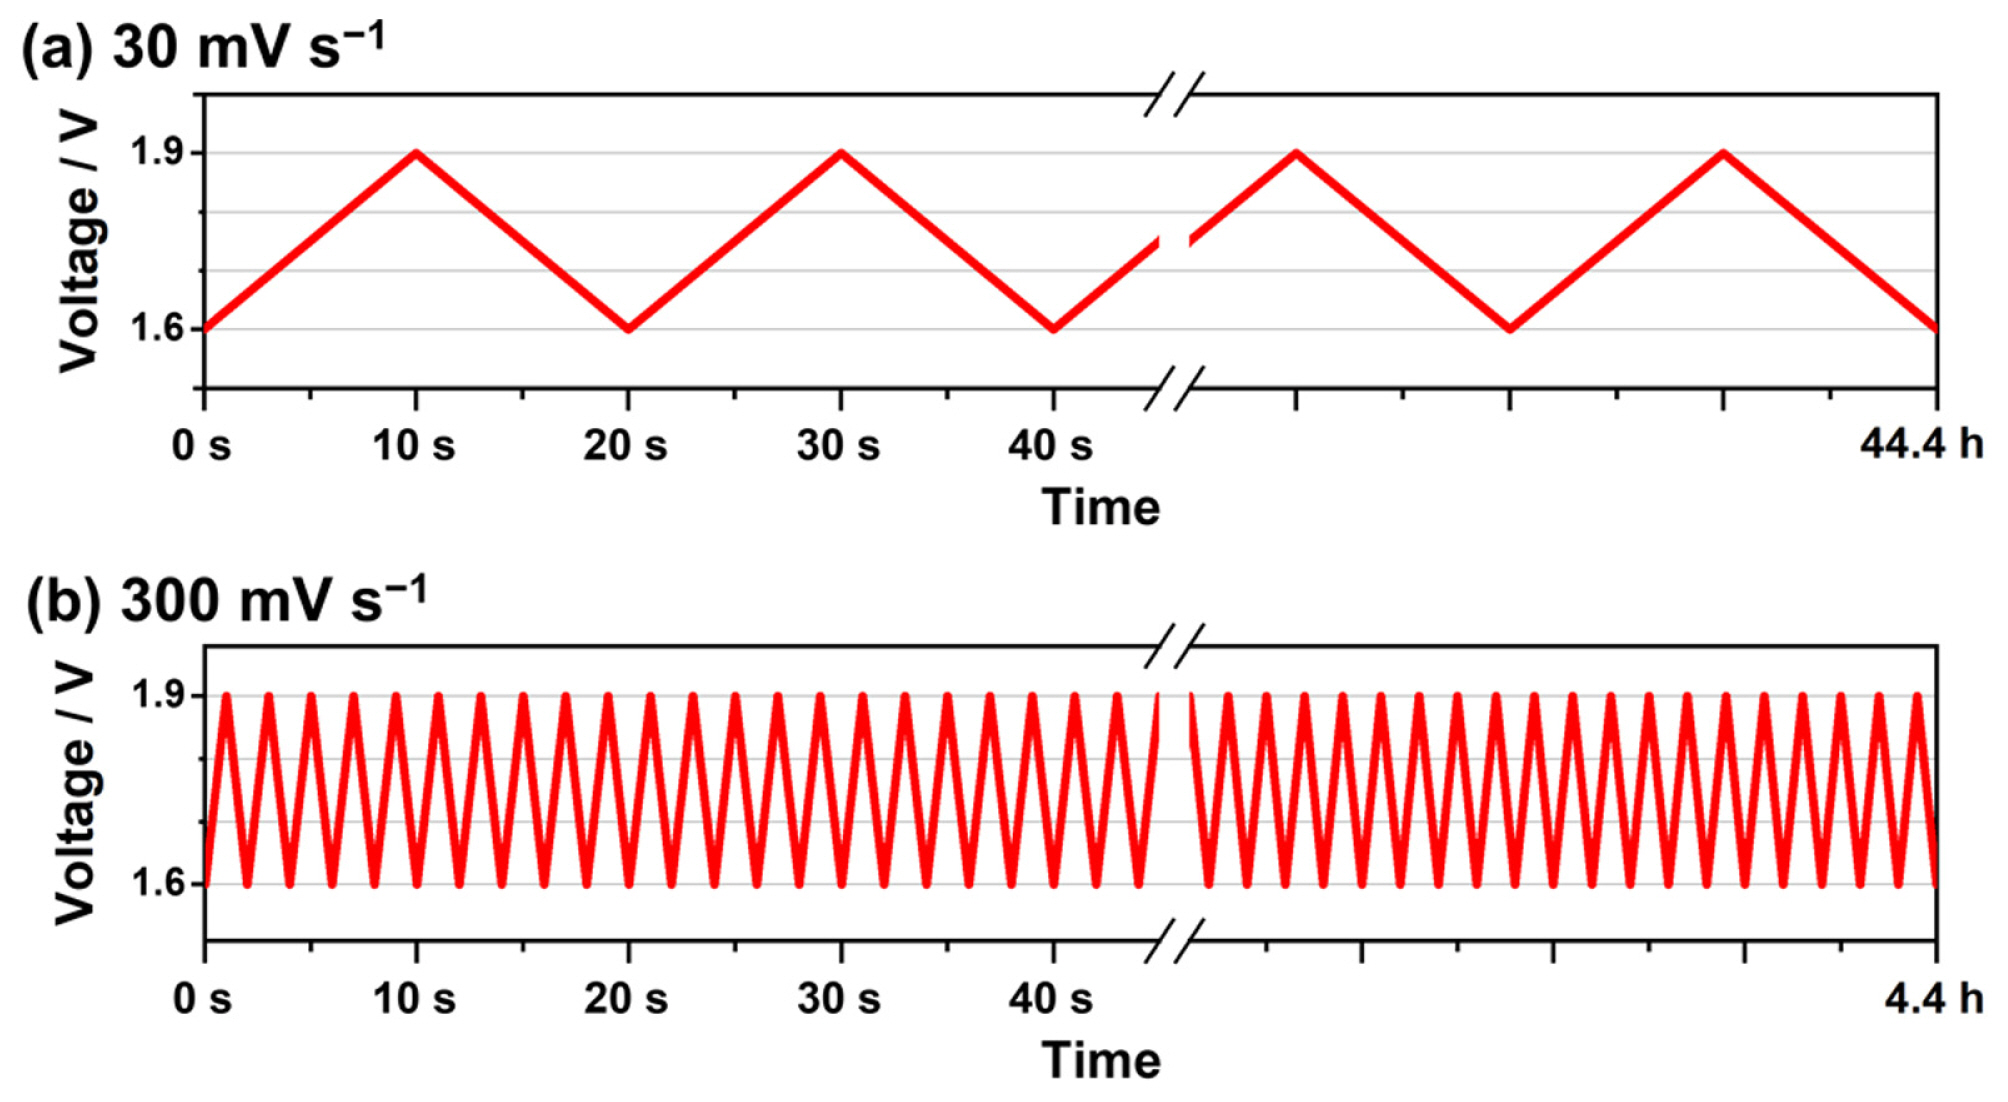
Fig. 3 shows the voltage cycling profiles used in this study. Two triangular voltage cycles were used to analyze the cell degradation. The voltage ramping rates used were 30 and 300 mV s−1, respectively. In this study, LVL was set to 1.6 V to prevent the reverse current flow at voltages lower than 1.4 V [18]. Meanwhile, the UVL was set to 1.9 V to prevent the severe dissolution of IrO2, followed by the formation of its dense structure at voltages higher than 2.0 V [8,9,15].
All the electrochemical data, including stair-step chronoamperometry, chronoamperometry, and Nyquist plots, were collected using a high-current potentiostat (Biologic HCP-803). To measure the polarization curve, stair-step chronoamperometry was performed at the beginning (BoT) and the end of the test (EoT). The voltage was increased from 1.3 to 2.0 V with a voltage step height of 50 mV and elapsed time of 1 min, respectively. The potentiostatic impedance was measured at 1.9 V with AC frequencies (13 mV amplitude) ranging from 50 mHz to 10 MHz.
XPS and TEM were used to characterize the Ir black catalysts. XPS spectra were obtained using a PHI 5000 VersaProbe (ULVAC PHI, Japan). For TEM (Tecnai F20 G2), the Ir nanoparticle catalyst was scraped from the MEA at the BoT and EoT. Selected area electron diffraction (SAED) was performed in order to analyze the crystal structures of the Ir black catalyst.
3. Results and Discussion
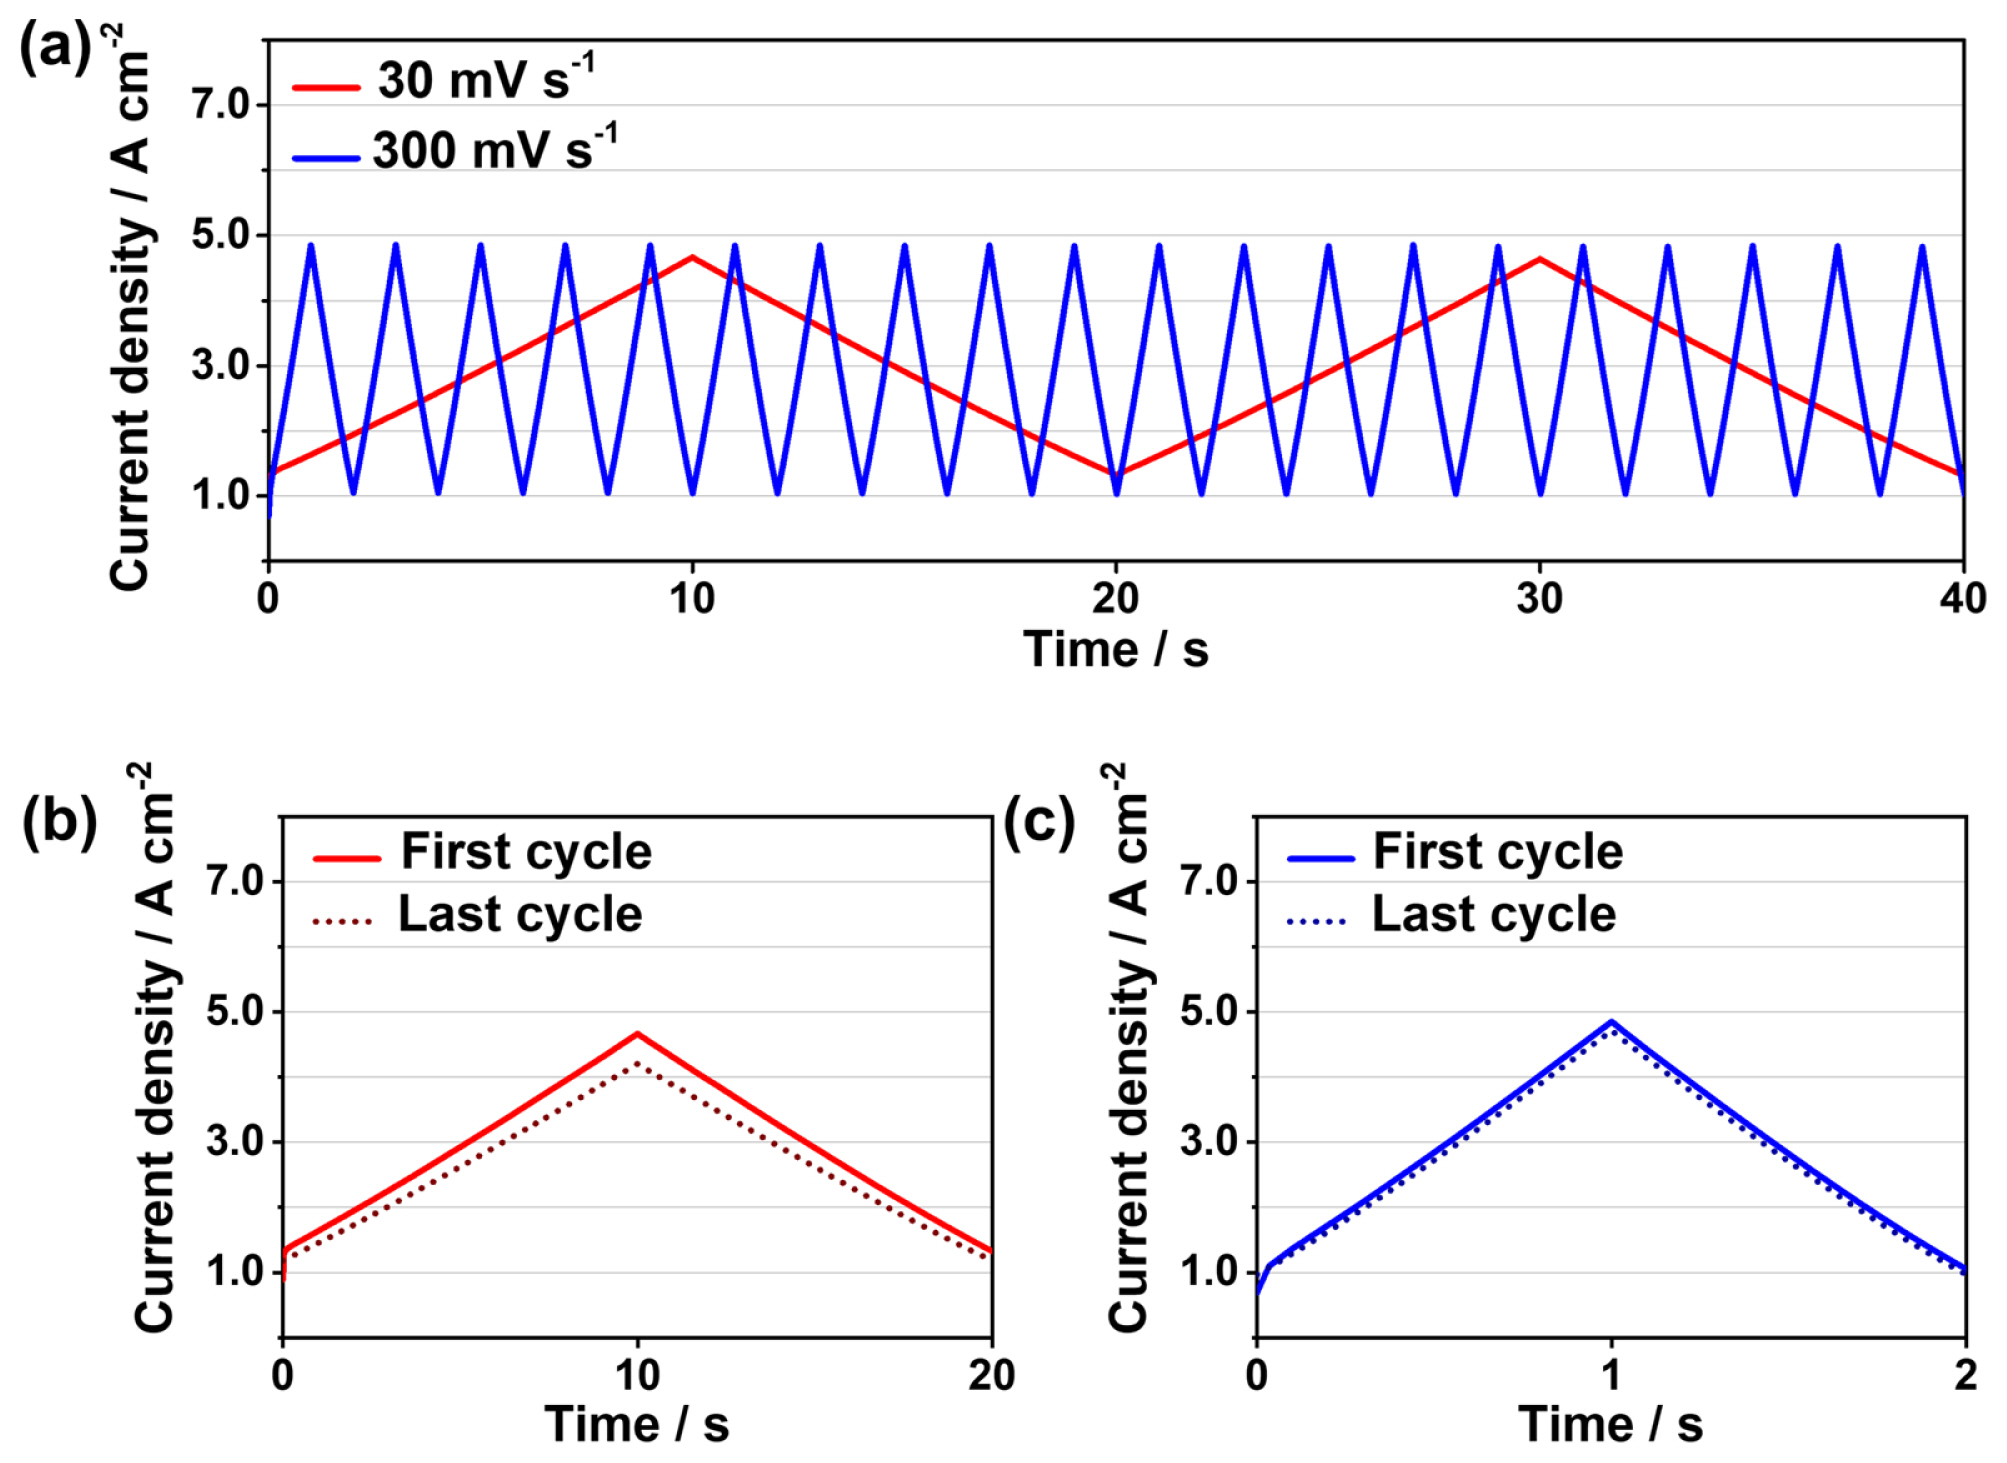
Fig. 4 shows the initial current density responses for triangular voltage cycling at the ramping rates of 30 and 300 mV s−1. During the first cycle, the current density increased from 0.89 to 4.66 A cm−2 at the ramping rate of 30 mV s−1, while it increased from 1.03 to 4.83 A cm−2 at the ramping rate of 300 mV s−1. No time delay between the current fluctuation and voltage cycling was observed in either case (Fig. 4a), indicating the fast response of the PEMWE cell after the load change [12,19,22]. Fig. 4b,c show the current response of the cell during the first and 8,000th voltage cycles at the ramping rate of 30 and 300 mV s−1, respectively. At the ramping rate of 30 mV s−1, the peak current densities at 1.9 V decreased from 4.66 to 4.20 A cm−2 after the dynamic operation for 44.4 h, while it decreased from 4.85 to 4.71 A cm−2 after 4.4 h at the ramping rate of 300 mV s−1. It might indicate that the cell degradation at the ramping rate of 30 mV s−1 was significantly higher than that at 300 mV s−1 after 8,000 cycles. The performance degradation of the PEMWE cell after voltage cycling was evaluated by comparing its polarization curves at the BoT and EoT, respectively. Fig. 5 shows the polarization curves at the BoT, and EoT at different ramping rates. Both polarization curves were slightly deviated from the BoT curve after the voltage cycling. At the ramping rate of 30 mV s−1, the current density at 1.9 V decreased from 4.73 to 4.36 A cm−2 (Fig. 5a), while it decreased from 4.97 to 4.85 A cm−2 at the ramping rate of 300 mV s−1 (Fig. 5b). These results are consistent with the degradation tendency of the current density. It can be interpreted that the voltage cycling at 30 mV s−1 degraded the cell more severely than that at 300 mV s−1 after 8,000 cycles.
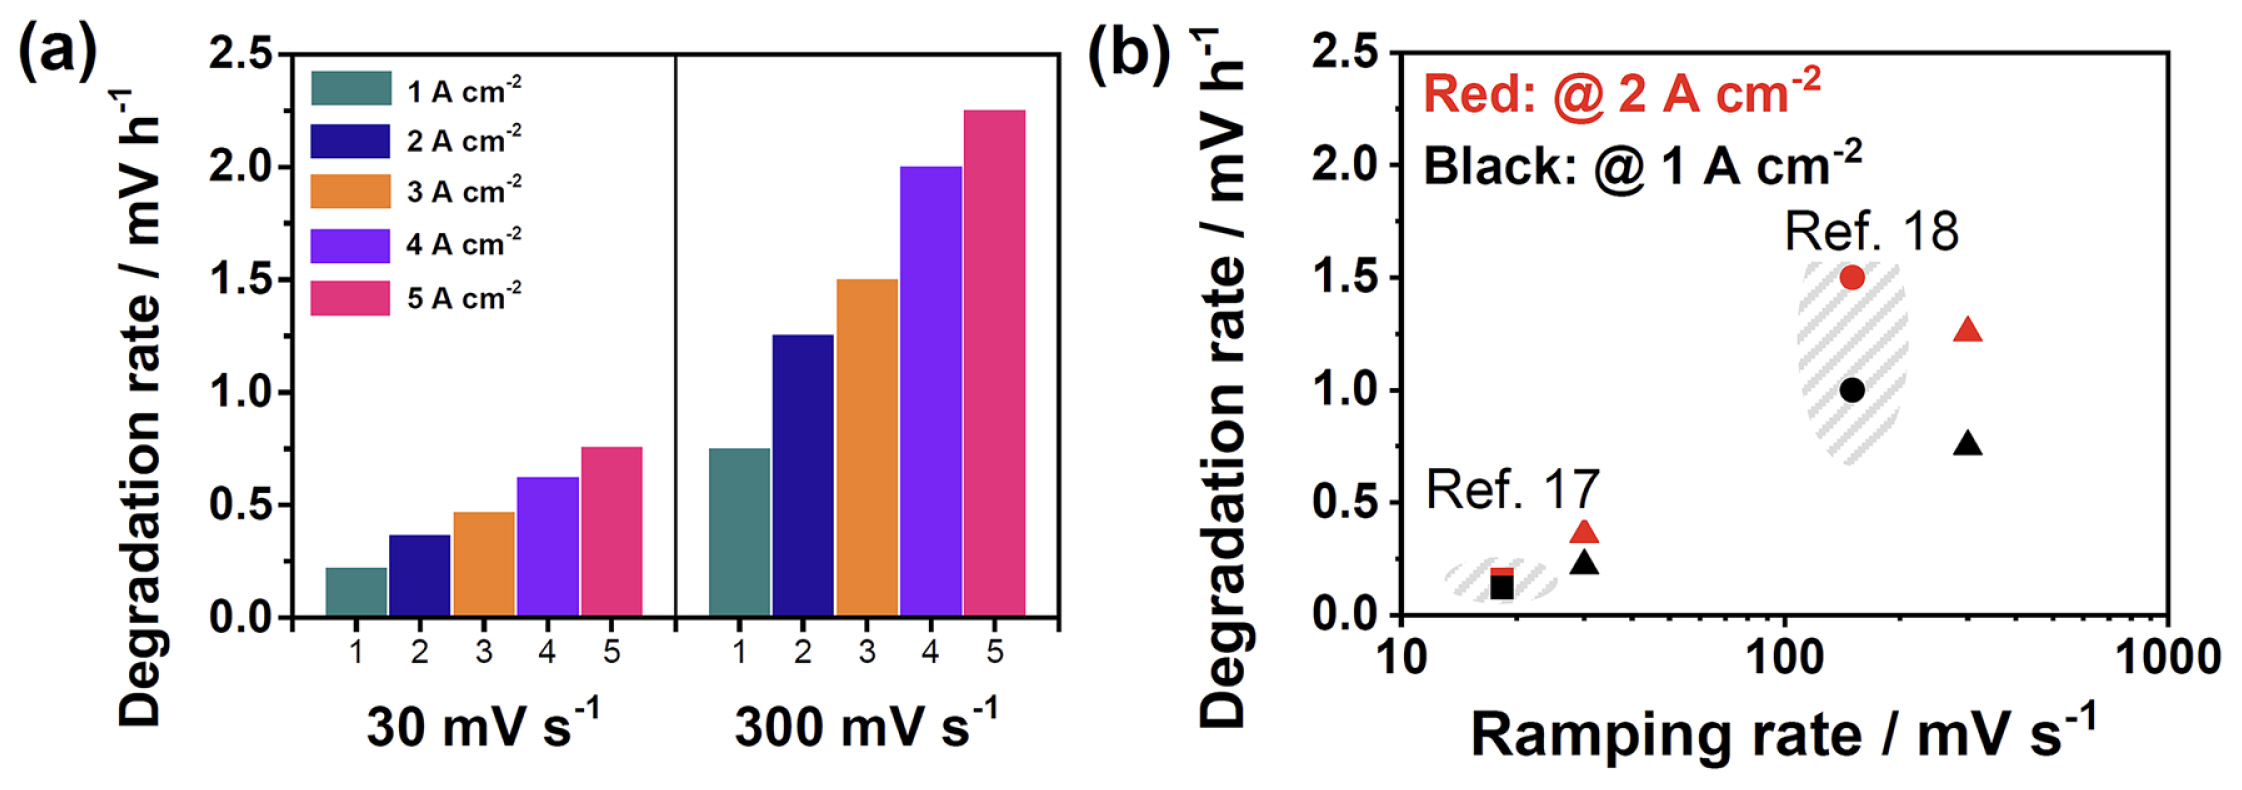
However, the more severe degradation at 30 mV s−1 may have been caused by the longer operation time of 44.4 h. Hence, it is necessary to compare the performance degradation of the cell using the same operating time. Fig. 6 shows the degradation rates (the change in the overpotential per operation time at the different current densities; mV h−1) for the ramping rates of 30 and 300 mV s−1. It clearly showed that the degradation rate at 300 mV s−1 was higher than that at 30 mV s−1 at all points of the current density. Notably, the degradation rate increased with current density, implying that an increase in the cell resistance, including ohmic, charge transfer, and mass transfer resistances.
Fig. 6b summarizes the degradation rates evaluated in this study and those reported in the previous studies [17,18]. Alia et al. [17] reported the degradation rates of 0.12 and 0.13 mV h−1 at the current densities of 1 and 2 A cm−2, respectively, for a PEMWE cell. This cell was composed of a 180 μm-thick Nafion membrane, and the loading amount of the IrO2 anode catalyst was 0.1 mg cm−2. This cell was operated at the ramping rate of 18.3 mV s−1 with triangular voltage cycling from 1.45 to 2.0 V. Meanwhile, Voronova et al. [18] reported the degradation rates of 1.00 and 1.53 mV h−1 at the current densities of 1 and 2 A cm−2, respectively. They used a cell composed of a 125 μmthick Nafion membrane. The loading amount of the IrO2 anode catalyst was 1.0 mg cm−2, and the cell was operated at the ramping rate of 150 mV s−1 with voltage cycling from 1.4 to 2.2 V. In present study, the degradation rates of 0.22 and 0.36 mV h−1 was calculated at the current densities of 1 and 2 A cm−2, respectively, at the ramping rate of 30 mV s−1. For the ramping rate of 300 mV s−1, the degradation rates were recorded as 0.75 and 1.26 mV h−1 at the current densities of 1 and 2 A cm−2; these degradation rates were higher than those obtained at 30 mV s−1. Fig. 6b clearly shows that the degradation rate increases with the ramping rate, which can be generalized to other studies performed under different experimental conditions. The slightly higher degradation rates reported in ref. [18] may have originated from its UVL (2.2 V), which was higher than that used in other studies (≤2.0 V); a higher UVL generally results in severe catalyst degradation [8,9,13,14,16,17,20,22].
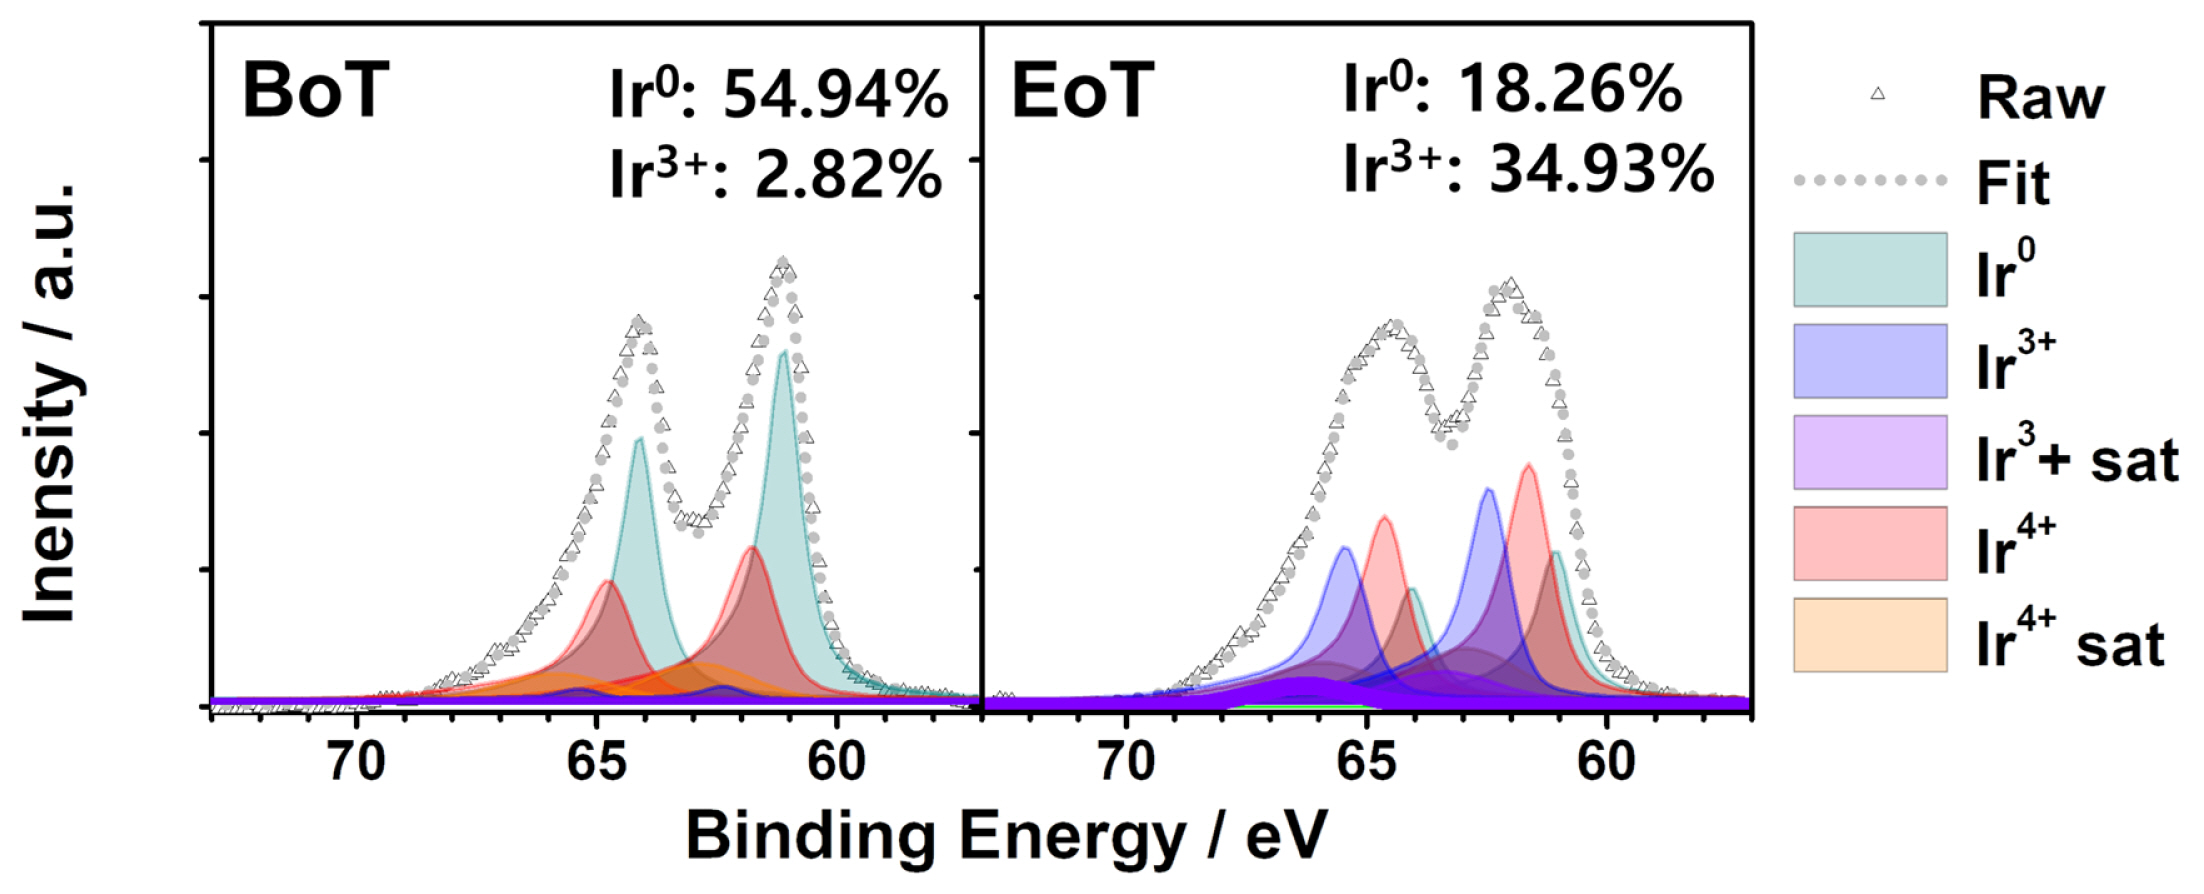
To understand the performance degradation, the Ir anode catalysts used for voltage cycling at 300 mV s−1 were analyzed using XPS and TEM. These catalysts exhibited a relatively high degradation rate, and their XPS spectra and TEM images were obtained both before and after the voltage cycling. A change in the catalyst is the main cause of the degradation, as reported in many studies [9,16–18,22]. Fig. 7 shows the XPS spectra of the Ir catalysts at the BoT and the EoT. Deconvolution of the XPS spectra indicated that the chemical state of the uncycled Ir surface was mainly metallic (60.8 eV [31], 54.9%). The presence of the Ir4+ peak (61.7 eV [27], 42.3%) at the BoT can be attributed to the native oxide of the Ir catalyst. After voltage cycling at 300 mV s−1, the Ir 4f7/2 peak was shifted and was deconvoluted into two peaks at 61.7 and 62.8 eV, which correspond to the oxidation states of Ir4+ and Ir3+, respectively [31], as a broad peak with mixed states [32]. Notably, the intensity of the Ir3+ peak increased to 34.9% with the voltage cycling whereas that of metallic Ir decreased to 18.3%. This indicates that Ir catalyst was oxidized to Ir3+, as an electrochemically active species toward the oxygen evolution reaction [20,33].
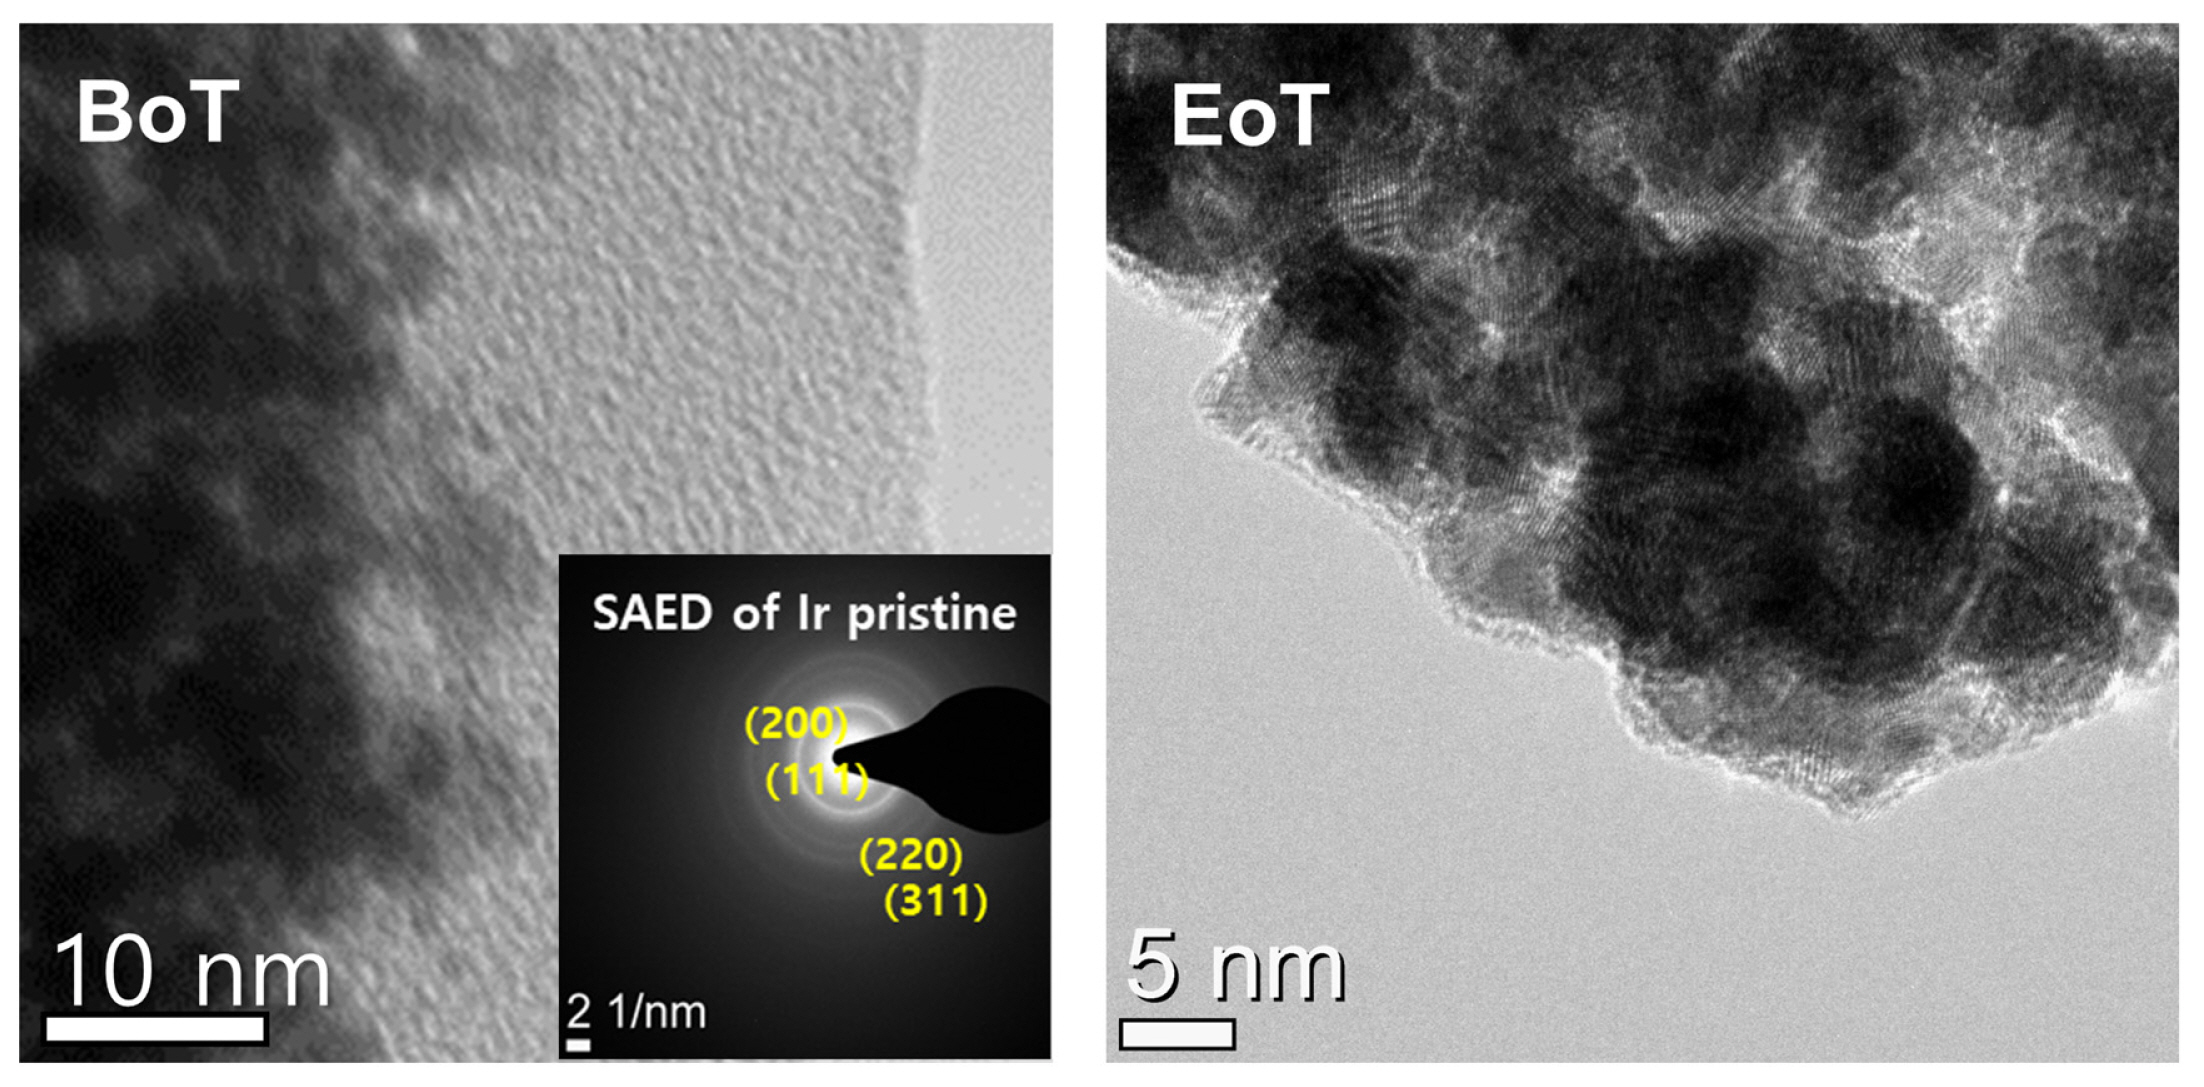
Fig. 8 shows the high-resolution TEM images of the Ir catalyst before and after the voltage cycling at 300 mV s−1. The catalyst layer was composed of nanosized Ir black particles. The SAED image of the uncycled Ir black particles exhibited Bragg diffraction patterns for the (111), (200), (220), and (311) planes of metallic Ir [34]. Even after the voltage cycling at 300 mV s−1, no significant change was observed in the morphology of the Ir black catalyst, which indicates that the Ir catalyst did not dissolve or agglomerate during dynamic operation. This implies that the performance degradation did not originate from the change in the Ir catalyst.
The other main cause of performance degradation is the passivation of the Ti PTL, which increases the ohmic resistance of the cell and can be evaluated via electrochemical impedance spectroscopy [13,14,16,18]. However, in this study, no significant change in ohmic resistance was observed before and after voltage cycling at the ramping rate of 30 and 300 mV s−1 (data were not shown here), which indicates that the passivation of the Ti PTL may not cause the performance degradation.
In the high current density region, the formation of an oxygen bubble might enhance the cell degradation by deteriorating the interface between the membrane and the catalyst [18,19]. Bubble formation can increase the mass transfer resistance by trapping the gas in the micropores of the catalyst layer [15]. The performance degradation of the PEMWE cell became more severe as the current density increased (Fig. 6a). The deterioration of the interface between the catalyst and membrane may have degraded the performance of the PEMWE cell. In this regard, a higher ramping rate may impose a more rapid change in bubble formation, leading to faster degradation. Alia et al. [9] investigated the effect of the square-wave voltage cycling on cell performance and reported that an increased cycling frequency leads to higher durability losses. They pointed out that the performance degradation was due to the deterioration of the catalyst/membrane interface. Despite the differences between the voltage profiles of square-wave and triangular cycling, the effect of the frequency, which is equivalent to the ramping rate, was identical in this study. Therefore, the deterioration of the catalyst/membrane interface due to bubble formation is the main plausible reason for the performance degradation in the present study, and it might be accelerated at the high ramping rate.
4. Conclusions
This study investigated the effect of the ramping rate on the durability of PEMWE. Triangular voltage cycling was used to mimic the power fluctuations of renewable energy sources. Degradation rates of 0.75 and 1.26 mV h−1 (at 1 and 2 A cm−2, respectively) were observed at the ramping rate of 300 mV s−1. In contrast, lower degradation rates of 0.22 and 0.36 mV h−1 were observed at the ramping rate of 30 mV s−1. These results might indicate that the degradation rate increased with an increase in the ramping rate. Despite the performance degradation, the microstructure of the Ir catalyst did not exhibit significant agglomeration during its oxidation to the electrochemically active Ir3+ species. Bubble formation and the subsequent deterioration of the interface between the catalyst and membrane might be considered the main causes of cell degradation, which will be pursued via our future study. This study would provide valuable insights for the development of the protocols for accelerated durability test of PEMWE systems powered by renewable energy.