Characterization of Anodized Al 1050 with Electrochemically Deposited Cu, Ni and Cu/Ni and Their Behavior in a Model Corrosive Medium
Article information
Abstract
The specific benefits of the modified films formed on preliminary anodized aluminum, including the versatility of their potential applications impose the need for evaluation of the exploitation reliability of these films. In this aspect, the durability of Cu and Ni modified anodized aluminum oxide (AAO) films on the low-doped AA1050 alloy was assessed through extended exposure to a 3.5% NaCl model corrosive medium. The electrochemical measurements by means of electrochemical impedance spectroscopy (EIS) and potentiodynamic scanning (PDS) after 24 and 720 hours of exposure have revealed that the obtained films do not change their obvious barrier properties. In addition, supplemental analyses of the coatings were performed, in order to elucidate the impact of the AC-deposition of Cu and Ni inside the pores. The scanning electron microscopy (SEM) images have shown that the surface topology is not affected and resembles the typical surface of an etched metal. The subsequent energy dispersive X-ray spectroscopy (EDX) tests have revealed a predominance of Cu in the combined AAO-Cu/Ni layers, whereas additional X-ray photoelectron (XPS) analyses showed that both metals form oxides with different oxidation states due to alterations in the deposition conditions, promoted by the application of AC-polarization of the samples.
1. Introduction
Anodization of aluminum and its alloys is a relatively simple approach for formation of highly-textured surfaces [1–10]. It enables ease of control of the respective surface parameters (pore diameters, depth and distribution) [11]. Among the apparent benefits of the anodic aluminum oxide (AAO) films is their highly-textured topology, which consists of a multitude of ordered hexagonal cells with centered cylindrical pores. This well-developed specific surface enables the deposition of a large variety of chemical substances, like paints, pigments, metals, oils, etc.
Particularly, the deposition of metals inside the pores of the Al2O3-matrices is successfully applied for the formation of functional coatings, having a number of practical applications. The AAO layers, modified with Cu [12–20], Ni [21–29] and combined Cu and Ni [30–34], are implemented as decorative and corrosion protective coatings [35–45], as well as solar absorbers [22,24,25].
The beneficial properties of the Cu/Ni modified AAO layers can be further extended by addition of other elements, such as Fe and Co [46–49].
Among these remarkable benefits, especially the Cu and Ni modified AAO layers attract special attention, because of their ability to be used as catalysts for hydrogen and oxygen evolution [50–54], chemical synthesis [55–61] and contaminant decomposition [62,63].
On the other hand, the reliable service of any anodic aluminum oxide (AAO) film with deposited Cu and/or Ni requires high durability and chemical stability in aggressive and especially corrosive media. In this sense, the most widely used model corrosive media are NaCl solutions [64–66]. Particularly, the 3.5% NaCl solutions are the most preferred, since they resemble sea water [67–69].
The coincidence of the application versatility of copper or nickel modified AAOs and the need for evaluation of their durability have imposed the investigation of the performance of the combined AAO-Cu/Ni films in model corrosive media (MCM).
In this sense, the aim of the present research is to define the impact of the AC-assisted Cu and Ni deposition on the characteristics and performance of preliminary anodized AA1050 alloy after extended periods of exposure to a 3.5% NaCl MCM. The investigations comprise the evaluation of their durability in corrosive medium, the acquired morphology and the chemical composition of the obtained Cu/Ni modified AAO layers. The performance of the coatings in the model corrosive medium was assessed by means of electrochemical impedance spectroscopy (EIS) and potentiodynamic scanning (PDS). The film topology was characterized by scanning electron microscopy (SEM), whereas the exact chemical composition of the layers was defined by energy dispersion X-ray spectroscopy (EDX) and X-ray photoelectron spectroscopy (XPS).
2. Experimental
2.1. Electrochemical film formation
The anodic films were formed on eight square (2×2 cm) specimens, cut from the low-doped AA1050 alloy, in order to perform a systematic comparative study. All, but the referent samples underwent the following three consecutive procedures:
The preliminary surface treatment included etching in a NaOH solution (50 g dm−3) for 2 minutes at 60°C and subsequent activation in diluted nitric acid (HNO3:H2O - 1:1), again for 2 minutes at room temperature, followed by vigorous washing with both tap and double-distilled water. All samples were anodized in 15 wt.% H2SO4 by polarization under galvanostatic conditions (current density 15 mA cm−2) for 50 min at 20°C.
The electrochemical deposition of Ni and/or Cu in the anodized oxide layers was performed by alternating current polarization with at a constant voltage of 20 V and frequency 60 Hz, for 15 min at 20°C. In order to carry out the planned systematic comparative study on the influence of the AC-deposition, the samples were divided into four sets of two samples, as shown in Table 1.

Sample description
2.2. Electrochemical characterizations
All samples were subjected to comparative electrochemical measurements after 24 and 720 hours of exposure to the model corrosive medium (MCM), composed of 3.5% NaCl solution performed with a potentiostat/galvanostat Autolab PGStat 30 of Metrohm (Netherlands), equipped with a frequency response analyzer (FRA2). The experiments were performed in a standard, three-electrode flat cell (ISO 16773-2), equipped with a cylindrical platinum mesh as a counter-electrode and an Ag/AgCl/3M KCl reference electrode. Test areas of 2 cm2 from each specimen served as working electrodes. The measurements included electrochemical impedance spectroscopy (EIS) and potentiodynamic scanning (PDS). The EIS spectra were acquired in the frequency range from 10 kHz to 0.01 Hz, distributed in 50 measurement points. The amplitude of the excitation signal was up to 35 mV regarding the open circuit potential (OCP), in order to acquire readable spectra. The PDS measurements were performed in the range from −150 to + 550 mV vs. OCP, at a sweep rate of 10 mV s−1.
2.3. Surface morphology and composition characterizations
The morphological observations were performed by means of Scanning Electron Microscopy (SEM), at 5000x magnification, in regime of back scattered electrons applying acceleration voltage of 20 kV. All the SEM images were acquired using a SEM/FIB LYRA I XMU product of TESCAN (UK).
Two independent methods were used for defining the element distribution on the surface of the formed films. The investigated samples were submitted to energy dispersion spectroscopy (EDX) analyses, followed by X-Ray Photoelectron Spectroscopy (XPS). The EDX analyses were executed by Quantax 200 of BRUKER (Germany), immediately after acquisition of the SEM images.
Subsequent XPS studies were performed on a VG Escalab II system, using Al Kα radiation with an energy of 1486.6 eV, whereas the chamber pressure was 10−9 Pa. The C1s line of adventitious carbon at 285.5 eV was used as internal standard to calibrate the binding energies. The photoelectron spectra were corrected by subtracting a Shirley-type background and were quantified using the peak area and Scofield’s photoionization cross-section. The accuracy of the backscattered electrons measured was ± 0.2 eV.
3. Results and Discussion
3.1. Electrochemical measurements
In order to obtain reliable data for both the barrier ability and durability of the obtained films, all electrochemical measurements were performed twice: after 24 and 720 hours of exposure to the seawater-resembling MCM. The acquired spectra reveal almost perfect overlapping between the samples of each of the respective groups and indistinguishable deviations among the respective AAO, AAO-Cu, AAO-Ni and combined AAO-Cu/Ni coatings. Fig. 1 shows the averaged EIS spectra for each sample couple.
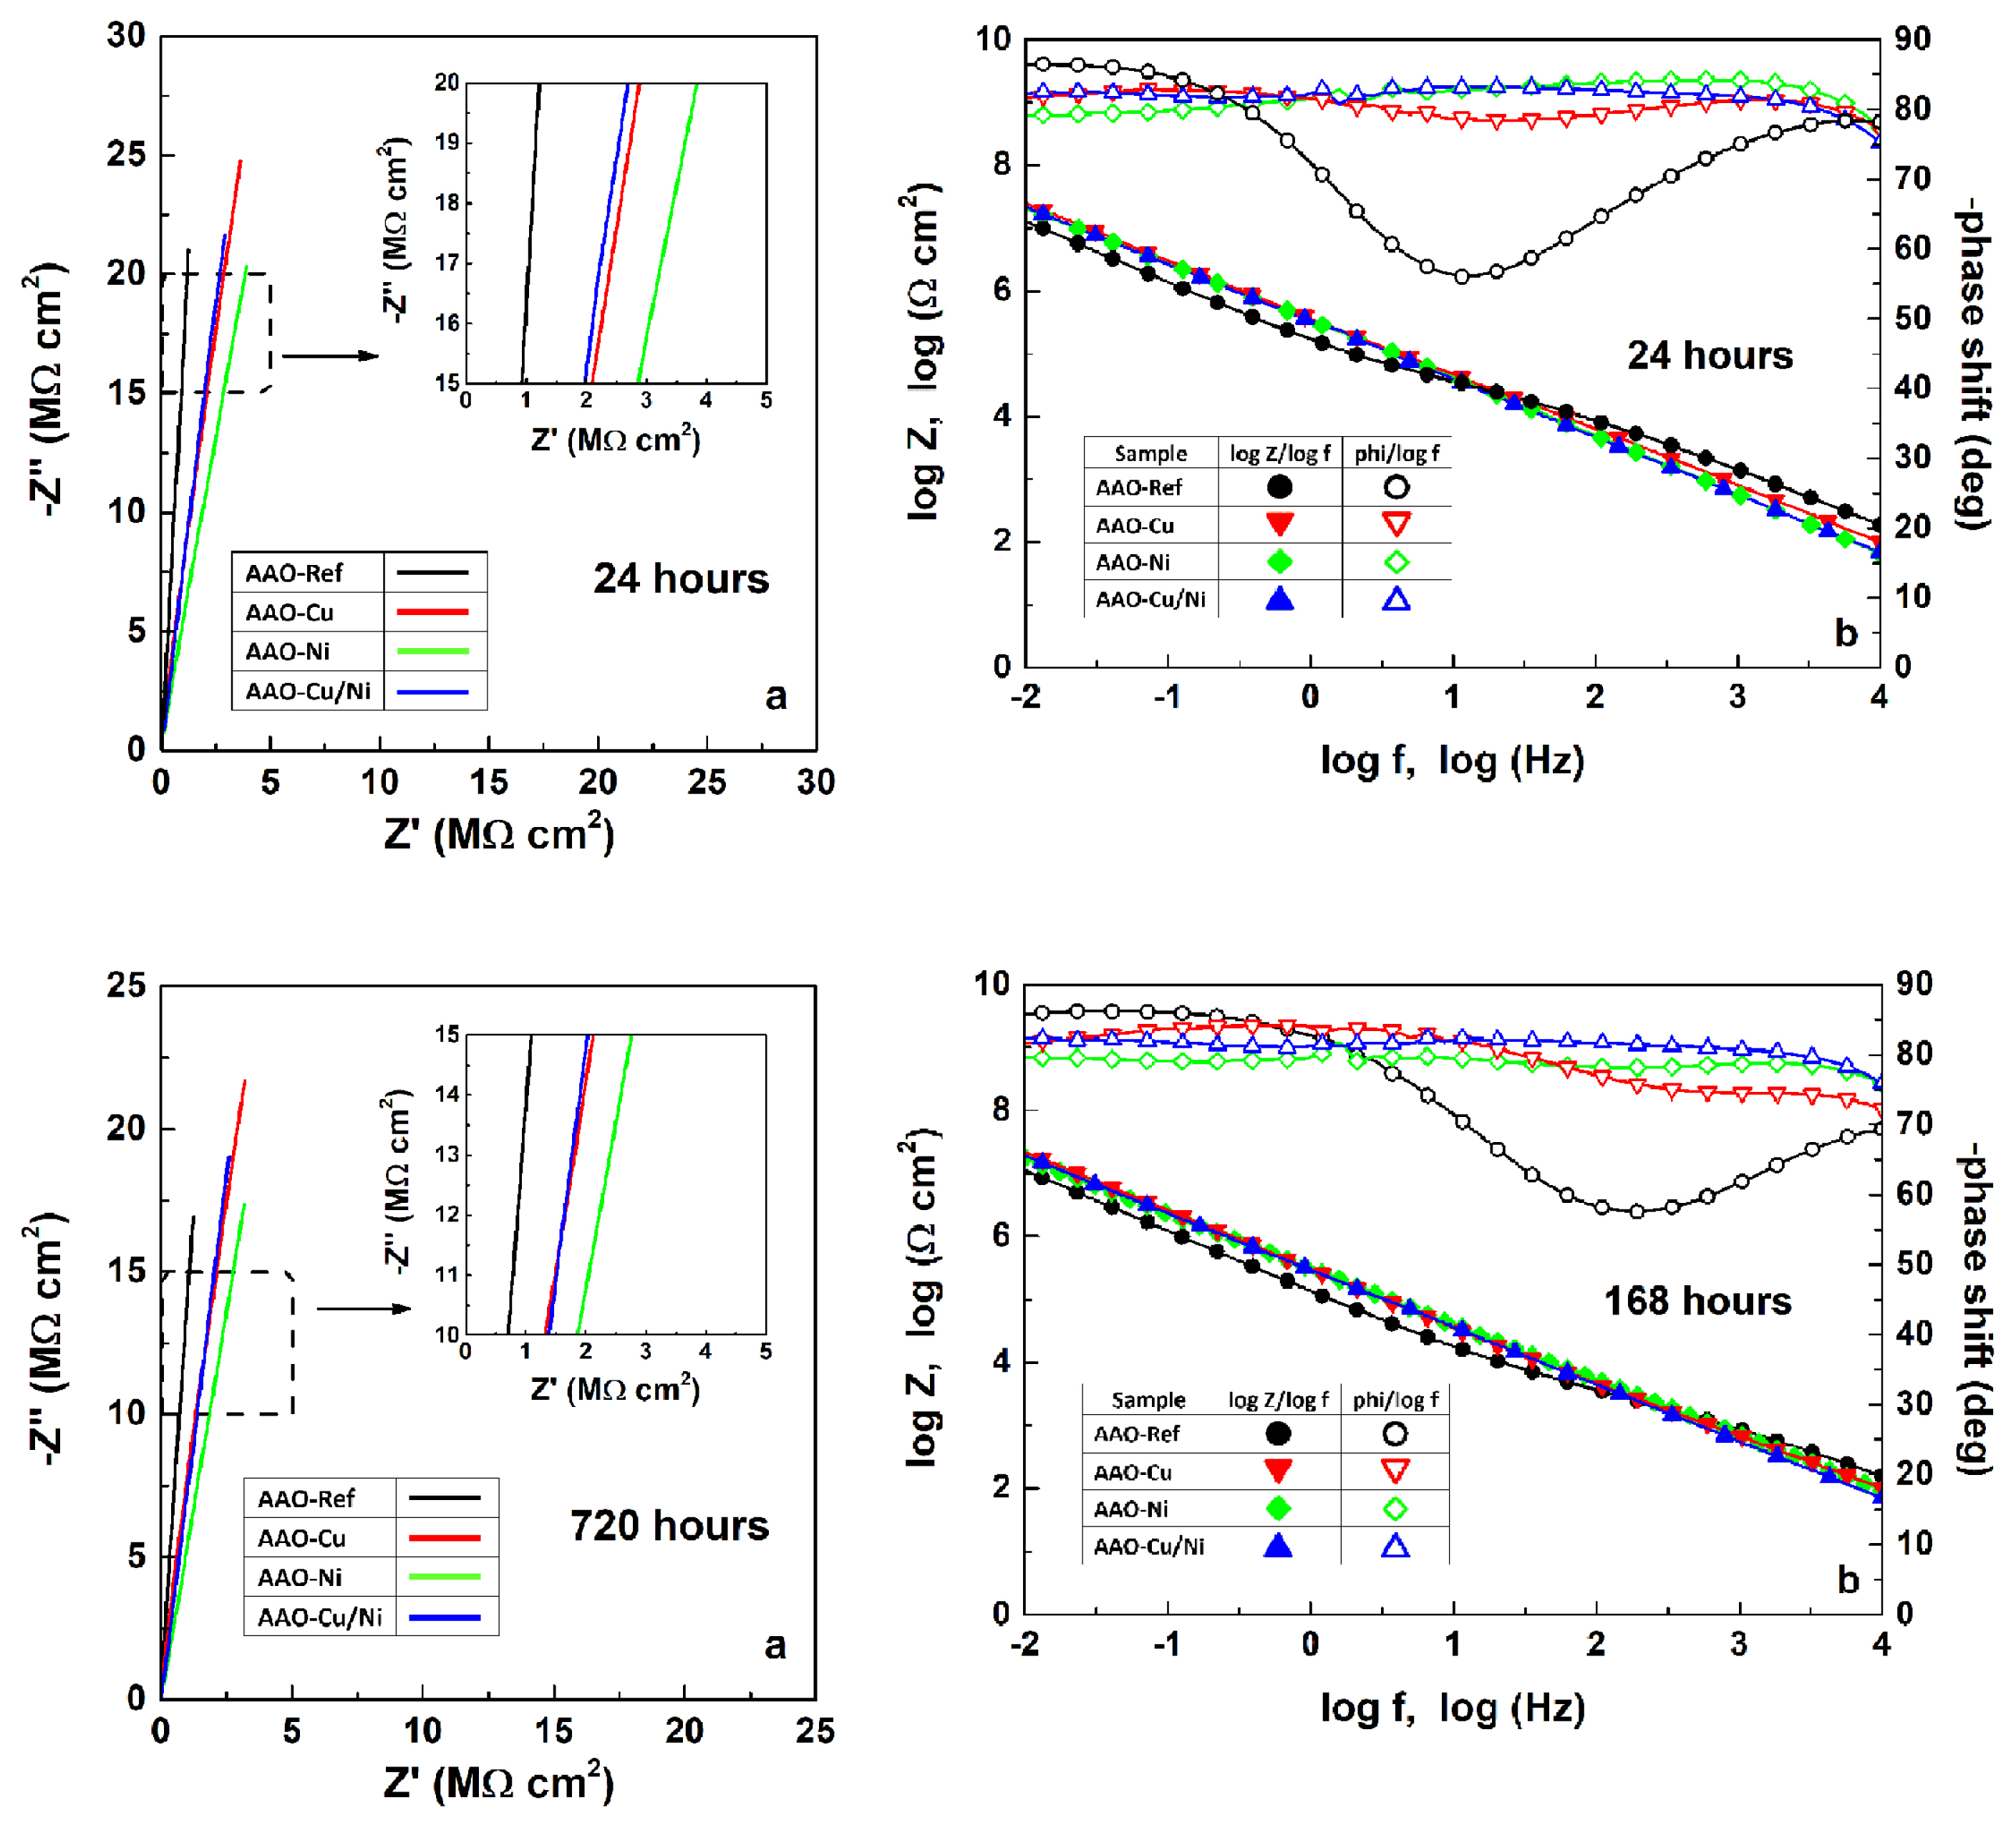
Averaged Nyquist (a) and Bode (b) plots of the EIS spectra, acquired after 24 and 720 hours of exposure.
In addition, there are no distinguishable changes in the spectra, acquired after 720 hours of exposure, compared to those, obtained after the initial 24 hours. For this reason, all spectra were fitted to the same model equivalent circuit (MEC), in order to point out the variation of the values of the respective impedance elements.
For the present study, a simplified MEC was employed, compared to those in previous works [35,67,70–72]. This simplified circuit was selected following the rule of thumb [69,73–75], which imposes the use of the simplest possible equivalent circuit, that enables a high rate of fitting to the acquired spectra. Besides, following other previous works, it was assumed that some of the interfaces cannot be distinguished, due to the inherent similarities of the corresponding phases. A clear distinguishable electric double layer (edl) appears on the interface between the liquid MCM and the solid AAO (including the Cu and Ni deposits). The edl possesses its own capacitance (Cedl). This layer covers the entire AAO surface, including the pore walls and bottoms and the areas among the pores (Fig. 2).
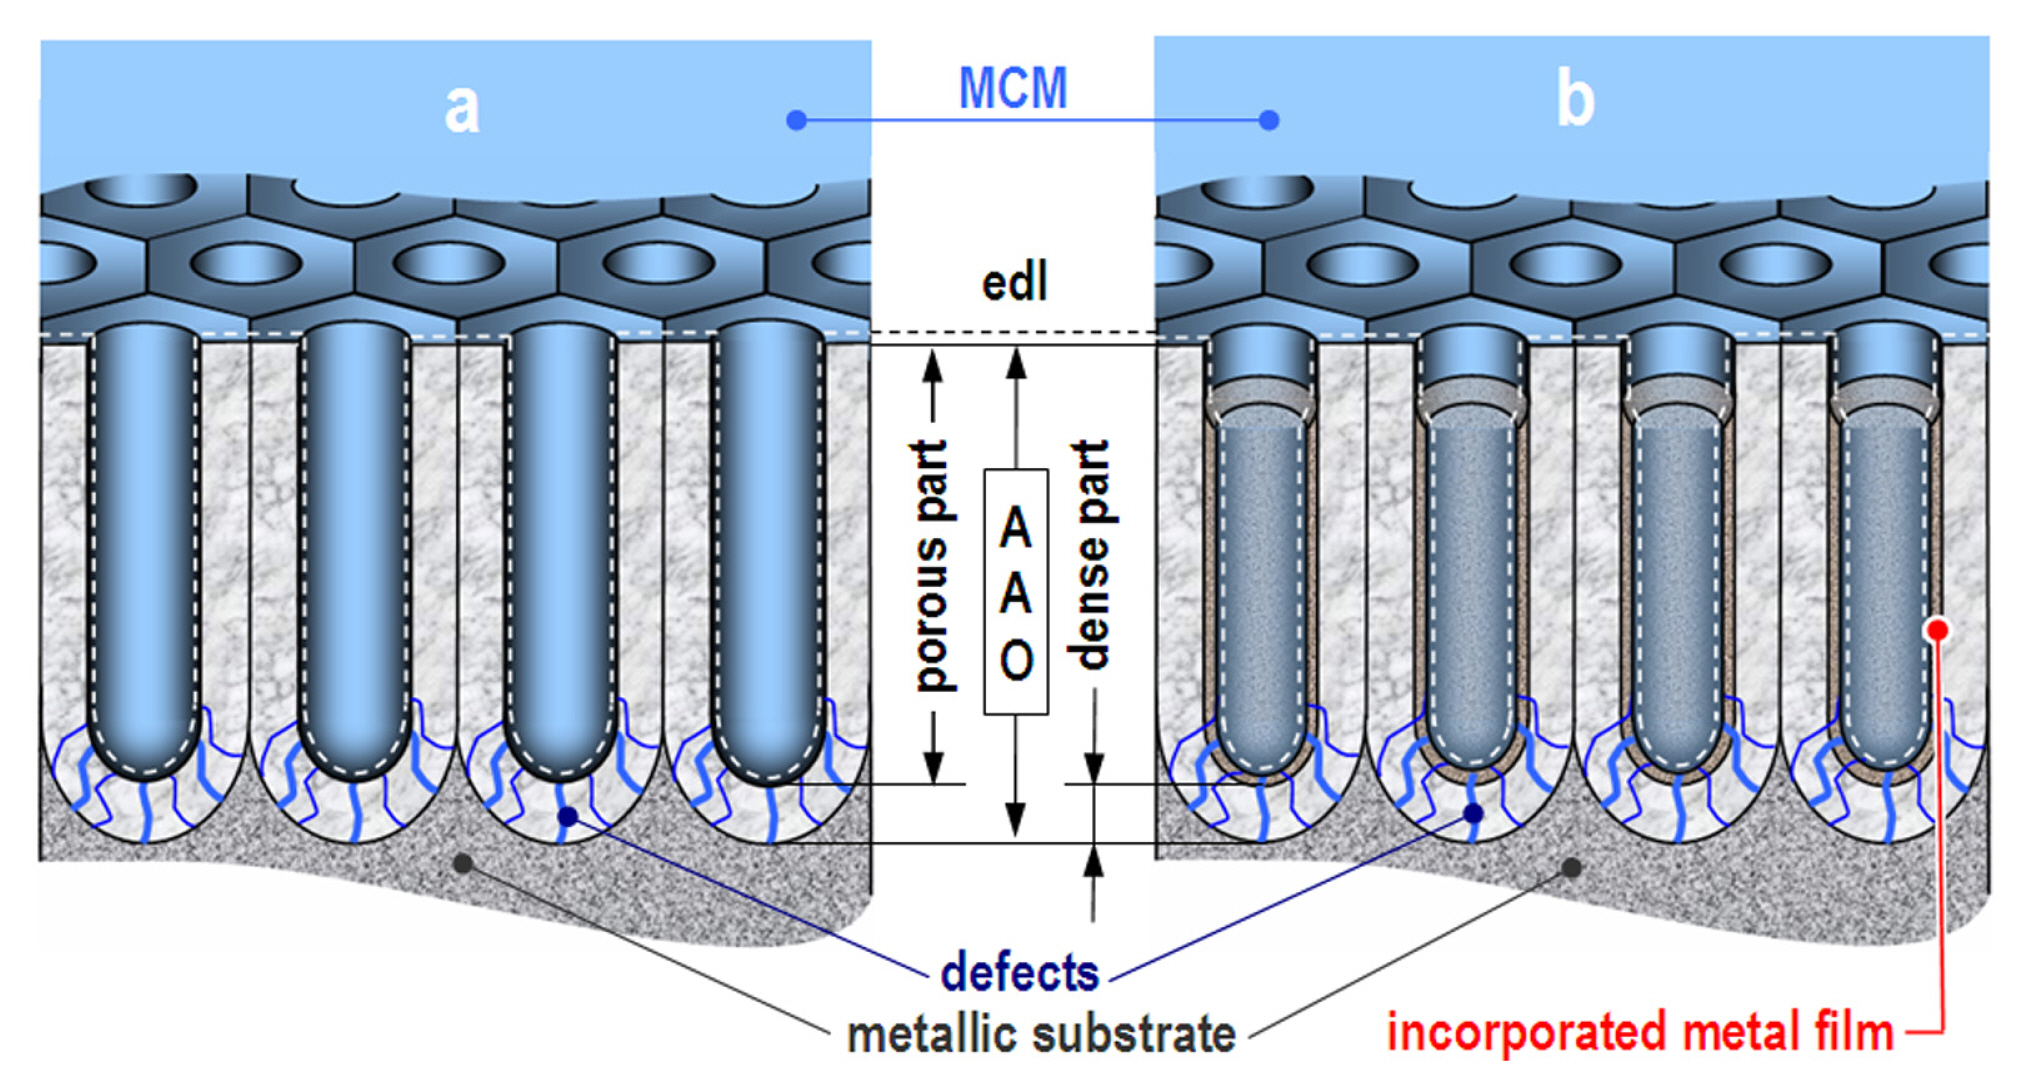
Conceptual models of the investigated in the present study reference (a) and modified (b) AAO layers.
It is possible to expect some fluctuations of Cedl inside the pores and the zones among them, but these cannot be distinguished by the impedance analyzer. On the other hand, due to their insulation properties, the reference and the modified AAO layers (all assigned just as “oxide layers” or OL) also possess distinguishable capacitances (CAAO, CAAO-Cu, CAAO-Ni and CAAO-Cu/Ni, respectively).
On the contrary, the porous and the dense parts of the respective oxide layers cannot be distinguished, since both are composed of amorphous Al2O3. Consequently, the capacitance of the entire oxide layer depends on the dense barrier layer which completely covers the metallic substrate, insulating it from the corrosive medium, already penetrated in the pores. In the same manner, the interface between the metallic substrates and the covering oxide layers should be indistinguishable, as well. The reason being is that both Al and Al2O3 solid phases are composed of aluminum in different oxidation states and that strong covalent bonds between the substrate and the covering oxide exist.
However, according to the classical theories [76–79] and some recent extended reviews [80–82] the pore formation and the subsequent electrochemical deposition of Cu and/or Ni require occurrence of defects in the dense oxide sublayer. These defects serve as ion transport pathways, which enable electric charge transfer between the electrolyte and the metallic surface during anodization (in this case 15 wt.% H2SO4) and during metal deposition (from the electrolytes described in Table 1). These ion transport pathways remain after the film formation and during the impedance data acquisitions they can be distinguished by the diffusion obstructions accompanying the interaction of the corrosive medium components with the surface of the metallic substrate. The reactions between the corrosive components of the electrolyte and the Al-surface under the defects in the dense AAO layer provide the whole charge transfer between the MCM and the investigated specimens during EIS data acquisition. These charge transfer reactions comprise both types of cathodic (oxygen reduction and resulting local alkalization) and anodic (aluminum oxidation and dissolution) corrosion reactions. The obstructions, related to the ion transport through the defects underneath the pores are ascribed to retarded diffusion constant phase elements (CPEdiff) and charge transfer resistance (Rct). Thus, the used MEC for the interpretation of the acquired EIS data (Fig. 3) was composed, following the model described above.
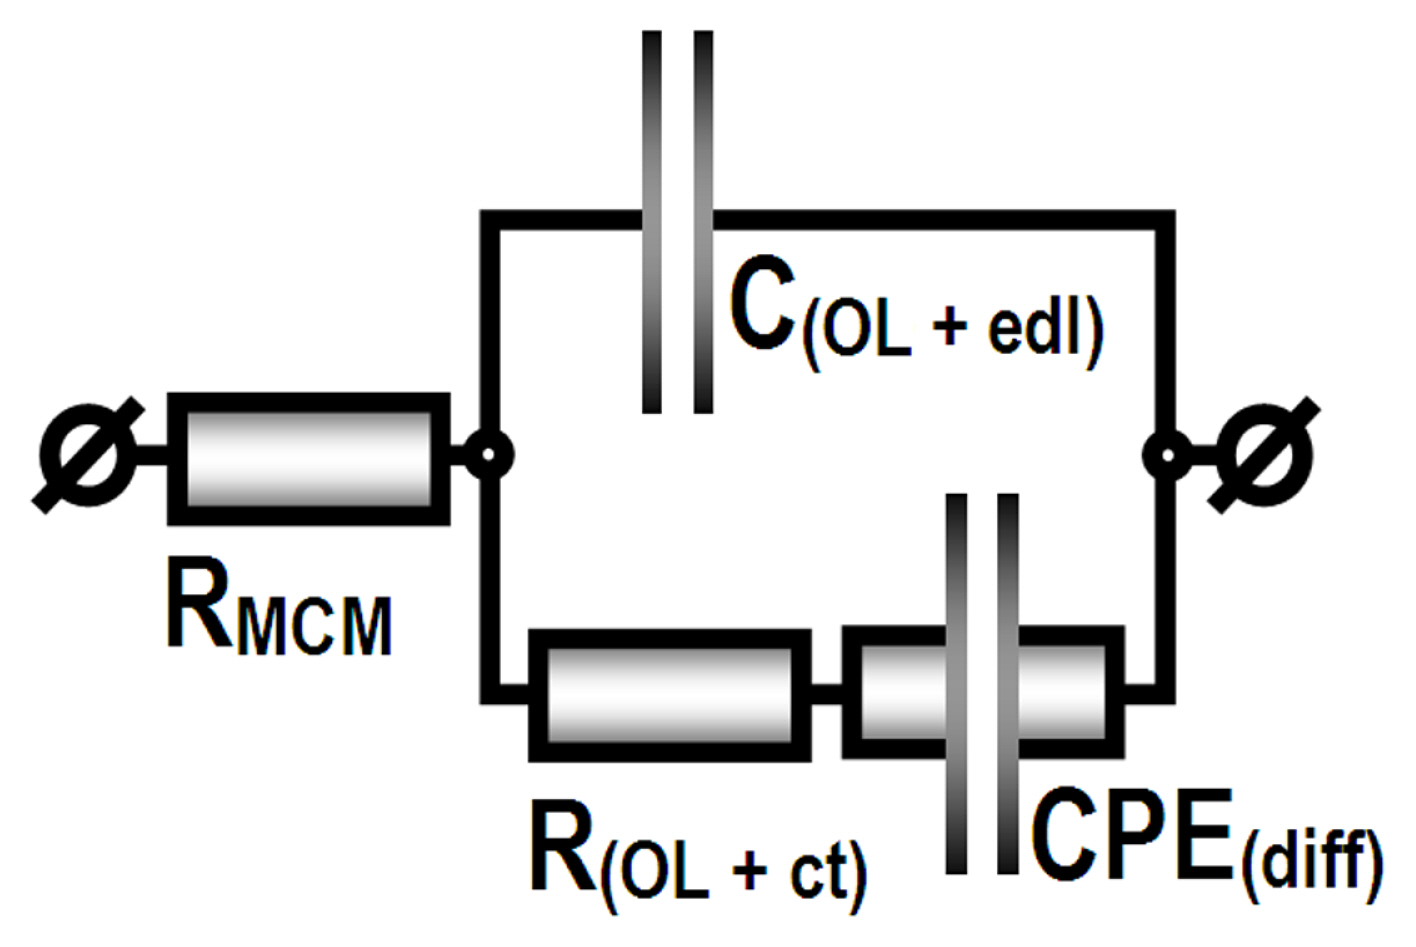
Model equivalent circuit used for numerical EIS data acquisition: RMCM - resistance of the model corrosive medium; C(OL+edl) - capacitance of the dense Al2O3 part of the AAO; R(OL+ct) - resistance of the MCM penetrated to the metallic substrate and the respective charge transfer; CPEdiff - constant phase element of the diffusion retarding the ion transport across the AAO defects.
The data acquired from the fitting of the EIS spectra from Fig. 1 to the MEC illustrated in Fig. 3 are summarized in Table 2, for the initial 24 hours of exposure, and in Table 3 for the final EIS spectra acquisitions after 720 hours of exposure.

Results of the data fitting of the EIS spectra, acquired after 24 hours of exposure

Results of the data fitting of the EIS spectra, acquired after 720 hours of exposure
The data acquired after the initial 24 hours of exposure do not reveal remarkable differences among the sample groups. The resistance of the 3.5% NaCl solution (RMCM) has shown a deviation between 5 and 10 Ω cm2. These deviations are probably related to the penetration rate of MCM into the respective OL pores. The oxide layer capacitance (C(OL+edl)) increases with one order of magnitude after Cu-impregnation, twice more, after Ni-inclusion, and almost with two orders of magnitude after the combined Cu/Ni film formation. This C(OL+edl) increment is related to the respective decrease of the capacitive reactance Zc of the oxide layers due to the Cu and/or Ni depositions. The unexpected decrease of the capacitive reactance of the AAO layers by the electrochemical metal deposition is related to the widening of the AAO pores and the ion transport pathways beneath them. This claim is reasonable since the alternating current application results in a multitude of subsequent anodic and cathodic polarizations, promoted by the respective positive and negative AC-signal alterations. During the positive (anodic) semi-periods, the relatively high voltage causes oxygen evolution reaction. This reaction results in abundance of dissolved oxygen inside the pores.
Afterwards, during the negative (cathodic) semi-periods, the forced polarization results in accelerated local alkalization (Eq. 1):
This alkalization is confined to the pore bottoms just above the dense AAO layer and its defects (Eq. 2).
Finally, the higher C(OL+edl) of the modified oxide layers, compared to the reference AAO reveal that the Cu and/or Ni depositions on the pore walls and bottoms are rather thin and probably porous, otherwise these depositions would interrupt any contact between the MCM inside the pores and the defects beneath them, resulting in a pure capacitive response from the EIS spectra.
Indeed, the insets in Fig. 1 reveal slight (−Z″/Z′)-slopes, which become more distinct after incorporation of copper and nickel.
The R(OL+ct) variations, caused by the Cu and/or Ni incorporation reveal other trends. The copper incorporation results in a weak decrease in R(OL+ct), whereas its values increase by two entire orders of magnitude after Ni deposition. In the cases of combined Cu/Ni incorporation, the R(OL+ct) increment caused by the Ni-incorporation is suppressed rather by the lower concentration of Ni2+ ions (i.e. 0.2 and 0.4 mol dm−3 NiSO4, Table 1) than by the occurrence of Cu2+ ions. Consequently, adding 0.2 mol dm−3 Ni2+ ions, results in the increase of R(OL+ct) by an entire order of magnitude, whereas the Cu-incorporation leads to negligible R(OL+ct) alterations. The remarkable difference in R(OL+ct) after Ni or Cu incorporation appears predominantly over the dense AAO layer and its defects. Probably, the Ni2+ ions obstruct the access of corrosive species to the defective dense AAO by forming a denser film of incorporated metal or by formation of additional complex compounds in the liquid medium above the pore bottoms. This assumption is more probable than any obstruction by Ni-precipitates, because Ni and Cu compounds possess similar solubility and their effects should be indistinguishable. Indeed, the major difference between Ni2+ and Cu2+ ions is the much higher aptitude of the former type of ions to form complexes.
Finally, the diffusion constant phase element (CPEdiff) values uncover other features of the investigated oxide layers. The relatively similar CPEdiff values for all cases of AAO, AAO-Cu, AAO-Ni and combined AAO-Cu/Ni layers reveal that the denser Ni-films and complexes do not obstruct completely the ion transfer pathways beneath the pores. Consequently, these pathways are not capillaries filled by MCM, but rather linear and/or planar defects in the Al2O3 structure, which enable Al3+ and O2− ions transition towards both interfaces of the dense AAO layer: with the pore bottoms and the metallic surface. This assumption is confirmed by the almost capacitive character of the CPEdiff elements, revealed by the rather high values of the exponential multiplier (n), which tends to unit for all cases. Consequently, the ion exchange between the pore bottoms and the metallic surface proceeds by transport of point defects, like interstitial Al3+ and O2− ions, as well as vacancies transitions through the solid amorphous Al2O3.
The data in Table 3, acquired after 720 hours of exposure reveal that the modified films began to resemble the reference AAO layers. On the other hand, the impedance values of the reference AAO layers have not altered their values. These facts show that the AAO layers possess remarkable durability, whereas the films of incorporated metal on the pore walls and bottoms have lost their supplemental contribution to the barrier properties of the resulting protective layers.
The unique exclusion from the inference made above belongs to the C(OL+edl) values of the combined AAO-Cu/Ni layers. These values are by an entire order of magnitude higher than all the rest. Obviously, this increment of the oxide layer capacitance is a result of the simultaneous occurrence of Cu and Ni in the combined layers. Consequently, the combined Cu/Ni deposits on the pore walls and bottoms deteriorate due to the potential difference between the composing Cu and Ni. Hence, according to the standard potentials [83], Ni is more active than Cu (Eqs. 3–5):
Therefore, in the Cu/Ni redox couple, the copper will oxidize nickel, resulting in the following overall reaction:
In the present case, the combined AAO-Cu/Ni layers suffer partial destruction, by dissolution of the Ni-domains, promoted by the occurrence of Cu, as an oxidant. This assumption provides the most probable explication for the sharp C(OL+edl) rise after 720 hours of exposure, corresponding to the decay of the capacitive resistance of the respective combined AAO-Cu/Ni layer.
The comparison of the EIS data acquired after 24 and 720 hours of exposure (Tables 2 and 3) reveal that R(OL+edl) of the AAO-Ni layers decays with four entire orders of magnitude. The most probable reason is the much lower adhesion of the incorporated Ni films to the pore walls and bottoms. Probably, the decomposition of the Ni-complex compounds has an additional effect to this decay. The acquired EIS data cannot uphold any alternative explications, since Cu is a stronger oxidant than Ni, in respect to Al. However, the AAO-Cu films show insignificant C(OL+edl) and R(OL+edl) alterations, compared to those of the AAO-Ni films.
Consequently, the Ni deposits form thicker films with lower adhesion to the AAO pore walls and bottoms, compared to those of Cu.
In order to obtain a more complete image regarding the electrochemical performance of the obtained samples, during their exposure to 3.5% NaCl solution, additional potentiodynamic scanning curves (PDS) were acquired. The overlapping of the potentiodynamic curves and the almost horizontal anodic branches (Fig. 4a) reveal the complete passivation of the substrate surfaces by the AAO layers. Besides, these curves are positioned well below 10−8 A cm−2, revealing the remarkable suppression of the interaction between the samples and the MCM (i.e. remarkable corrosion supression). Following the concepts, described in the previous sections, the corrosion process is strongly hindered by the Al3+ and O2− charge transfer across the ion transport pathways under the AAO pores. This inference is further confirmed by the PDS curves acquired after 720 hours (Fig. 4b). These curves remain at the same current densities as the initial ones, revealing that the interaction between the MCM and the AAO covered specimens is quasi-stationary and that corrosion proceeds with an insignificant rate. In addition, the incorporated Cu and/or Ni do not contribute to the formed films of corrosion protective properties of the AAO layers, since the PDS curves of all the investigated specimens are situated at similar corrosion current densities. Finally, comparing positions (a) and (b) of Fig. 4, it could be concluded that at the initial 24 hours of exposure the thin AAO-Cu and AAO-Cu/Ni layers possess slightly enhanced barrier ability (i.e. lower current densities), compared to this of the AAO references, due to the thin layers deposited on the pore walls and bottoms. At the beginning of the exposure these layers interrupt the ion transport pathways. However, after 720 hours of exposure, the respective PDS curves overlap with the one of the reference samples, suggesting that the additional Cu and Cu/Ni layers have already lost their supplemental effect to the basic AAO layer barrier properties.
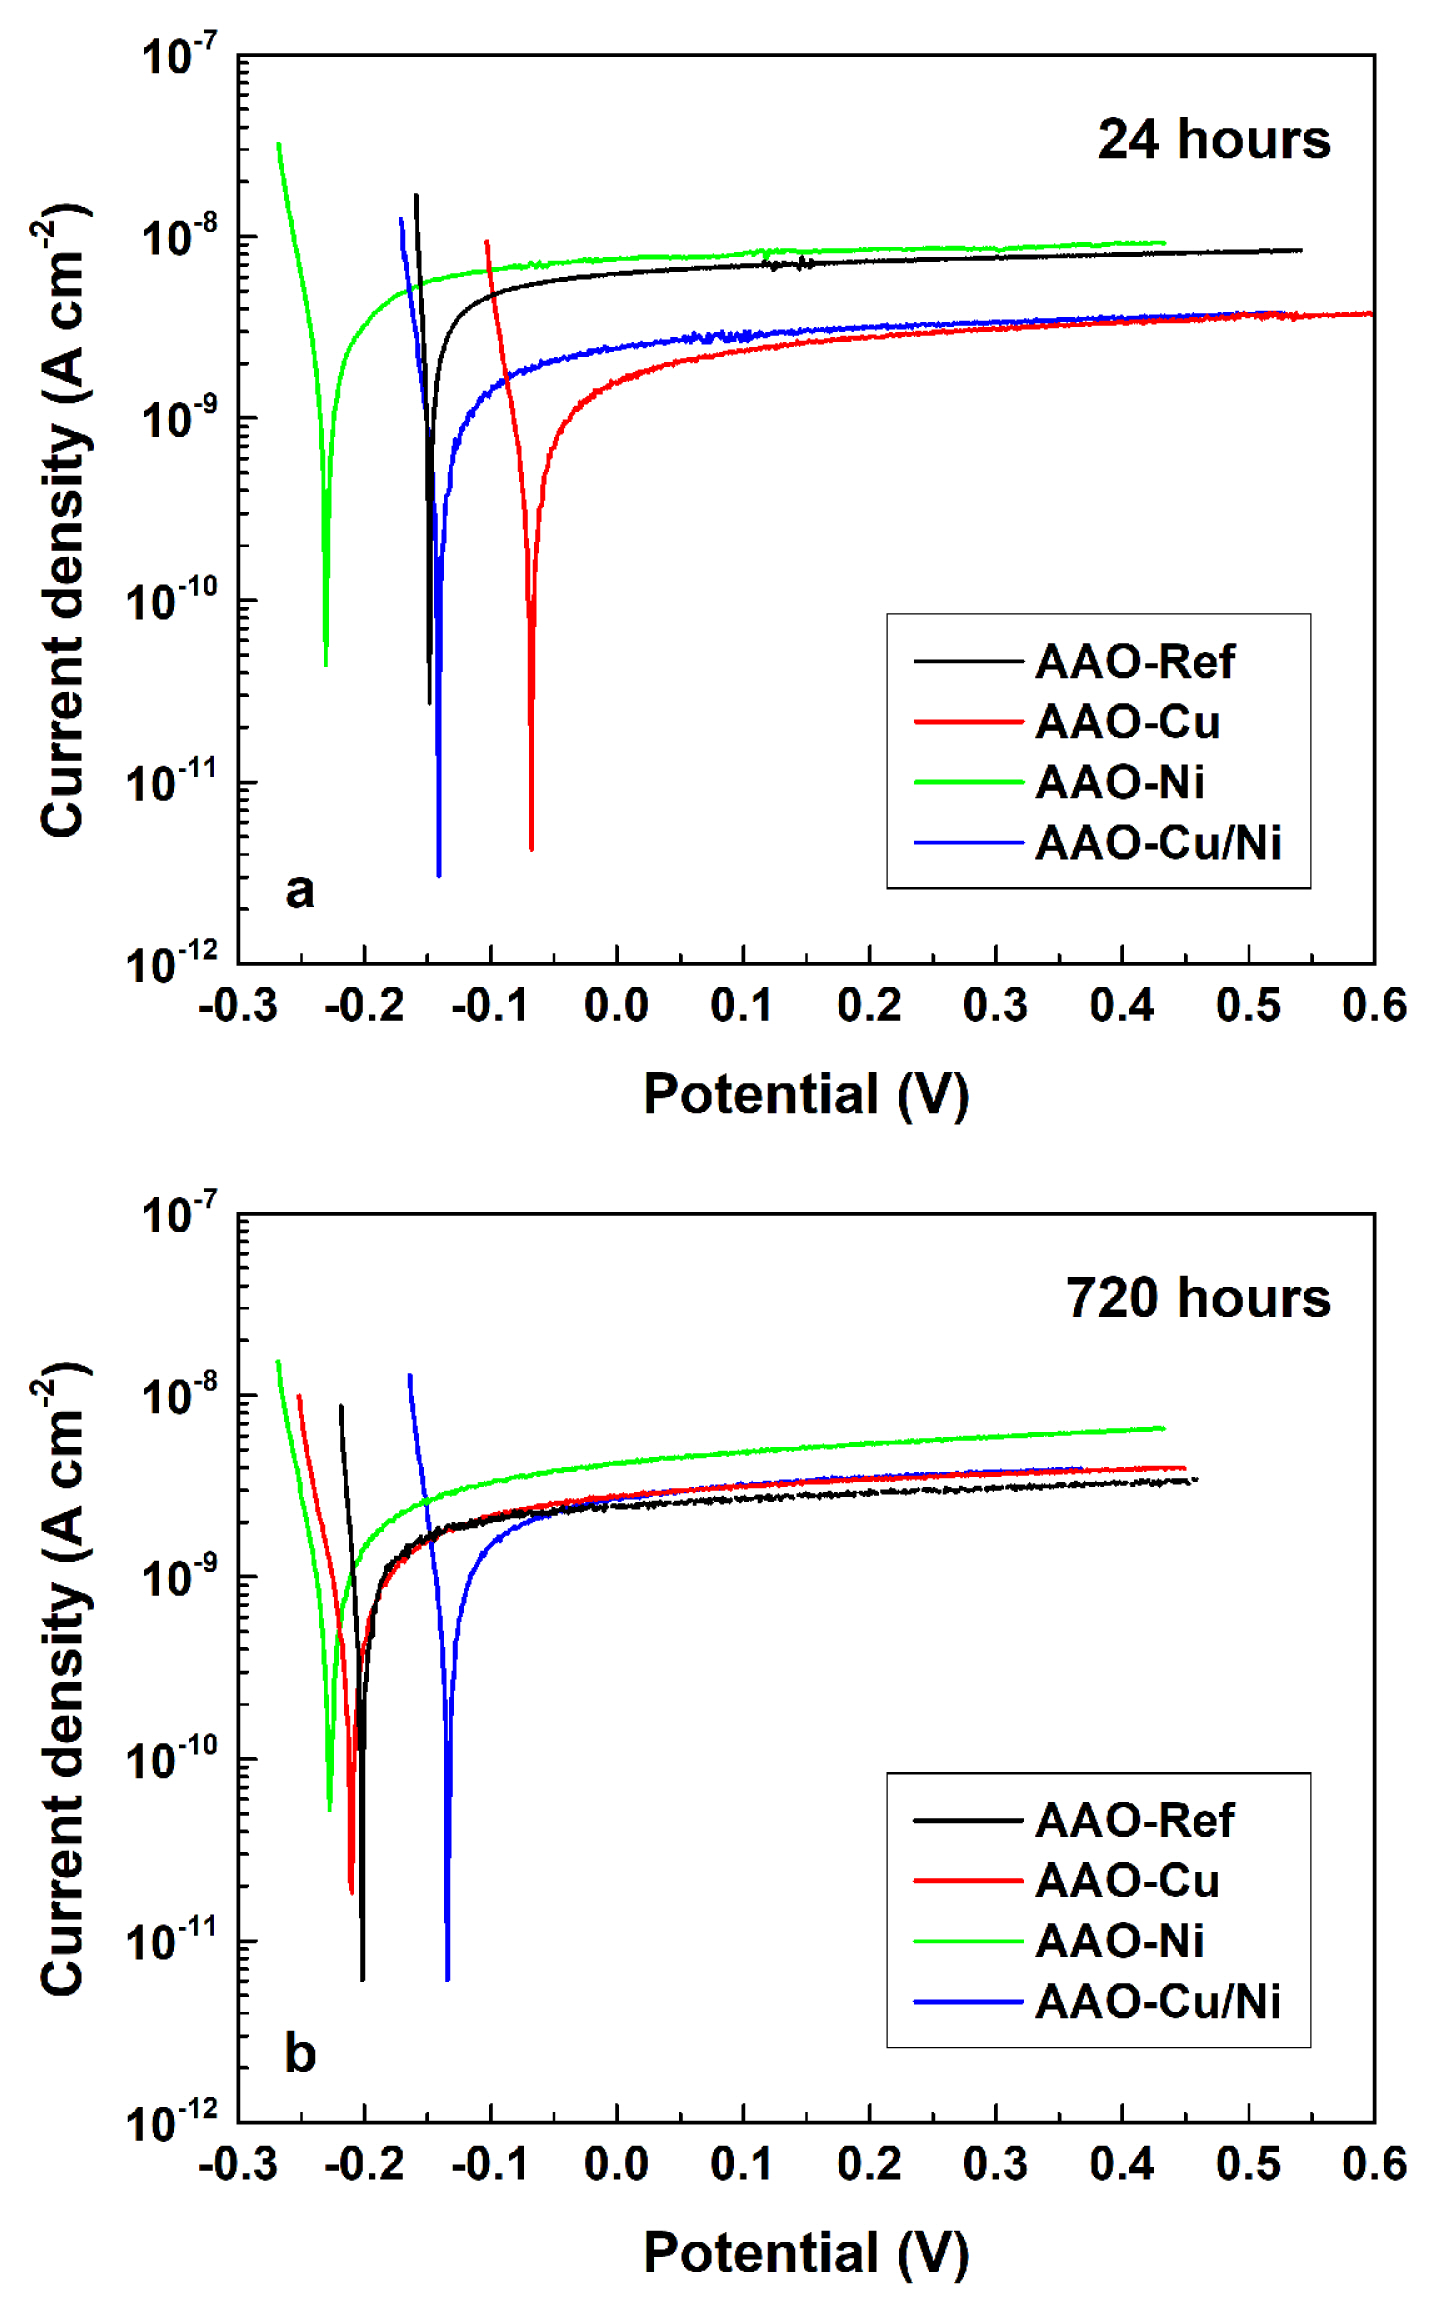
Averaged anodic PDS curves acquired after 24 (a) and 720 (b) hours of exposure.
For comparison, the PDS curves of the AAO-Ni layers remain above all others (i.e. at higher current densities) for the entire exposure period. The most probable reason is the higher chemical activity of this element, compared to that of copper. This statement is confirmed by the more negative Ecorr potentials of the AAO-Ni samples. In contrast, copper possesses cathodic nature, compared to the other elements. It is rather noticeable by the more positive Ecorr values, detected after the initial 24 hours of exposure. However, after 720 hours, the PDS curve of the AAO-Cu has approached the others, revealing a shift towards more negative values. Only the AAO-Ni layer has shown a shift in the opposite direction. This exclusion can be explained with the variety of possible oxidation states of the Ni compounds [84]. This variety enables various transitions among the respective oxidation states of this element during the long-term corrosion test. Indeed, the exposure of the already formed Ni containing layers on the AAO pore surfaces to the corrosive medium species (e.g. Na+, Cl−, OH−, H3O+, dissolved O2, etc.) predetermines a multitude of possible chemical interactions between this layer and the corrosive medium.

Numerical data obtained from the PDS curves acquired after 24 and 720 hours of exposure
Besides, all depositions were performed by means of AC-polarization. The shift in reduction (during the negative semi-periods) and oxidation (during the positive semi-periods) conditions and vice versa result in the simultaneous formation of: Cu0 ↔ CuI ↔ CuII and/or Ni0 ↔ NiI ↔ NiII ↔ NiIII ↔ NiIV deposits. The constant interactions of the formed Cu and/or Ni layers with the components of the corrosive medium, result in continuous Ecorr dissipations, but do not affect the protective properties of the AAO layer.
The weak increase of the Rp values after 720 hours of exposure to MCM can be explained, considering obstruction of the pore bottoms of the AAO layers by Keggin-like corrosion products [85].
3.2. Morphological observations and compositional characterizations
Supposing the existence of a direct correlation between the electrochemical performance of the investigated samples and their morphology, additional topological observations were performed by means of scanning electron microscopy (SEM).
The SEM images (Fig. 5) have confirmed the inferences from the previous paragraphs, since Cu and Ni deposition did not result in modification of the AAO morphology. At the applied magnification, the AAO pores are indistinguishable. The morphologies of the anodized samples resemble the observed Al-surfaces after the preliminary etching and acidic activation. The low-resolution images reveal laminar morphologies, resulting from the alloy rolling as a final production stage. The high-resolution images show multitude of shallow concavities with various diameters. These craters are a result of the preliminary alkaline and acidic treatment procedures. In addition, randomly spread coarse intermetallic inclusions or cavities can also be distinguished. These cavities result from already dissolved intermetallic phases. In some images (Fig. 5b, c, g, h), the intermetallic inclusions or their cavities are beneath the craters, evincing that the intermetallic precipitates are also spread in depth, occupying the entire alloy bulk. The simultaneous occurrence of intermetallic phases and concavities from already dissolved inclusions reveals that the AA1050 alloy contains both types of more active (e.g. Mg, Zn, etc.) and nobler (e.g. Cu, Fe, Mn, Si, Ti, V, etc.) phases, so that the preliminary treatments cause dissolution of the formers.
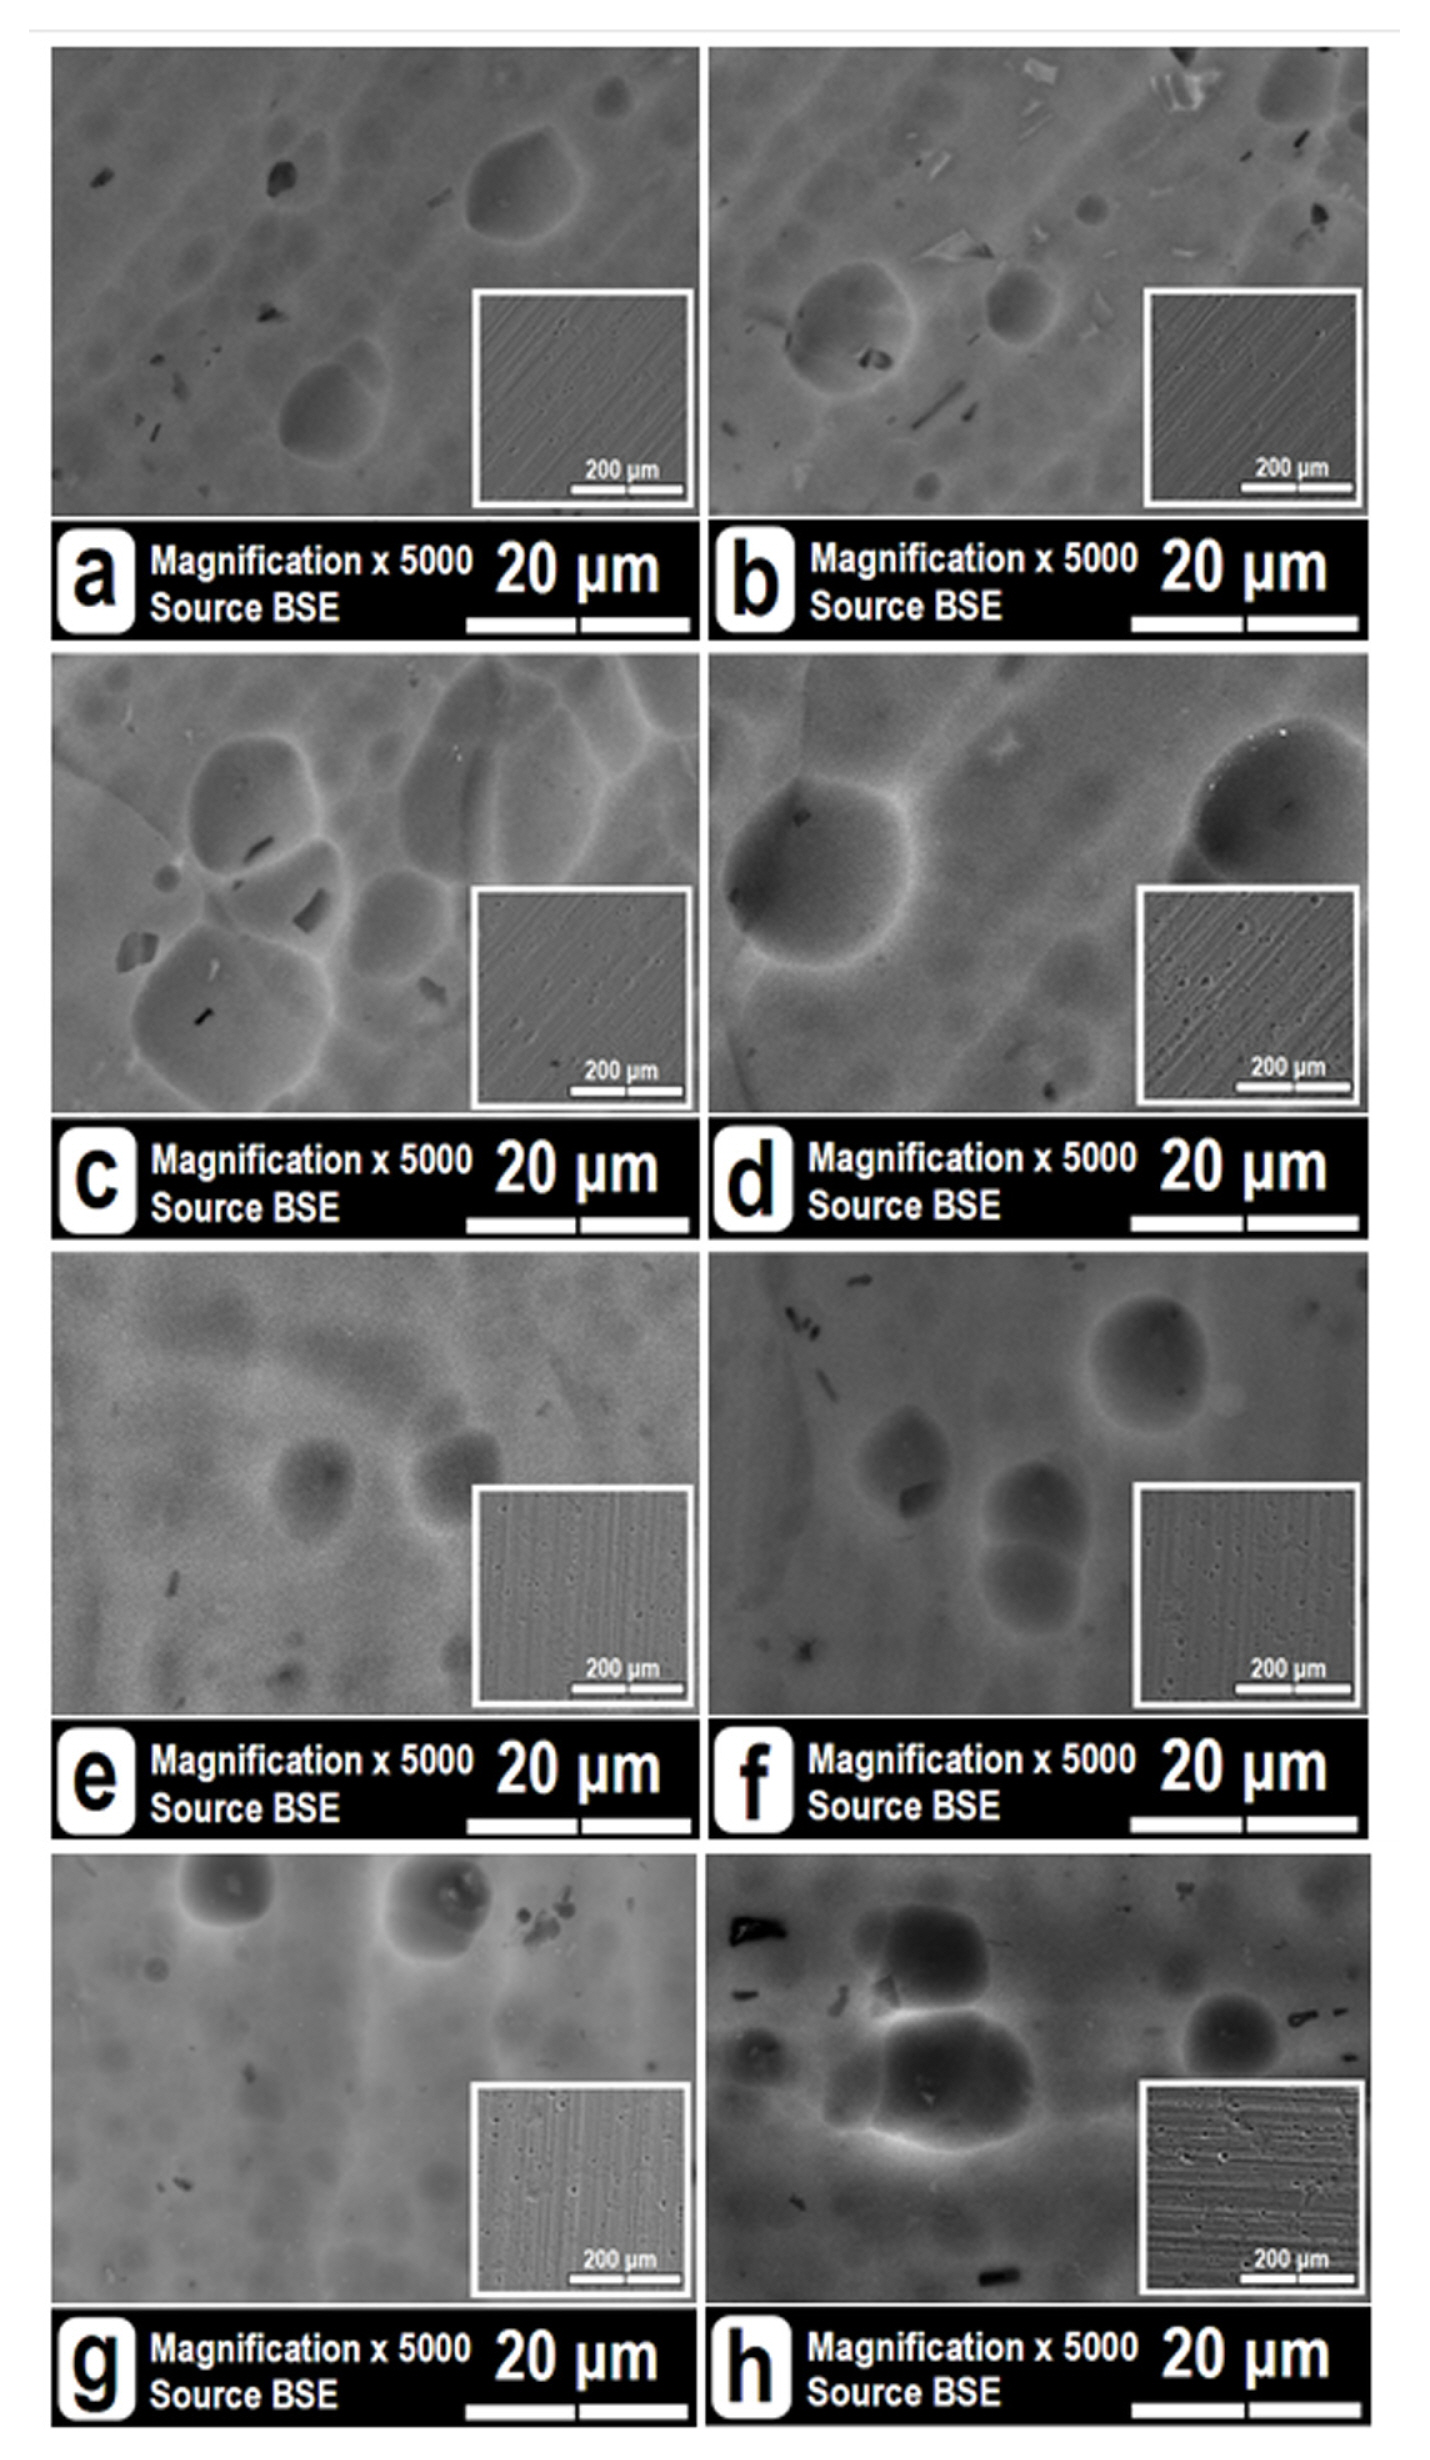
High- and low-resolution SEM images of the investigated samples: (a) AAO-Ref(1); (b) AAO-Ref(2); (c) AAO-Cu(1); (d) AAO-Cu(2); (e) AAO-Ni(1); (f) AAO-Ni(2); (g) AAO-Cu/Ni (1) and (h) AAO-Cu/Ni(2).
Considering a direct relation between the chemical composition of the film and the resulting performance in the model corrosive medium, all samples were submitted to chemical analysis by means of different X-ray techniques.
The energy dispersion X-ray (EDX) maps analyses have shown that all elements composing the oxide layer are equally distributed on the whole surface of the respective samples, following its topology (Fig. 6).

EDX map analyses of the element distribution in the reference and in the modified AAO layers
The subsequent quantitative EDX point analyses have provided much more information on the exact content of the elements, composing the reference and the modified AAO layers. All data, acquired by the EDX point analyses are summarized in Table 5. In order to collect more interesting data, the reference samples were not submitted to quantitative analyses, but both samples of the biggest interest, namely the combined AAO-Cu/Ni coatings, were submitted to these measurements in triplicate.

Quantitative data acquired by EDX point analyses of the investigated samples
The analysis of the quantitative data reveal that the composition of the AAO layer in all cases is close the stoichiometric Al2O3, approaching 40 at. % Al and 60 at. % O. This finding suggests that the anodic oxide layers are composed of pure alumina, without any occurrence of boehmite or other Al2O3-xOHx compounds. The relatively lower oxygen content is compensated by incorporated sulfur. This means that part of the oxygen in the AAO layers is substituted by sulfur from the anodization electrolyte (15 wt. % H2SO4), following the well-described mechanism, proposed by Shimizu et al. [86], and confirmed by our previous research work [70]. Probably, namely the incorporated sulfur is one of the reasons for the appearance of point defects in the AAO layers, since this element could exist in different oxidation states (being an electron donor or acceptor). These defects provide electron transport across the dense AAO layer, since this element occurs in different oxidation stages. The transitions between these oxidation states enables sulfur to donate or accept electrons, especially when the sample is polarized. Besides, the average sulfur content does not completely compensate the oxygen deficit in the cases of single Cu and Ni deposition. This deficit can be expressed as the difference between the stoichiometric CO = 60 at. % and the average value (av) measured for both types of coatings COav = 55.62 at. %. Thus, the oxygen deficit is equal to ΔCO = 4.38%, whereas the average value of the involved sulfur is: CSav = 4.28 at. %. Consequently, the sulfur incorporation results in the formation of anionic vacancies. Namely these vacancies could supply the O2− ions transport across the dense part of the AAO layer. The subsequent electrochemical metal deposition has revealed rather low contents of Cu and Ni: around 0.05 at. %, which corresponds to about 0.16 wt. %. This fact reveals that the AC electrochemical metal incorporation results in the equal and low metal deposition rate for both metals.
The most interesting results are these obtained for the combined AAO-Cu/Ni coatings, which imposed the need for triple measurement. This approach enabled the determination of the average values of the incorporated metals: 0.155 at. % for Cu and 0.023 at. % for Ni. The comparison of the data in Table 5 shows that the combined electrochemical deposition from CuII and NiII sulfates results in three times higher Cu and twice lower Ni contents, compared to the single metal incorporations. The twice lower Ni-content in the combined coating, compared to the single metal incorporation (0.05 at. % Ni in the AAO-Ni, compared to 0.02 at. % Ni in the AAO-Cu/Ni) is a result of the twice lower concentration of the used electrolyte (Table 1, experimental section). However, the Cu content is three times higher in the combined AAO-Cu/Ni coating, regardless in the lower CuSO4 concentration in the electrolyte. This correlation between the Cu and Ni contents in the modified AAO layers reveals that the presence of Ni accelerates the Cu deposition, probably following the mechanism, described by Eqs. 3 – 5.
Another interesting fact, which can be observed from Table 5 is that the Al concentration in the combined AAO-Cu/Ni layer (CAlav = 37.47 at. %) is with about 2.53%at lower than the stoichiometric one. The sulfur content is also with about 1 at. % lower in the combined AAO-Cu/Ni coatings, compared to the single metal doped ones. On the contrary, the average oxygen content (COav = 58.83 at. % for AAO-Cu/Ni) of the combined AAO-Cu/Ni layers is by 3.21 at. % higher than those of the single Cu or Ni metal doped AAO layers (i.e. COav = 55.62 at. % for both AAO-Cu and AAO-Ni).
Thus, the EDX point analyses have uncovered that the combined AAO-Cu/Ni coatings possess some differences, compared to the single metal doped AAO-Cu and AAO-Ni coatings. Besides the three times higher Cu and twice lower Ni contents, the combined layers reveal lower contents of Al and S, but higher content of O. The lower Al and S contents of the combined coatings can be explained by their release, caused by dissolution of the S containing Al2O3 surface. This dissolution is induced from the AC-polarization during metal incorporation (Eqs. 1 and 2 ). However, in the present case, all samples presented in Table 5 have undergone metal incorporation.
Consequently, the lower Al and S contents in the combined AAO-Cu/Ni is a result of the relatively thicker Cu/Ni layer, due to the enhanced copper deposition. This layer covers the entire AAO pore walls and bottoms and the point defects of incorporated sulfur, resulting in weaker Al and S detection X-ray signals.
Finally, the higher oxygen content, observed for the combined AAO-Cu/Ni layers is a result of the partial oxidation, at the oxidant conditions during the negative AC semi-periods. Indeed, the thicker Cu/Ni layers, require higher oxygen amounts from the electrolyte for their oxidation.
The exact chemical composition, including the oxidation states of the involved elements requires a more precise analytical technique, such as X-ray photoelectron spectroscopy (XPS) analysis. The quantitative results of the respective XPS analyses in Table 6 confirm the above commented results from the EDX analyses, revealing that the main components of the AAO layers (i.e. Al and O) approach the ratio of (Al:O ≈ 2:3).

Element contents of the investigated samples determined by XPS
The relatively lower Al and O contents are result of the occurrence of Fe, Zn and Cr, which are inherent for the AA1050 substrate. The composition of the samples of each pair are identical, revealing that the electrochemical deposition proceeds with obvious repeatability in all investigated cases. The data analyses of the XPS spectra also confirm the low efficiency of the deposition process, since both Cu and Ni contents are rather lower than this of incorporated S. The trends of rather higher Cu and twice lower Ni contents in the combined AAO-Cu/Ni layers, compared to the single metal containing ones confirm the inferences made from the EDX analyses.
In addition, the acquired O1s spectra in Fig. 7a show that in all cases the oxygen peak is positioned at 531.6 eV. This peak is an indication for the Al-O chemical bonding, composing the AAO layer matrices [87,88]. This fact is an undoubted evidence for the complete coverage of the surface with Al2O3 layers. The wide asymmetrical Al2p peak at 74.1 eV, in Figure 7b also evinces that aluminum is in oxidized form [89–91].

O1s and Al2p spectra of the investigated films.
Fig. 8a summarizes the Cu2p spectra of all copper containing samples. It shows that these spectra, acquired at 20 eV, for both Cu and Ni doped AAO layers possess very low intensity, due to the rather low concentrations of the electrochemically deposited metals.
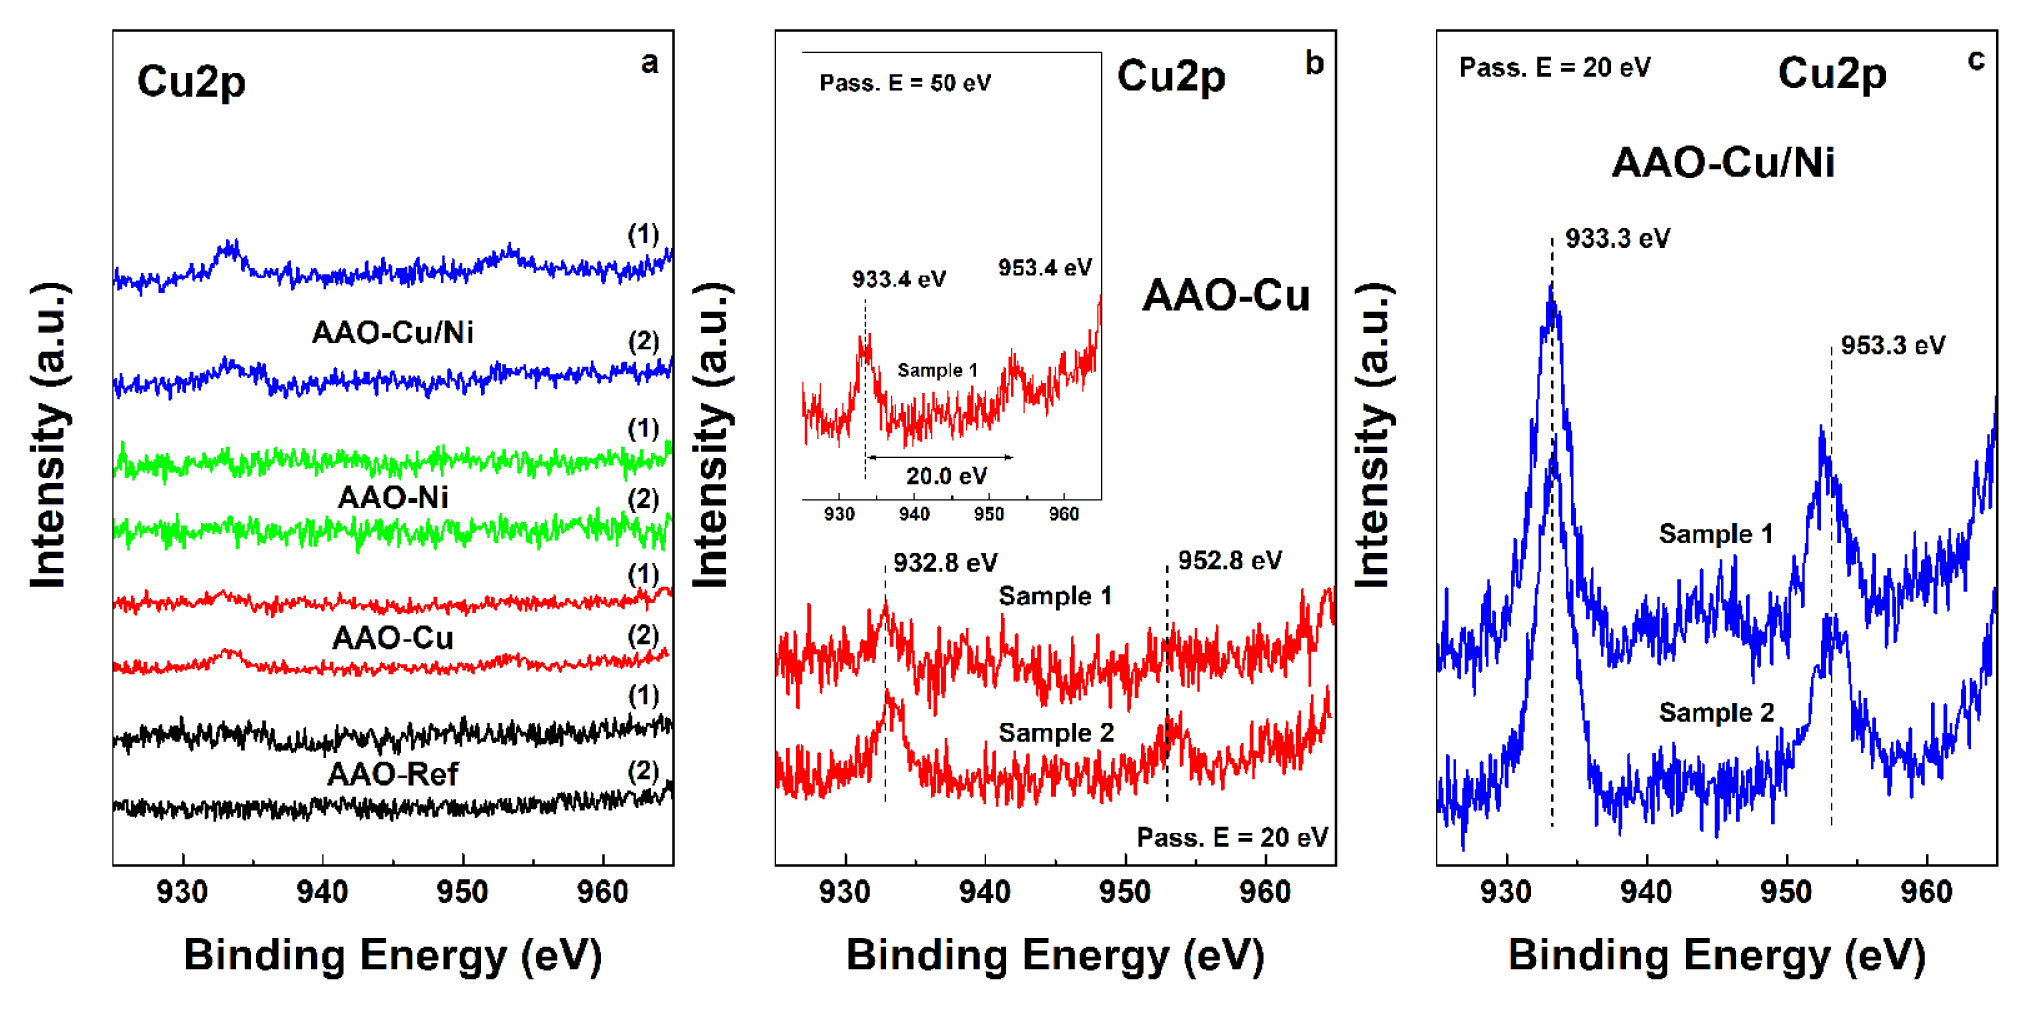
Basic and deconvoluted Cu2p spectra of the investigated samples.
The detailed Cu2p spectra of both AAO-Cu films are shown in Fig. 8b. It shows that the acquired spectra have rather low intensity and with remarkable noise, which imposes serious difficulties for the determination of the oxidation state of this element in the AAO-Cu doped films. The spectra, obtained at 20 eV show that the Cu2p3/2 peak is situated at 932.8 or 933.4 eV, whereas the Cu2p1/2 is at 952.8 or 953.4 eV, revealing spin-orbital splitting of 20.0 eV in both cases. A weak double satellite, indicative for Cu1+ was detected at 944 eV for one of the AAO-Cu samples, whereas the other one showed intensive satellites, typical for CuO and Cu(OH)2. Nevertheless, both Cu-doped samples revealed a shoulder at 933.4 eV, which according to Biesinger et al. [92] is inherent for the Cu2+ oxidation state. In general, the spectra of the AAO-Cu doped films showed simultaneous occurrence of Cu0, Cu1+ and Cu2+, in different proportions for each sample. Further, Figure 8c shows the deconvoluted spectra of the combined AAO-Cu/Ni layers, acquired at 50 eV. These spectra also reveal the coincident occurrence of Cu0, Cu1+ and Cu2+ in miscellaneous mixtures with different contents.
The acquired Ni2p spectra also possess low intensity and high signal noise, like the described above Cu2p spectra. Consequently, nickel content is as low as the copper one. This fact again imposed to acquire detailed spectra at 50 eV. The deconvolutions of AAO-Ni and AAO-Cu/Ni spectra were performed following Grosvenor [93] and Biesinger [94], and are shown in Fig. 9.
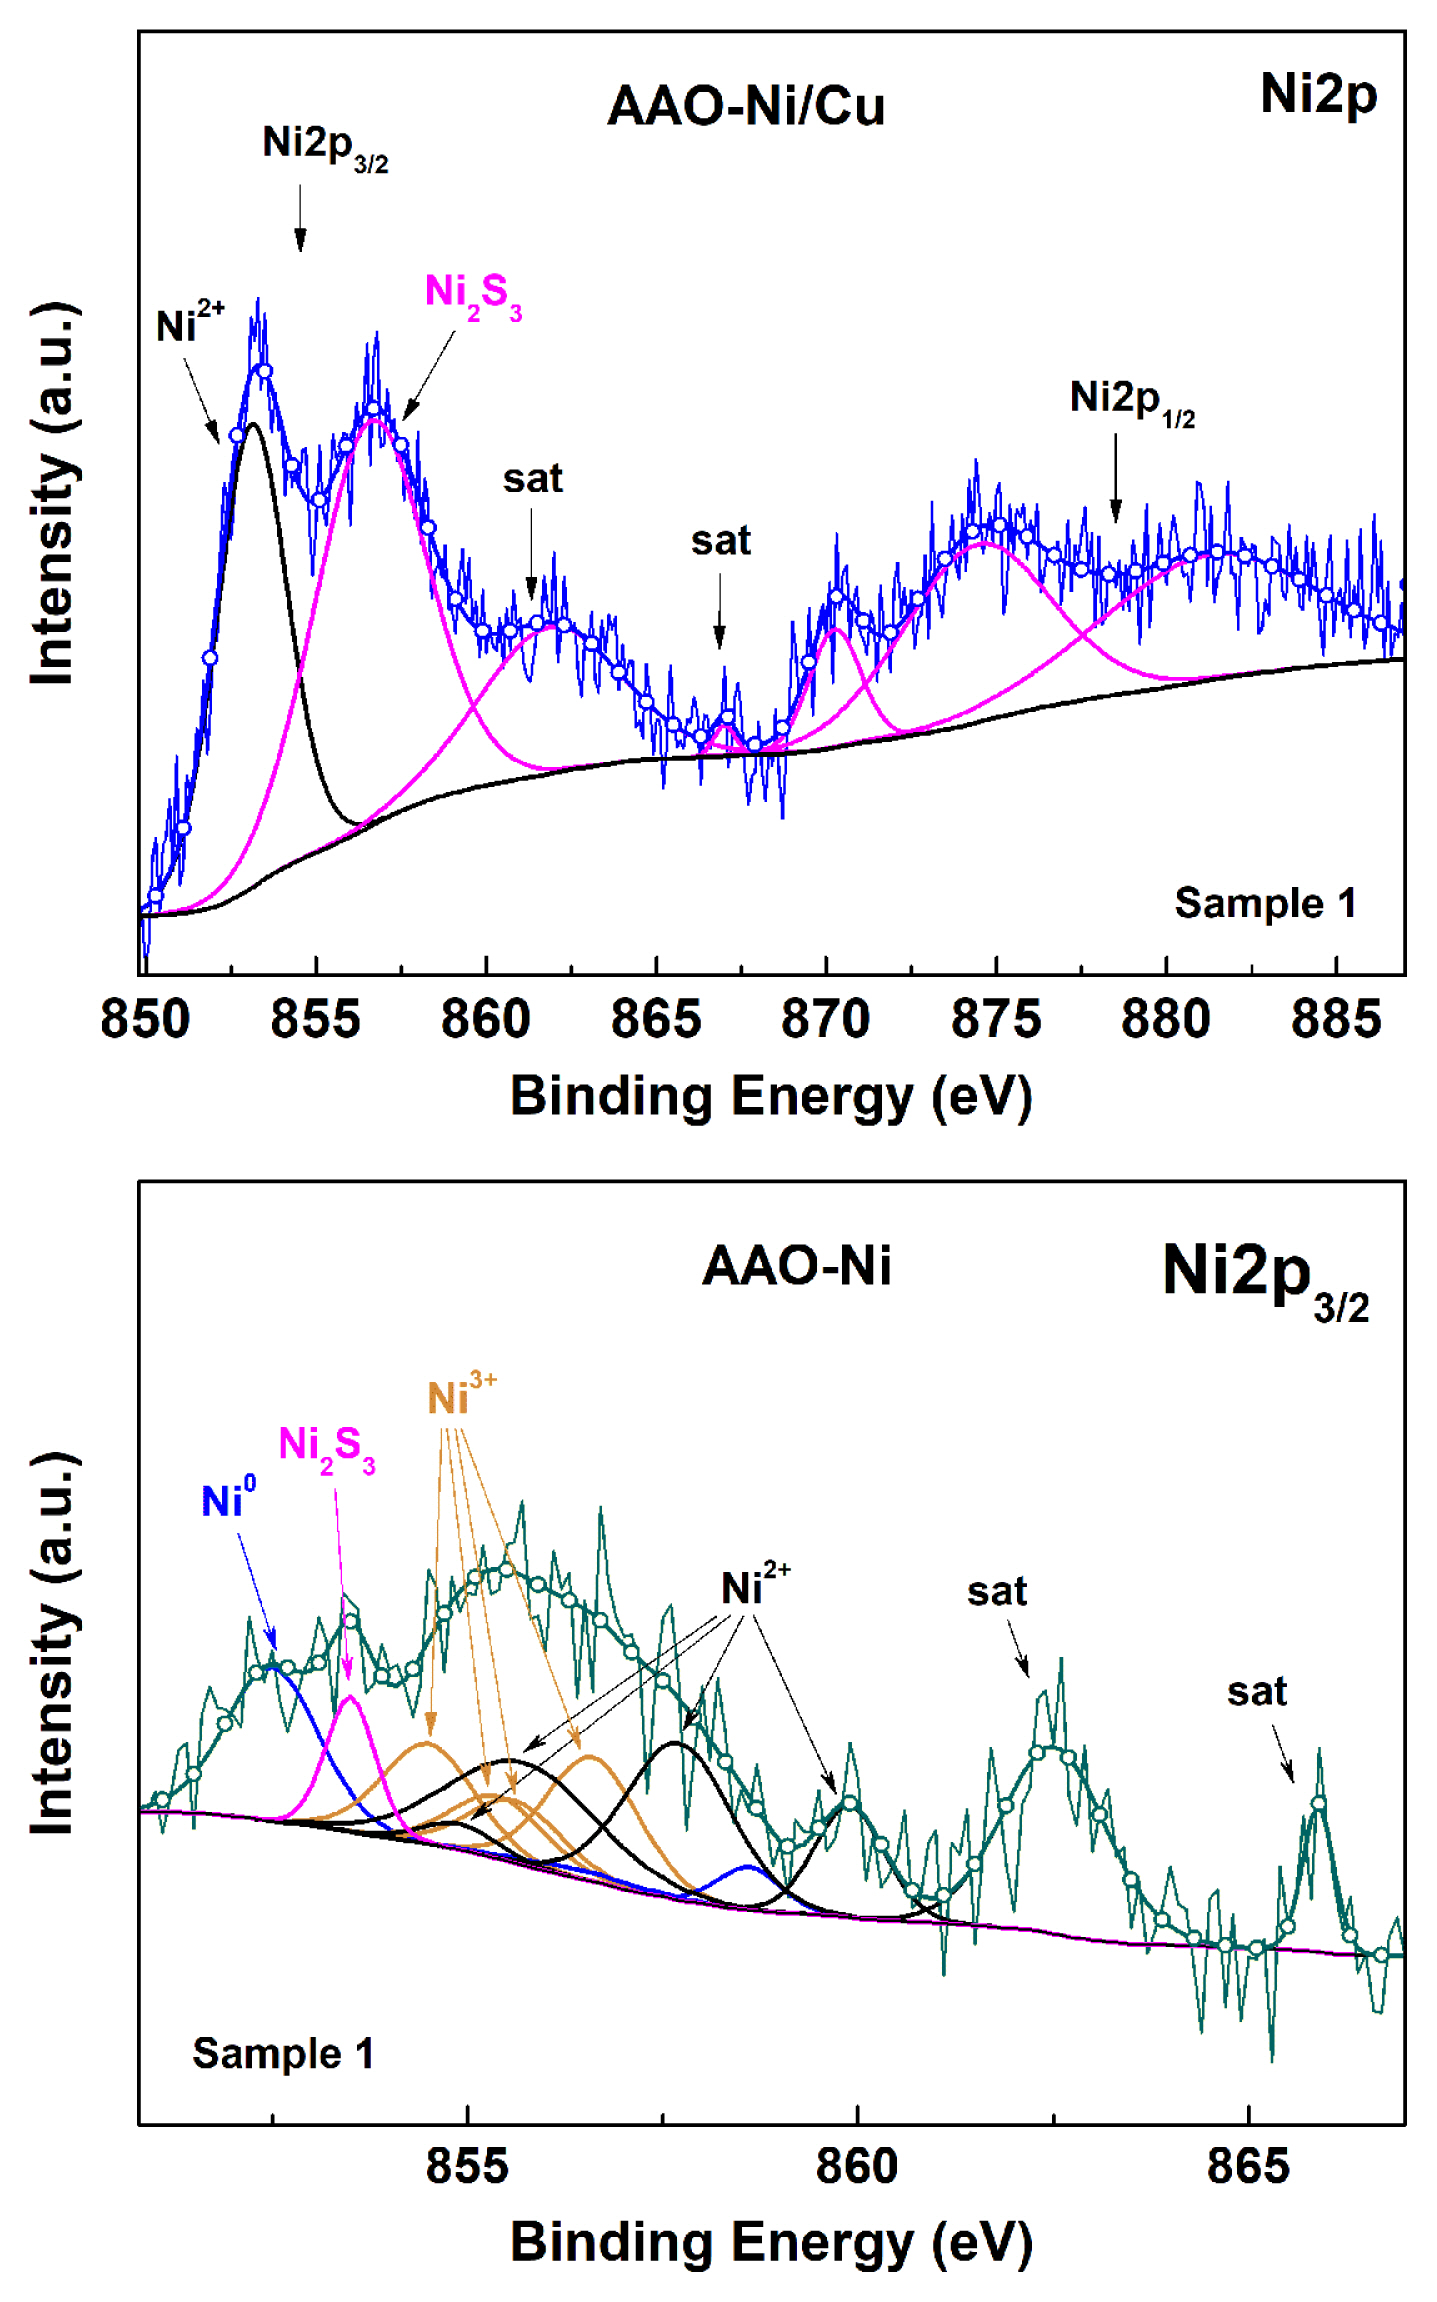
Deconvoluted Ni2p spectra of the investigated samples.
The Ni2p spectrum is rather complex, since it is composed of a multitude of peaks and satellites, due to the considerable variety of possible electron transitions. For instance, the assignment of Ni2p3/2 spectra to Ni oxides and other compounds is based on charge transfer assignments of the main peak (at 854.6 eV in NiO) and the broad satellite (centered at ~ 861 eV in NiO) to the cd9L and the unscreened cd8 final-state configurations, respectively (L is a ligand hole) [95,96].
The splitting of the Ni2p3/2 spectra of the AAO-Ni samples and the definition of the peak positions and half-widths for the respective oxidized states of Ni were performed following strictly the works of Biesinger et al. [92–94], using Casa XPS software, avoiding the use of offset. The analyzed spectrum contained two distinguishable satellites at 862.4 and 865.9 eV, respectively. These satellites are typical for the Ni2p3/2 spectrum of β-NiOOH fitted with Ni(II) and Ni(III) multiplet envelops [93]. That was the reason to perform specific deconvolution for this compound. As a result, the positions of the characteristic peaks for Ni2p3/2 Beta Ni3+OOH, situated respectively at: 854.6, 855.3, 855.7 and 856.5 eV, as well as those for Ni2p3/2 Beta Ni2+OOH, positioned at: 854.9, 855.7, 857.7 and 860.5 eV, as well as their satellites were defined. The analysis has shown that the ratio between Ni(III) and Ni(II) is 34 %:44 %, approaching 1:1. Consequently, the electrodeposited nickel forms simultaneously various oxides and hydroxides. In addition, peaks typical for metallic Ni0 and Ni2S3 [97–99] were also registered at 852.6 eV and at 853.5 eV, respectively. Furthermore, the Ni2p spectra of the combined AAO-Cu/Ni layers contain supplemental peaks, at 853.1 eV and at 856.6 eV, with additional shake-up satellites which are characteristic for Ni2+ and Ni3S2 [97]. Both shake-up satellites originated from the deconvolution, were joined in a wider peak at 861.9 eV. The valence states of nickel ions in Ni3S2 are mostly Ni+ and partially Ni2+. Therefore, the Ni2p3/2 line appears at 853.1 eV, indicating the presence of divalent Ni species, as was established by Park et al. [97]. The correlation between the areas of the peaks of Ni2+:Ni3S2 is approximately 1:2 (i.e. the area of the Ni2+ peak is 2356, whereas this of the Ni3S2-peaks is about 4745).
Finally, from the analysis of the XPS spectra of all the investigated samples, it can be concluded that all the elements, composing the doped AAO layers are in oxidized form. The AC electrochemical metal incorporation has resulted in the formation of oxides and hydroxides in all possible oxidation states of Cu and Ni. The AAO-Cu layers contain basically Cu0, Cu1+ and Cu2+ ions, whereas the combined AAO-Cu/Ni films have shown predominance of Cu0 and Cu1+, and only traces of Cu2+. This fact confirms again the inferences made, regarding the appearance of a redox couple, which results in the reduction of the copper deposits in presence of Ni, demonstrated by Eqs. 3 – 5. The AC nickel incorporation has resulted in coincidence of the three Ni0, Ni2+, Ni3+ oxidation states, including Ni3S2. This sulfide was the predominant compound in the combined AAO-Cu/Ni layers.
4. Conclusions
The present systematic study comprises the results of the comparative analyses performed on porous reference and modified AAO layers. The modifications were performed by means of AC-electrochemical Cu and/or Ni incorporation. Considering the wide potential application field of these films, it was important to establish their durability in corrosive media. For that purpose, electrochemical measurements were performed in duplicate after 24 and 720 hours of exposure to a 3.5% NaCl solution, resembling seawater. This approach has enabled to obtain reliable data for both the barrier ability and durability of the obtained films. The acquired EIS spectra reveal almost perfect overlapping of each sample couple from the respective groups and indistinguishable deviations between the respective sample groups. All EIS spectra were further analyzed by fitting them to a suitable simplified model equivalent circuit.
The spectra, acquired after the initial 24 hours of exposure have shown definitely capacitive character of all investigated samples, due to the contribution of the basic AAO matrix. In addition, the analyses of the EIS spectra have shown that the incorporated Cu and/or Ni deposits on the AAO pore walls and bottoms are rather thin, evinced from the low efficiency of the deposition process. These metal deposits are also porous (or at least rather defective) and do not contribute to the dielectric properties of the basic AAO layer.
After 720 hours of exposure, no distinguishable changes in the spectra were registered, revealing the considerable durability of all the investigated films. The references did not show notable changes in their spectra, revealing that corrosion proceeds as a quasi-stationary process and does not change the properties of the AAO matrices. In the case of Cu-deposition, the resulting deposits do not have any protective properties, whereas Ni films had lost their protective abilities (detected at the beginning of the exposure), probably due to detaching from the basic oxide surface. Consequently, the Ni deposits form thicker films with lower adhesion to the AAO pore walls and bottoms, compared to the Cu ones. In the case of combined AAO-Cu/Ni layers, their deterioration is obviously caused by electrochemical interactions between the composing elements (i.e. Cu and Ni).
The PDS curves confirmed the inferences made for the EIS measurements. The PDS results have revealed the exceptional barrier ability and durability of the AAO matrices and the insignificant contribution of the Cu/Ni deposits, evinced from the rather low current densities and the almost horizontal anodic branches. Initially, the Ecorr values of the respective PDS curves reveal some differences (due to the more active Ni and the nobler Cu). These differences disappear after 720 hours of exposure. Their disappearance is a result of the complete extension of the insignificant contribution of the Cu and/or Ni thin films to the barrier properties of the basic AAO matrices.
The SEM images have confirmed the assumption for the deposition of very thin Cu/Ni layers inside the AAO pores, since no change in the surface morphology was observed after the respective electrochemical metal deposition.
The EDX analyses have revealed that all the elements composing the modified AAO layers are completely equally distributed on the entire surface of the samples. Besides, the quantitative EDX point analyses have revealed several basic differences among the coating types: (i) The AAO layers are composed of almost pure Al2O3, where part of the oxygen is partially substituted with sulfur; (ii) The AC incorporations of single metals (Cu and Ni) result in the equal deposition of very low amounts of the respective metal; (iii) In the combined AAO-Cu/Ni coatings, the Cu content is three times higher, whereas the Ni one is twice lower, compared to the layers incorporated with a single metal; (iv) The contents of Al and S look lower in the case of the combined layers, compared to the rest, due to their coverage by thicker Cu/Ni mixed films on the AAO pores walls and bottoms. Besides, the higher oxygen content of the modified AAO layers reveals that the deposited Cu and Ni are in oxide forms.
The XPS spectra of all the investigated samples, have also shown that all elements, composing the modified AAO layers are in oxidized form (i.e. oxides and hydroxides in all possible oxidation states of Cu and Ni). The AAO-Cu layers contain basically Cu0, Cu1+ and Cu2+ ions. In the case of AAO-Ni layers the incorporated metal was in the three Ni0, Ni2+, Ni3+ oxidation states, including Ni3S2. Finally, the combined AAO-Cu/Ni films have shown predominance of Cuo and Cu1+, and only traces of Cu2+, whereas the nickel was basically in form of Ni3S2.
Acknowledgement
The authors would like to express their gratitude to the Bulgarian National Scientific Fund for the financial support under contract No. KΠ-06-M 38/1 (2019).