1. Introduction
Direct borohydride fuel cell (DBFC), as one of the best power sources, has been widely considered [1–6] due to some of its unique properties such as high hydrogen content (10.6 wt. %) [7,8], environmental friendliness [9,10], and high open circuit potential as well as high energy density [11].
A complete borohydride oxidation generates 8 electrons, as presented in Eq. (1). However, it is well known that a complete borohydride oxidation is barely found to occur in practice, and an incomplete borohydride oxidation (Eq. 2) and its hydrolysis (Eqs. 3, 4) reduce the efficiency of the fuel cell [12–13]. Therefore, the study and development of the low cost electrocatalysts that can promote a complete oxidation of borohydride is an interesting and important subject.
Different transition metals including Pt [14–17], Ag [16–19], Au [19–22], Pd [23,24], Os [25], Ni [26,27], Cu [28], and Zn [29] have been considered as the potential electrocatalysts for borohydride oxidation. Palladium, abundantly used as an electrocatalyst for borohydride oxidation, is active for borohydride electro-oxidation as well as its hydrolysis [26,30]. It has been reported that at a low concentration of borohydride, a large anodic current along with a high charge efficiency is obtained on the Pd electrocatalyst [26,30]. In order to reduce the high cost of electrocatalysts containing noble metals, bimetallic catalysts have been considered as the potential alternatives. In this regard, the first-row transition metals with unoccupied 3d orbitals (Ni, Cu, Fe, Co, and Zn) have been proposed for a possible enhancement in the electrocatalytic activity for borohydride oxidation [31]. Duan et al. [31] prepared carbon-supported Cu-Pd nanoparticles and used them for borohydride-hydrogen oxidation. They reported that a Cu1Pd1/C sample had higher catalytic activity compared to the other prepared catalysts [31]. Martins et al. prepared a series of bimetallic palladium alloys (PdFe, PdAg, PdAu) on the reduced graphene oxide (rGO) and tested them for the oxidation of borohydride [32]. The best performance was observed for the PdAu/ rGO sample, with the number of exchanged electrons equal to 5.5 [32]. The Bimetallic Pd-Cu/C catalyst samples with different compositions were tested for the oxidation of borohydride by Behmenyar et al. [33]. Their results revealed that the bimetallic Pd-Cu samples were better electrocatalysts than the pure nano-sized Pd electrocatalyst [33]. Zhiani et al. [34] used a new Ni-Co/C catalyst decorated with Pd particles for borohydride oxidation. They observed that while this catalyst was more reactive than the conventional 10.0 wt.% Pt/C catalyst, its tolerance against poisoning by intermediate products produced during borohydride oxidation was lower [34].
The probable synergistic effects of Ni and Pd compositions create some novel catalytic properties for bimetallic NiPd catalysts that are different from pure Pd and Ni catalysts. The NiPd electrocatalysts have been widely employed for electro-oxidation of alcohols as well as reduction of oxygen [35]. However, studies carried out on the NiPd catalysts for borohydride oxidation are not so much. For example, Hosseini et al. prepared the Ni/NiPd samples by the electrodeposition process followed by the galvanic replacement technique [36]. They used the prepared samples for the oxidation of borohydride, and their results demonstrated the porous structure of Ni/PdNi coatings with discrete Pd nanoparticles. In addition, the observed anodic peak current density was up to eight times higher on a Ni/PdNi sample than a pure palladium sample [36].
In this work, the low Ni content bimetallic NiPd films were prepared using the double potential step electrodeposition method. The electrodeposited films were characterized by the energy dispersive X-ray (EDX) and field emission-scanning electron microscopy (FE-SEM) analyses. The oxidation of borohydride was investigated by cyclic voltammetry, rotating disk electrode, chronoamperometry, and electrochemical impedance spectroscopy.
2. Experimental
All the reagents used were Merck products and of analytical grade. Ultrapure water was used for the preparation of all aqueous solutions. The glassy carbon rods (diameter = 3 mm) were employed as a substrate for the electrodeposition of the samples. Before each experiment, the surface of the glassy carbon rods was polished with the emery papers of No’s 2000, 2500, and 3000 and washed with distilled water, and then the rods were immersed immediately in the electrodeposition bath. The electrodeposition bath contained Na2SO4 (0.10 M) and different concentrations of NiSO4+PdCl2, as presented in Table 1. The bimetallic NiPd samples (labelled as NiPd-1 to NiPd-5) and Pd sample were prepared using two potential steps. The nucleation potential of −0.95 V for 1 s, and growth potential of −0.6 V for 600 s were applied to the electrode. All the electrochemical experiments were done at room temperature in a standard three-electrode cell. A glass frit Ag/AgCl electrode and a platinum plate (1 cm2) were used as the reference and counter electrodes, respectively. The electrodeposited samples were employed as the working electrodes for the borohydride oxidation in NaOH solution (1.0 M). The cyclic voltammograms, chronoamperograms, and rotating disk electrode experiments were recorded by an Ivium Stat Potentiostat/Galvanostat, model Vertex (Netherland). The electrochemical impedance measurements were performed using an Origaflex Potentiostat/Galvanostat model OGF500 (France) in the frequency range of 100 kHz-20 mHz and an AC amplitude of 10 mV. The EDX, and FE-SEM analyses were carried out by means of a TESCAN FE-SEM microscope, model MIRA3 (Czech).
3. Results and Discussion
3.1. FE-SEM and EDX analyses
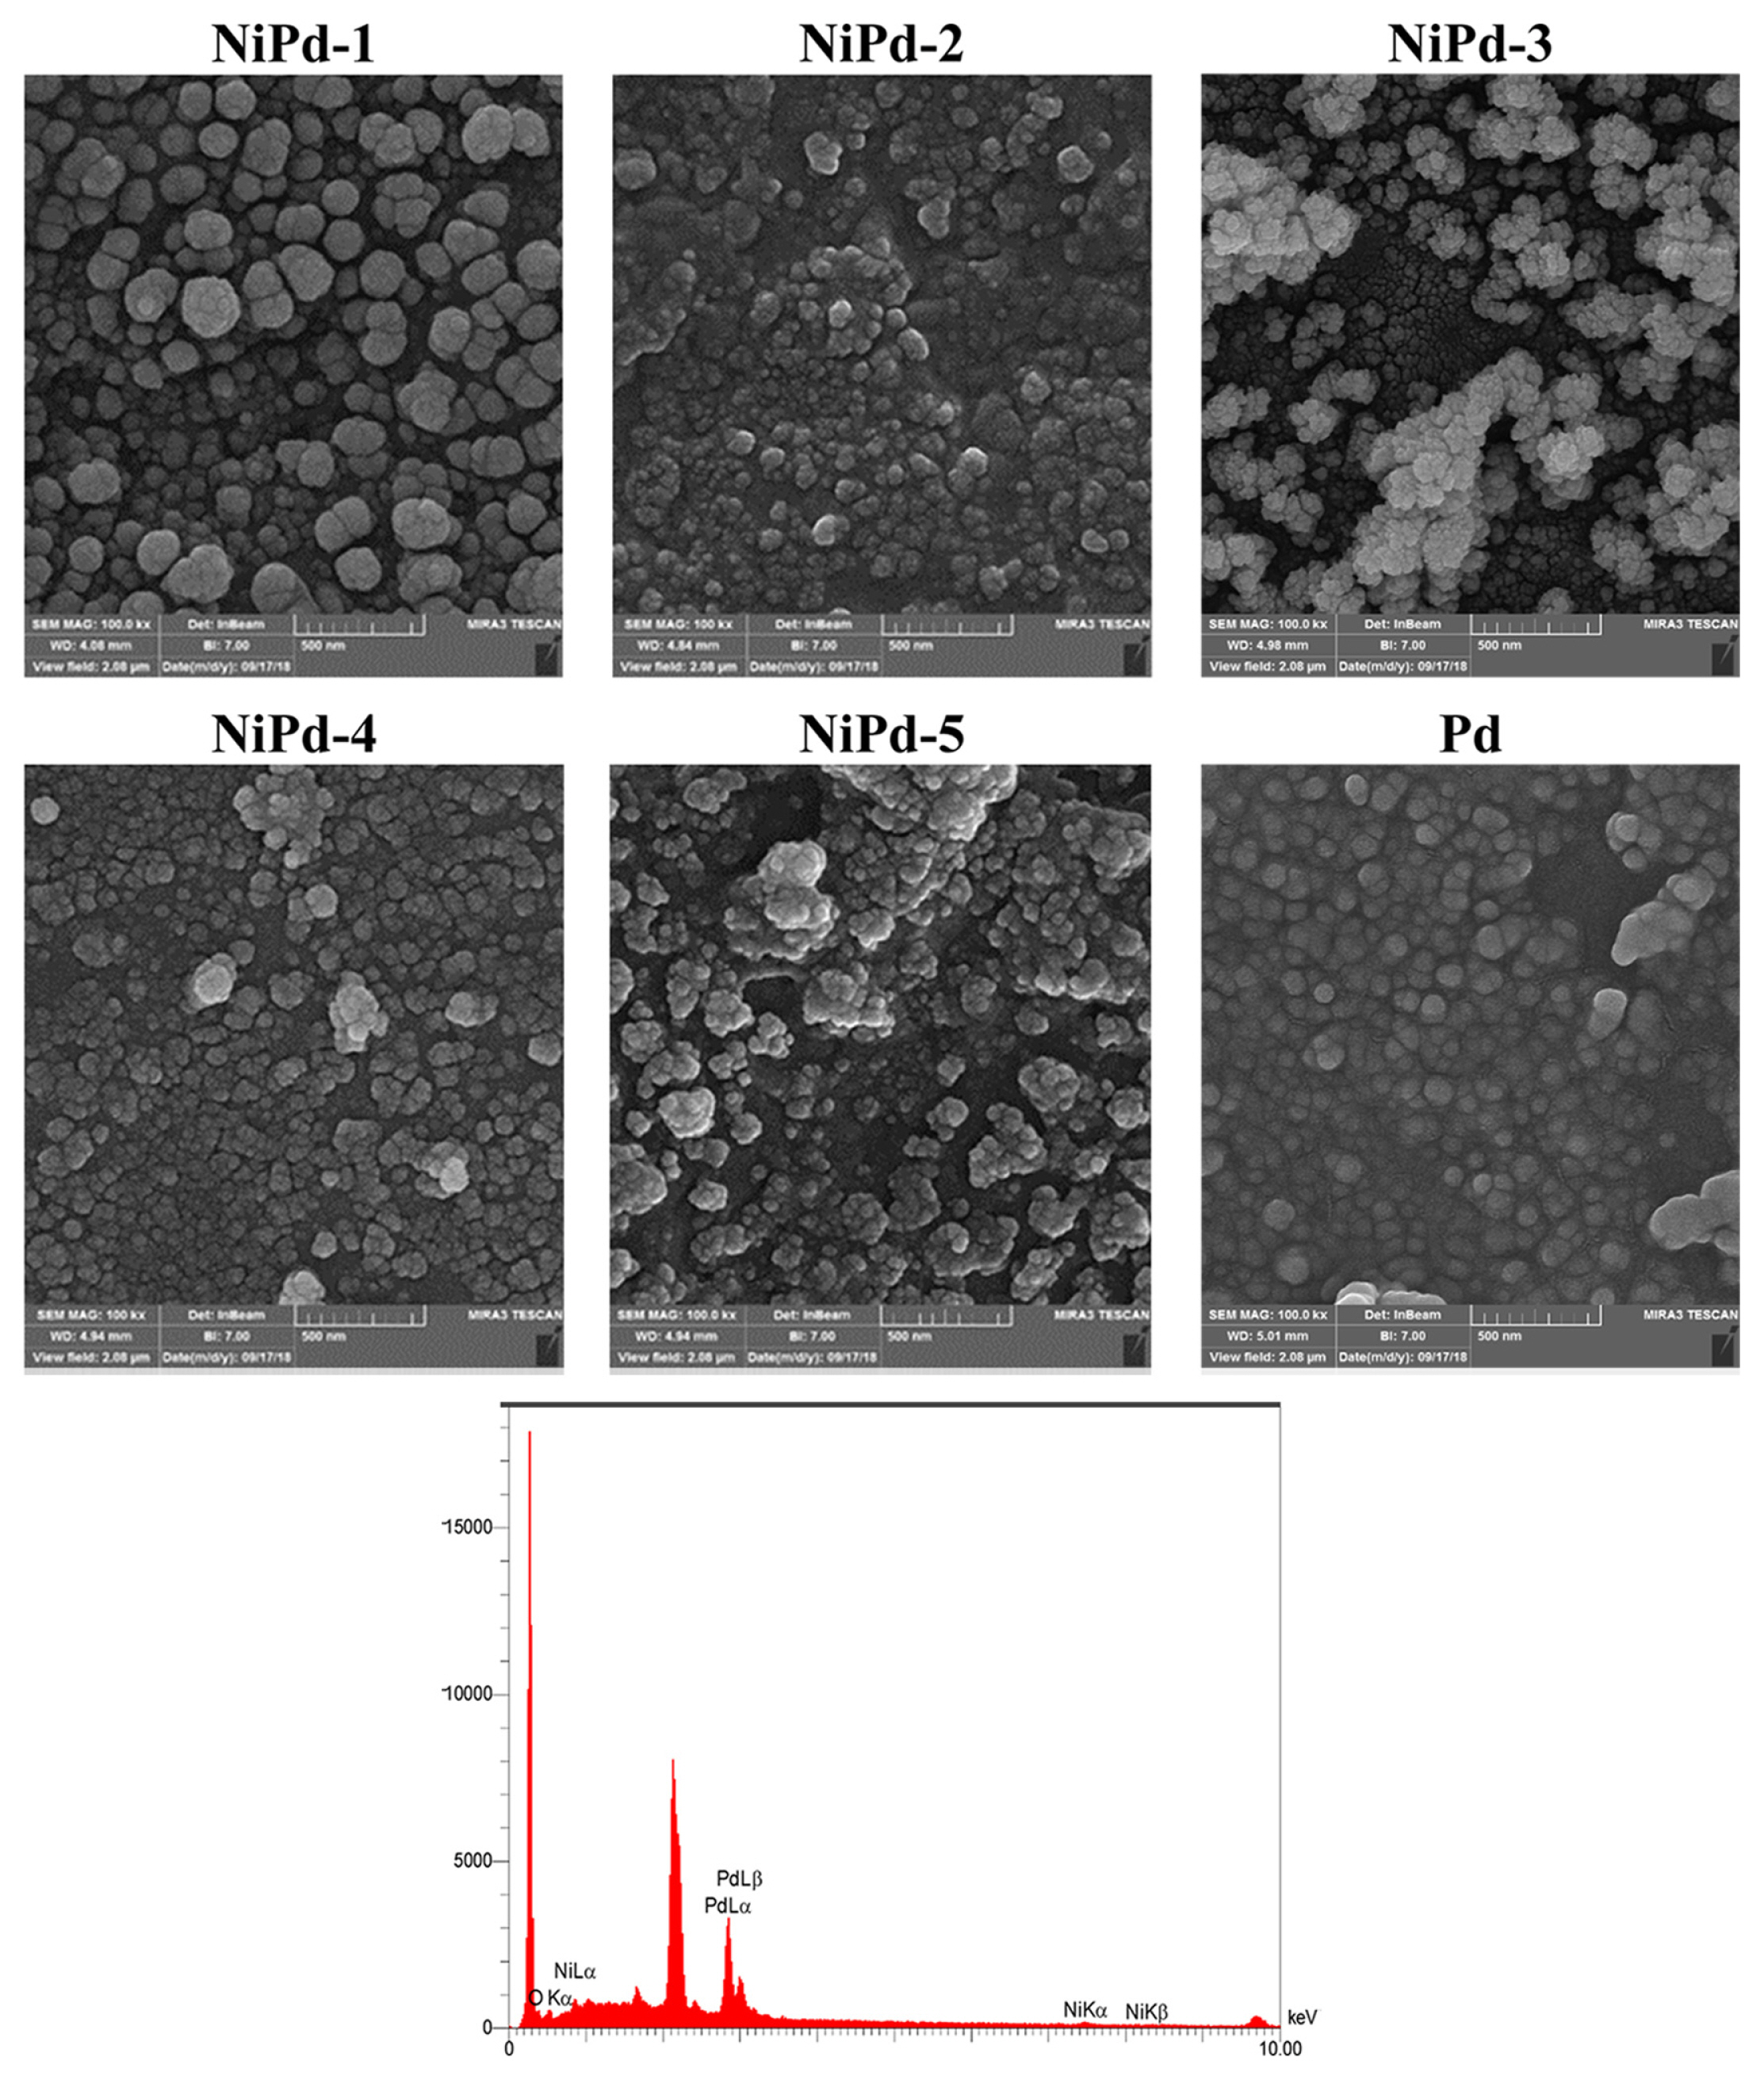
Fig. 1 presents the FE-SEM images of the electrodeposited NiPd samples (NiPd-1 to NiPd-5). For comparison, the FE-SEM image of the electrodeposited Pd sample is also depicted in this figure. The structure and morphology of the NiPd samples are different from those for the Pd sample, especially in the case of the NiPd-3 sample where a cauliflower-like structure can be observed. In addition, for the NiPd-1 sample, the polyhedral particles are observed on top of the underlying layer. Another obvious indication in the FE-SEM images of the electrodeposited samples is a distribution of particles with different sizes. The estimated average size of nano particles is 98, 129, 70, 60, 72, and 56 nm for the Pd, NiPd-1, NiPd-2, NiPd-3, NiPd-4, and NiPd-5 samples respectively.
The EDX spectrum for the NiPd-1 sample is shown in Fig. 1, while for the other electrodeposited samples the EDX spectra are presented in Fig. S1 in the supplementary data. The EDX analyses demonstrate the presence of Ni and Pd entities in the samples which confirm the formation of bimetallic catalysts during the co-deposition process. The composition of the electrodeposited NiPd samples determined by the EDX analysis is collected in Table 1. It can be seen that all the electrodeposited samples contain a low amount of Ni. The lowest (0.80%) and highest (7.10%) Ni contents are related to the NiPd-2 and NiPd-3 samples, respectively. Fig. 2 presents the EDAX mapping images of electrodeposited samples. For NiPd-1, NiPd-2 and NiPd-3 samples a uniform distribution of Ni and Pd particles are observed on the surface of electrode. For NiPd-4 and NiPd-5 samples more accumulation of particles in some areas is obvious.
3.2. Cyclic voltammetry experiments
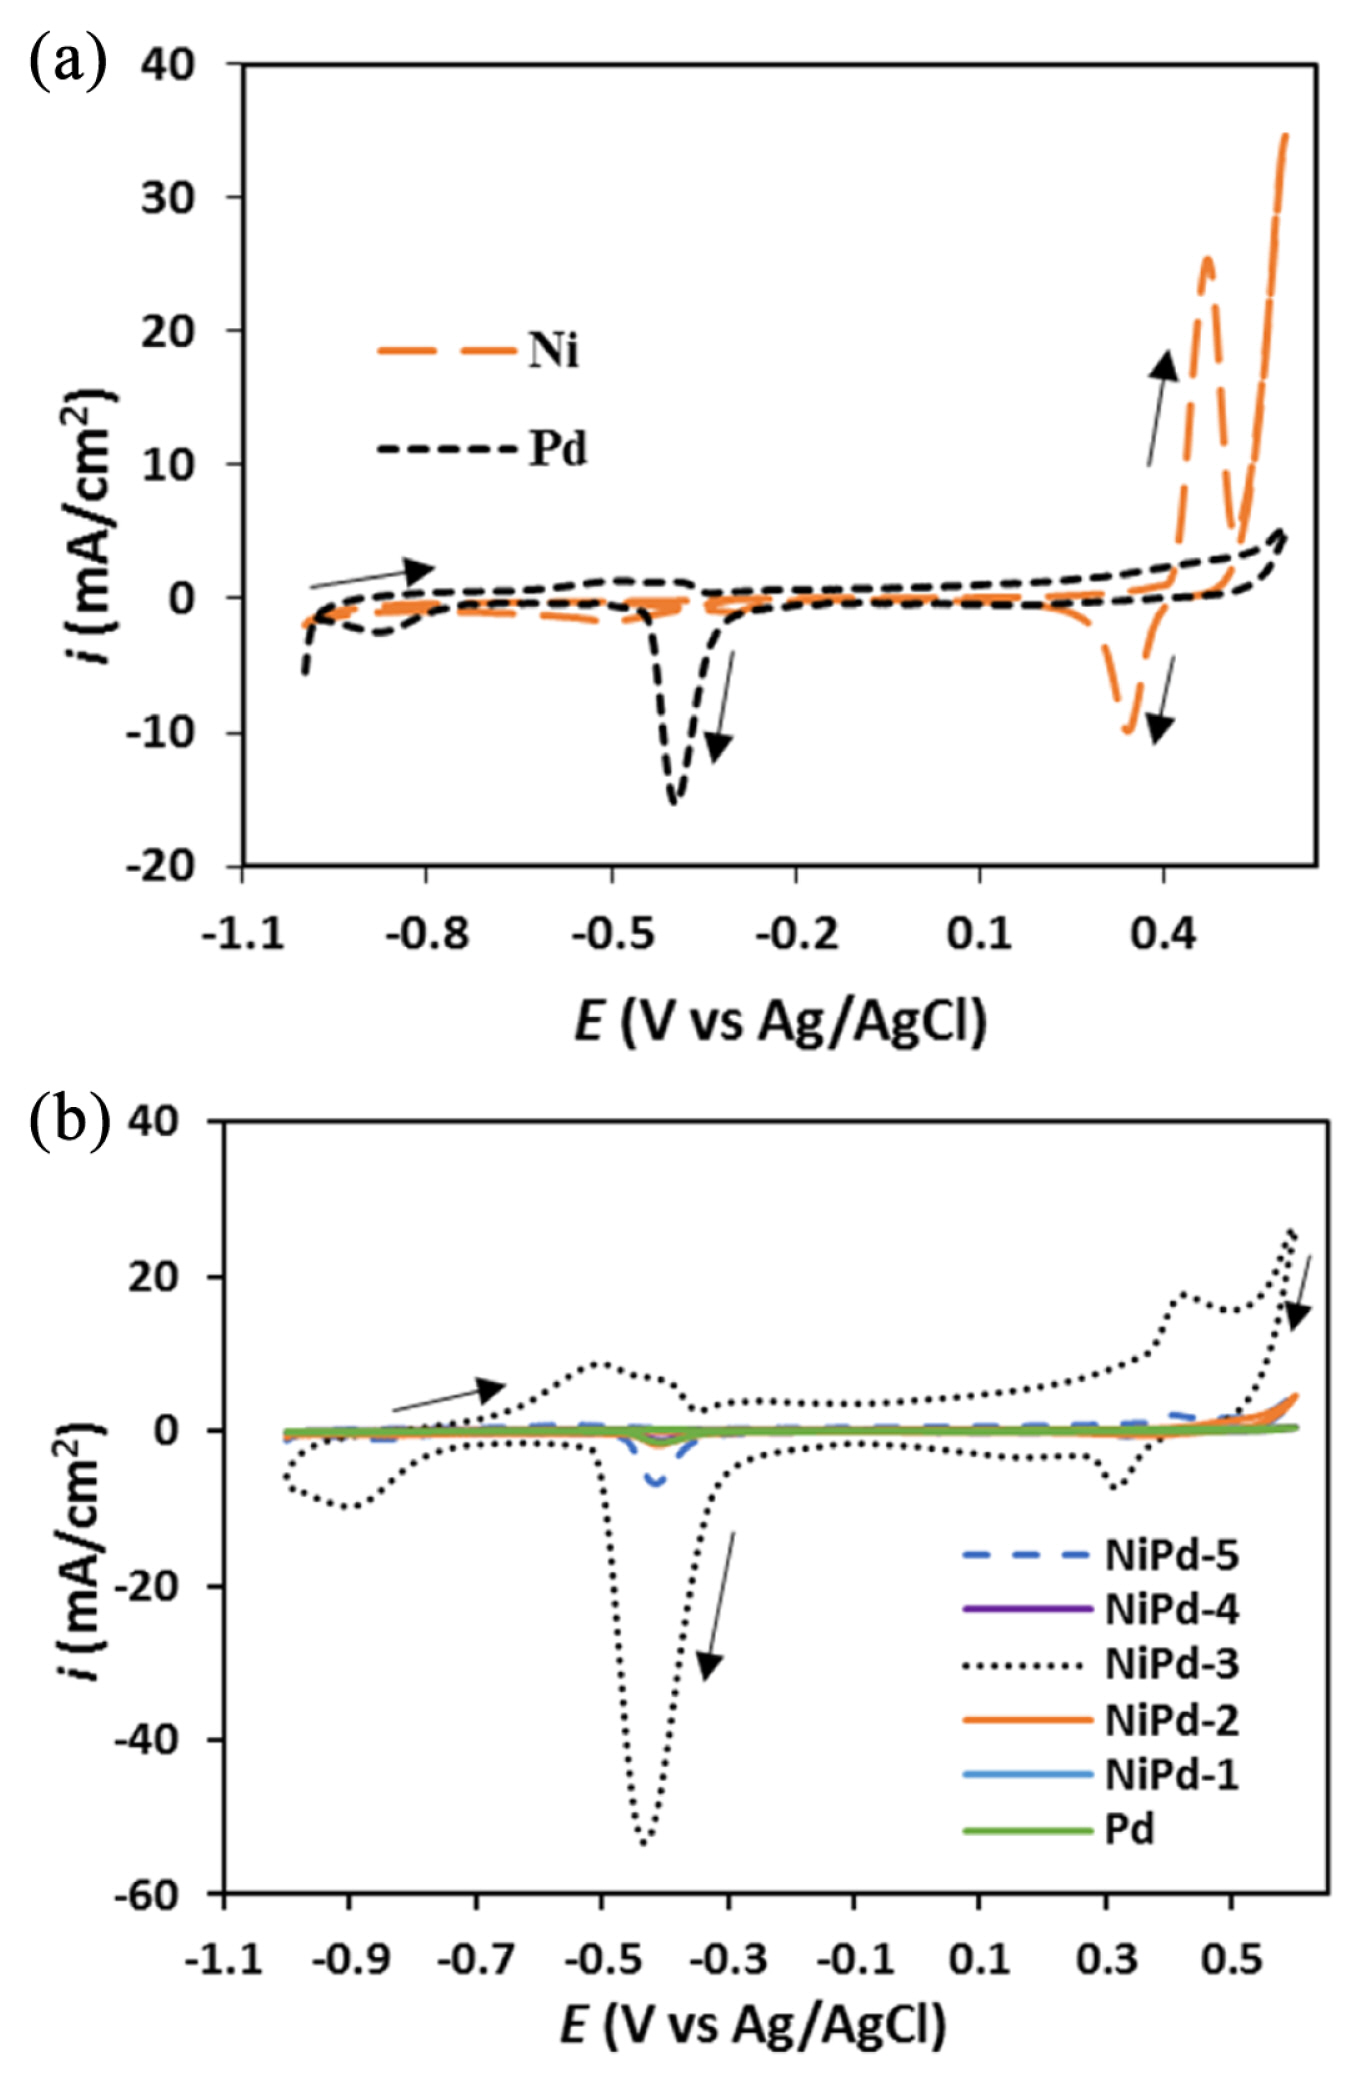
The cyclic voltammetry experiments were carried out in order to investigate the electrochemical behavior of the electrodeposited samples in NaOH solution (1.0 M). Some of the recorded cyclic voltammograms (CVs) are presented in Fig. 3 (a, b). Assignment of the observed peaks in the CVs for the NiPd samples was carried out using the CVs for the electrodeposited pure Ni and Pd samples as the reference curves (Fig. 3a). The CV for the pure Pd sample represents the reduction peak of palladium hydroxide at around −0.4 V according to the following reaction [37]:
The observed peak at the end of the cathodic half cycle is probably due to the hydrogen adsorption/ absorption/evolution. It has been reported that three processes including hydrogen adsorption, absorption, and evolution are not separated from each other on the Pd electrode [38].
In the CV for pure Ni sample, an extended double-layer charging region (−1.0–0.15 V) along with a pair of redox peaks (0.15–0.60 V) were observed. The redox pair is related to the inter-conversion of the Ni(OH)2 and NiOOH entities, as expressed by the following equations [39]:
In the CVs for the NiPd samples (Fig. 3b), some voltammetric characteristics of pure Ni and Pd samples exist but some new voltammetric characteristics that are quite different from those for pure Ni and Pd electrodes are also observed. This result confirmed that the electrodeposited NiPd samples were not a simple mixture of the Ni and Pd elements. The new electrochemical properties observed for NiPd samples are probably related to the synergistic effects of the Ni and Pd compositions.
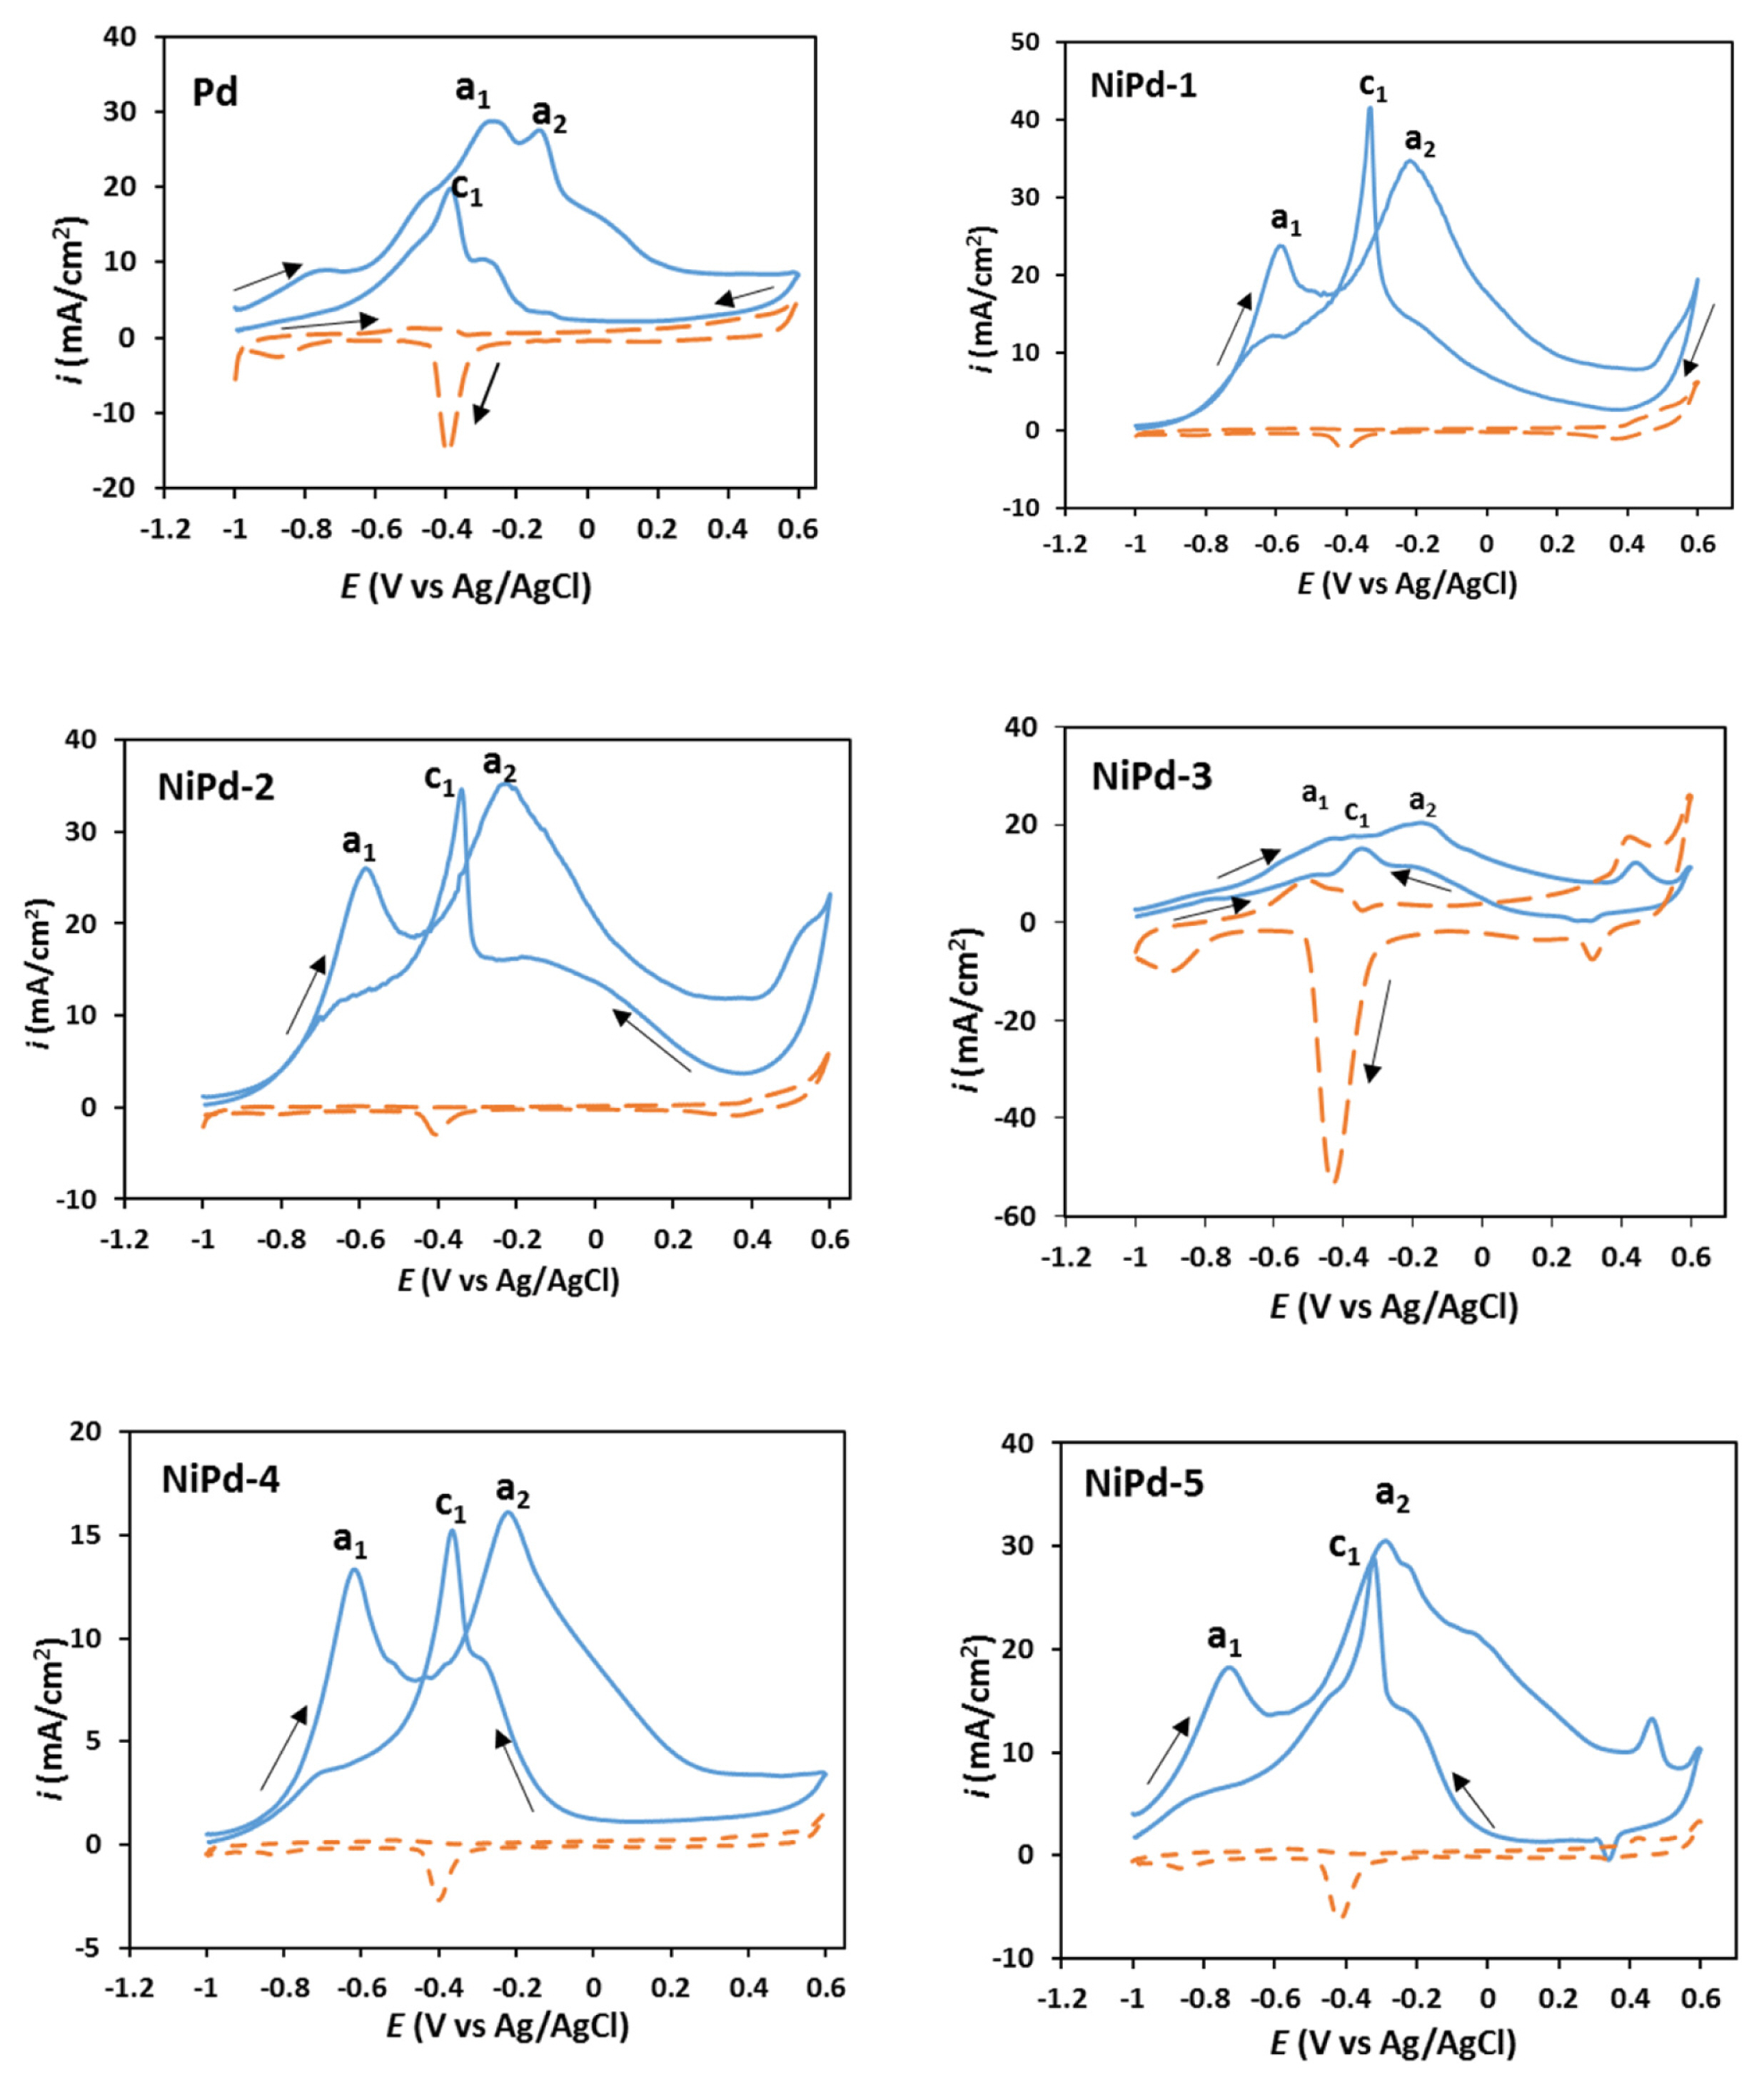
Fig. 4 presents the CVs recorded for the electrodeposited Pd and NiPd samples in NaOH solution (1.00 M) containing NaBH4 (0.03 M) at a potential scan rate of 100 mV s−1 in the potential range of −1.0–0.6 V. For a better comparison, the CVs for the samples in the absence of borohydride (dashed line) were also overlaid. It is clear in this figure that all the electrodeposited samples exhibit a similar pattern for the borohydride oxidation. For all samples, two anodic peaks (a1, a2) are observed in the forward scan. The first anodic peak (a1) is probably related to the oxidation of H2 and BH3(OH), both produced from the borohydride hydrolysis (Eqs. 3, 4). For the Pd sample, the a1 peak appears at around −0.3 V, while for the NiPd samples, this peak appears at around −0.6 V. Martins et al. [40] have also observed this peak at −0.42 V vs. Ag/AgCl on the Pt electrode in NaOH solution (3.0 M). The second anodic peak (a2) appearing at around −0.2 V can be attributed to the direct oxidation of BH4− (Eqs. 1, 2) as reported previously by Gyenge [41], Martins [40], and Benhmenyar [33] on the Pt, Pt and Pd-Cu electrodes respectively.
In the backward scan, the observed peak (c1) at around −0.30 V vs. Ag/AgCl can be attributed to the oxidation of the adsorbed intermediates produced from hydrolysis as well as incomplete oxidation of borohydride. Similar results have also been reported by Gyenge [41] and Concha [42] for the borohydride oxidation on the Pt electrode in alkaline solutions.
According to Fig. 4, the current density value for the a2 peak on the electrodeposited Pd is 28.30 mA cm−2, and for the electrodeposited NiPd samples including NiPd-1, NiPd-2, NiPd-3, NiPd-4, and NiPd-5, it is 33.90, 35.38, 20.54, 16.09, and 30.50 mA cm−2, respectively. Therefore, the NiPd-1, NiPd-2, and NiPd-5 samples have higher catalytic activity than Pd sample for a direct electro-oxidation of borohydride. It seems that the presence of a low amount of Ni in NiPd samples increases reactivity for the borohydride oxidation. Enhancement of reactivity can be attributed to the probable formation of NiPd alloy and variation in the electronic and geometric structures of Pd caused by the incorporation of Ni. As can be seen in EDAX mapping images, better (uniform) distribution of Ni particles on the surface of the electrode is another important factor that affects the catalytic activity of samples.
The ratio of forward to backward peak current densities (a2/c1) was calculated in order to evaluate the catalytic tolerance against the poisoning effects of the adsorbed intermediates generated during hydrolysis as well as incomplete oxidation of borohydride. This ratio is 1.35, 0.83, 1.02, 1.11, 1.05, and 1.06 for the Pd, NiPd-1, NiPd-2, NiPd-3, NiPd-4, and NiPd-5 samples respectively. A higher a2/c1 ratio indicates that the electrocatalyst oxidizes borohydride more effectively and generate less poisoning intermediates. The smaller value of a2/c1 for NiPd-2 sample compared to the Pd sample can be attributed to the more hydrolysis of borohydride on NiPd-2 sample.
The concentration effect of NaBH4 on the CVs of the electrodeposited samples was also investigated. The CV obtained for the NiPd-1 sample is shown in Fig. S2 in the supplementary data. The anodic current density increased with enhancing the concentration of NaBH4 from 0.02 M to 0.05 M. More enhancing in the concentration of NaBH4 did not change the current density because of the saturation of surface active sites. The inset of Fig. S2 confirms that the anodic peak current density is linearly proportional to the concentration of NaBH4. Similar results can also be observed for the other samples as presented in Figs. S3–S7 in the supplementary data.
3.3. Rotating disk electrode experiments
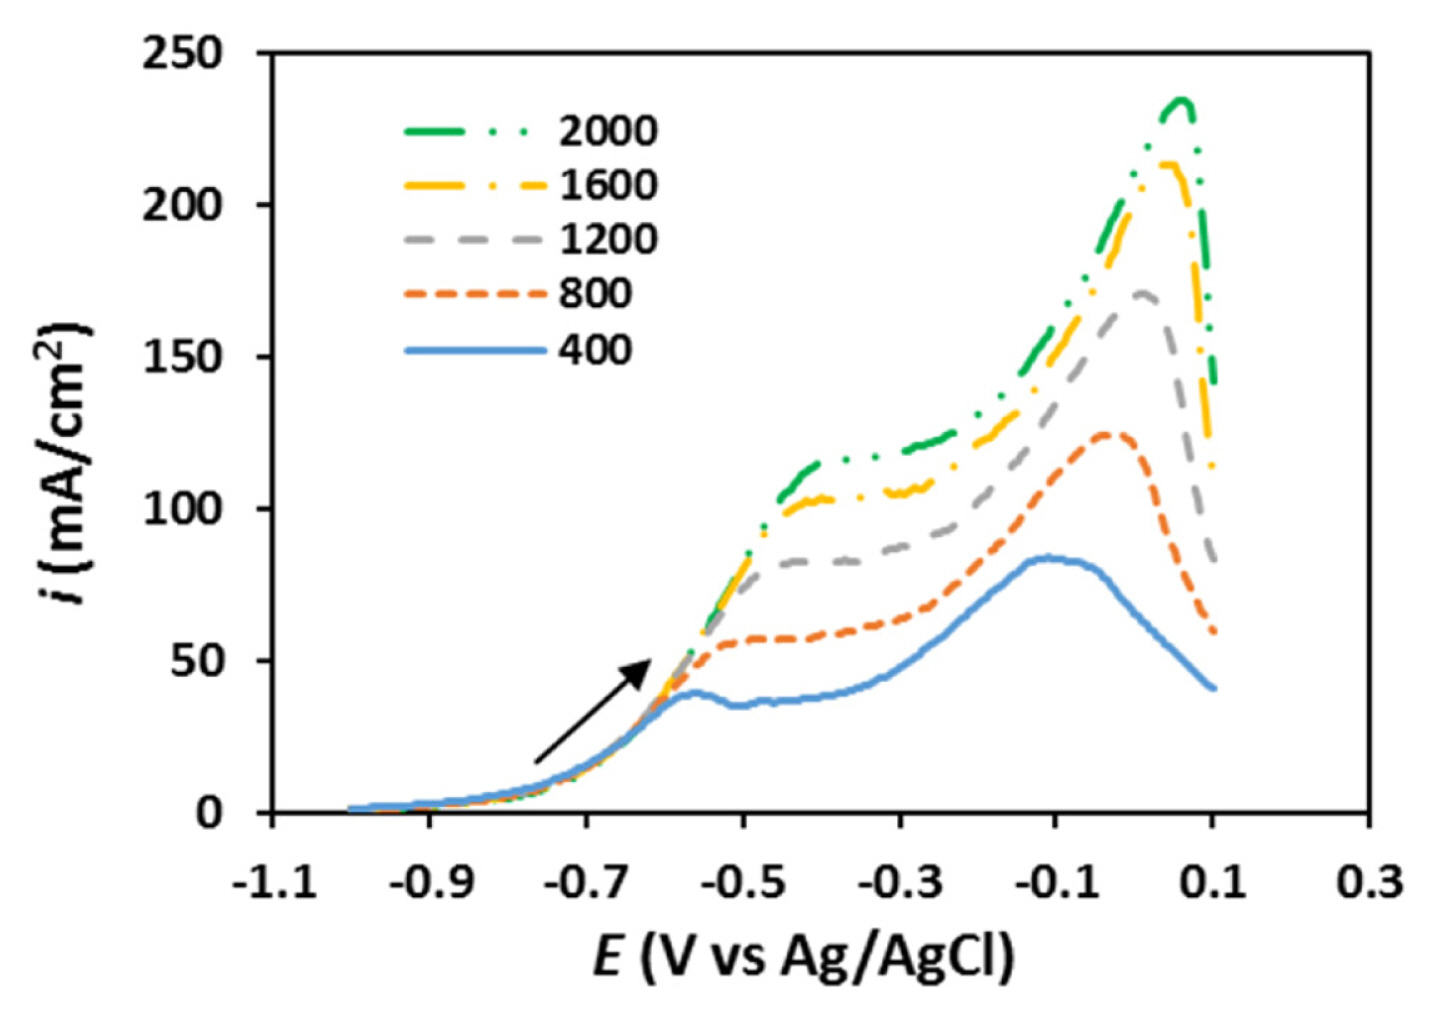
The borohydride oxidation on the electrodeposited samples was also evaluated by linear sweep voltammetry (LSV) employing the rotating disk electrode (RDE) technique. The results obtained for the NiPd-1 sample in solution (1.0 M) containing NaBH4 (0.03 M) at the potential scan rate of 5 mV/s are presented in Fig. 5. For other samples, the RDE experiments are reported in Figs. S8–S12 in the supplementary data. It is clear in Fig. 5 that at potentials lower than −0.6 V, the kinetics of charge transfer control the current density and mass transport has no effect on the current density. Therefore, at this potential region, the disk current density is completely independent of the rotation rate [43,44]. A comparison between the RDEs of different samples demonstrates that the current densities obtained for the NiPd-2 sample in the whole studied potential region are higher compared with the other samples in accordance with the CV results.
The kinetic parameters for borohydride oxidation at the investigated electrocatalysts can be estimated using the RDE experiments obtained at different rotation rates. The Koutecky-Levich equation, Eq. (8), which denotes the relationship between the overall current density (i) and the kinetic (ik) and diffusion-limited (id) current densities is used in order to calculate the number of exchanged electrons (n) [45].
where Cb is the borohydride concentration in the solution (mol cm−3), F is the faraday constant (96485 C mol−1), D is the diffusion coefficient of borohydride (1.7×10⁻⁵ cm2 s−1) [46–48], ν is the kine-matic viscosity of the solution ( 1.14×10⁻² cm2 s−1), ω is the angular rotation rate of the electrode (rad s−1), and k is the apparent rate constant (cm s−1).
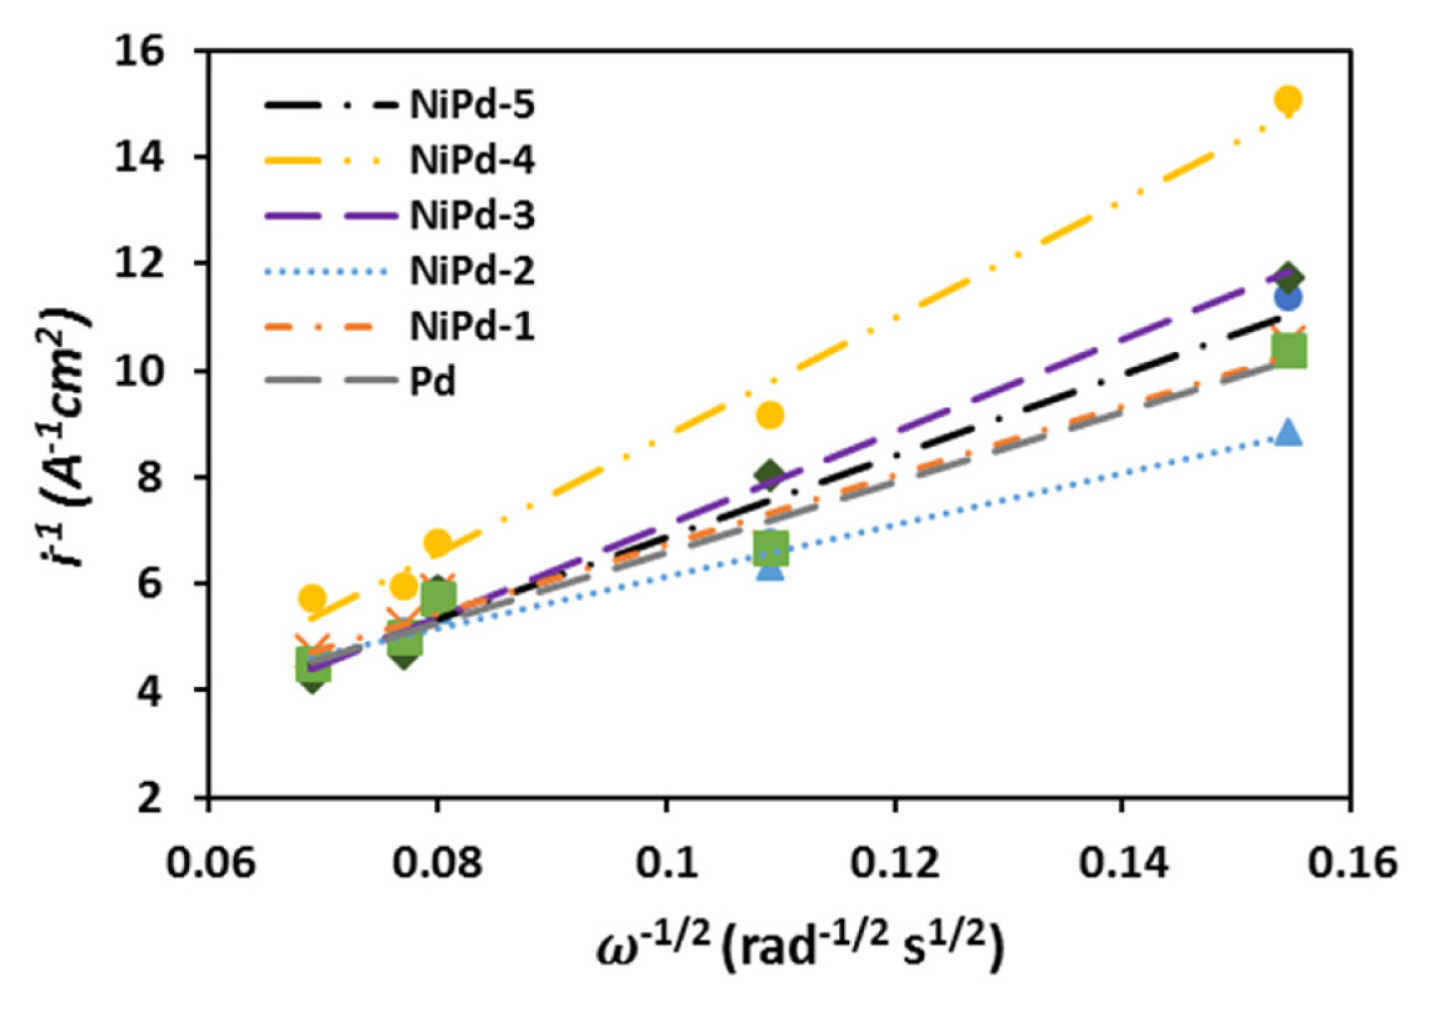
Considering Eq. (8), the plot of i−1 versus
ω - 1 2
The values for n for the NiPd-1, NiPd-2, and NiPd-5 samples are higher compared to the Pd sample, indicating a more reactivity of these electrodeposited bimetallic catalysts. Furthermore, for the NiPd-2 sample, the value for n is close to 8 (7.90), which confirms that the borohydride oxidation occurs almost completely on the NiPd-2 sample.
3.4. Chronoamperometry experiments
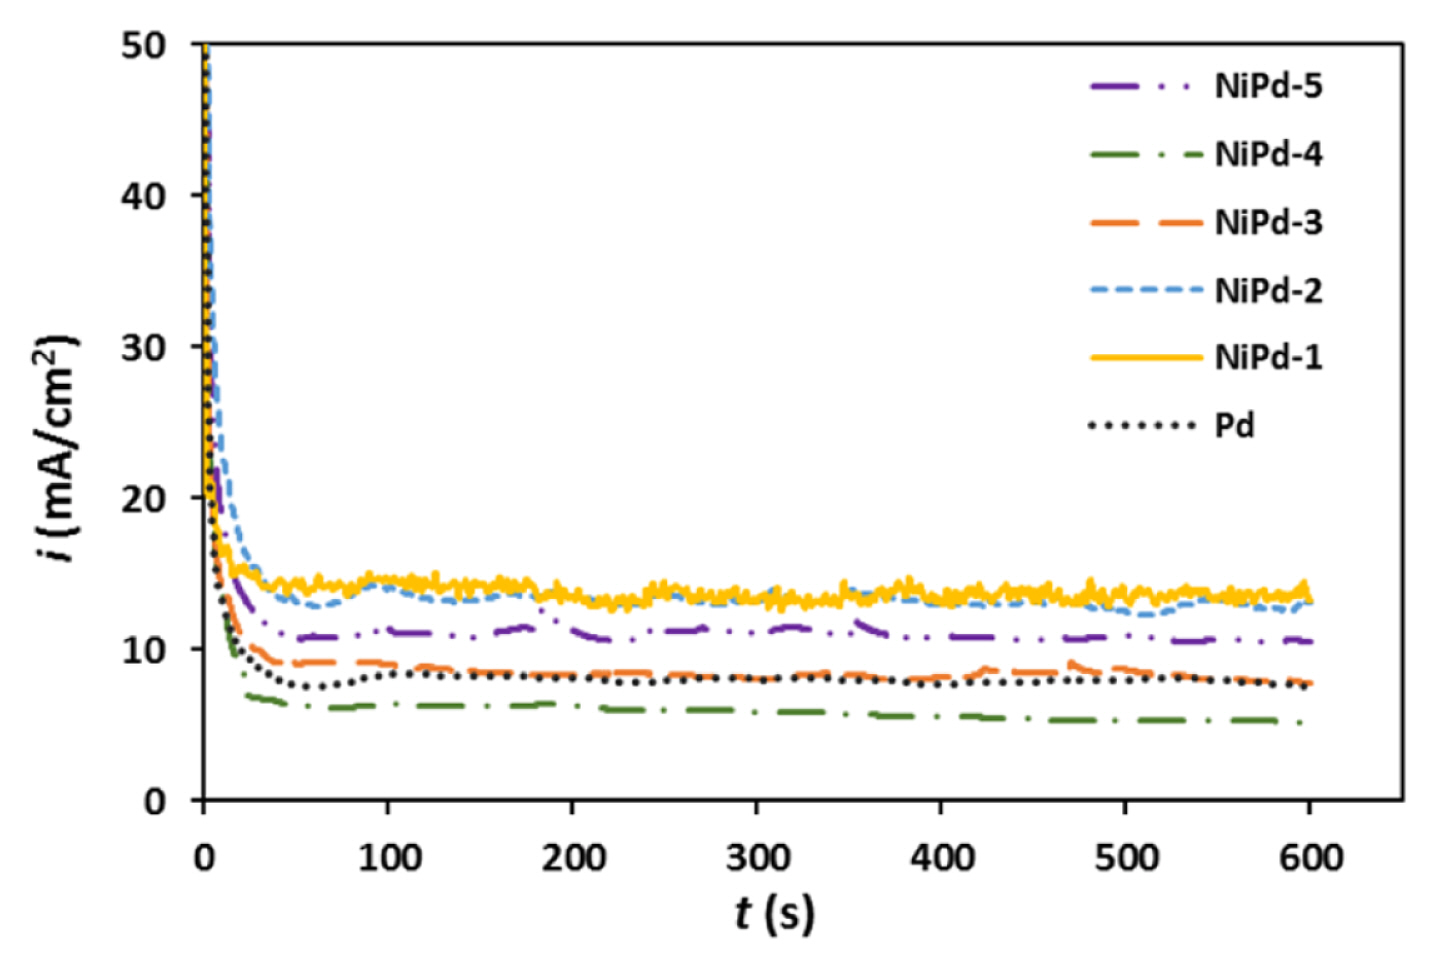
Fig. 7 shows the chronoamperograms for different electrocatalysts obtained at their corresponding peak potentials in NaOH solution (1.0 M) containing NaBH4 (0.03 M). A decrease in the current was found, and after approximately 50 s, the steady state current was observable in the chronoamperograms. The steady state current values for the NiPd-1, NiPd-2, and NiPd-5 samples are clearly higher than Pd sample indicating more reactivity of mentioned samples. The results obtained for the chronoamperometry (CA) measurements are in accord with the results of the CV and RDE experiments.
Based on the chronoamperometry measurements, the total number of exchanged electrons (n) for borohydride oxidation can also be estimated using the Cottrell equation, Eq. (9), [49].
where t is time, and A is the surface area of the electrocatalyst (cm2). The calculated values of n for all samples are listed in Table 2. In this Table, one can see that the values of n calculated by the two methods are comparable. In addition, the values for n for the NiPd-1, NiPd-2, and NiPd-5 samples are larger compared with those in the Pd sample and the maximum value of n is related to the NiPd-2 sample in accord with the RDE experiments.
3.5. Electrochemical Impedance Spectroscopy
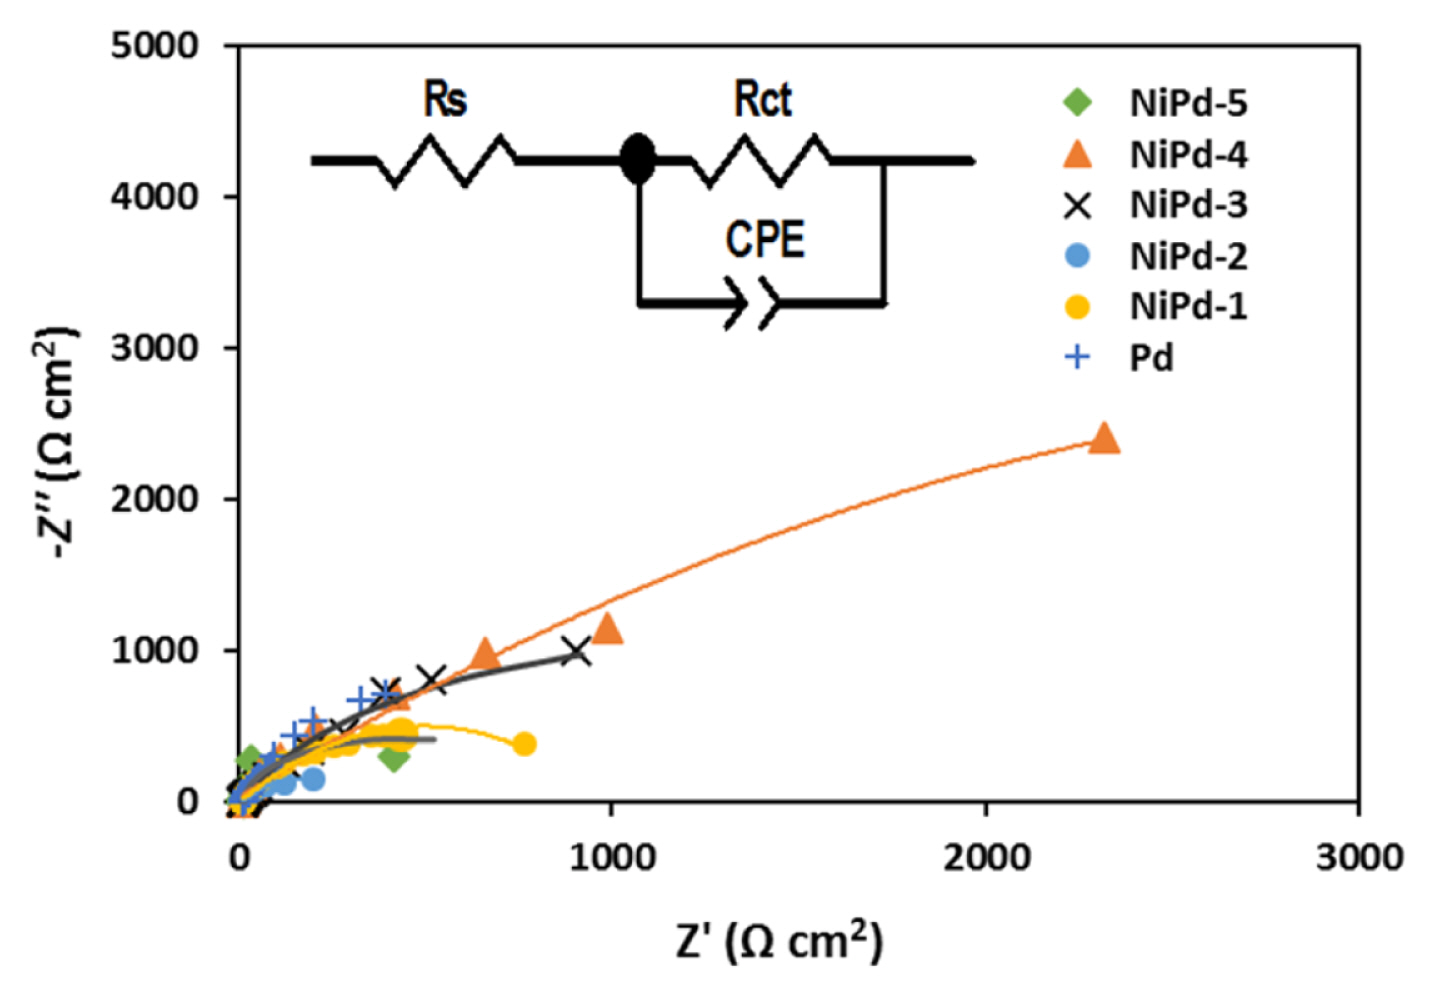
The Electrochemical Impedance Spectroscopy (EIS) can be used in order to better understand the oxidation of borohydride on the electrodeposited samples. The DC potential was selected at the peak potential (a2 in Fig. 4) of each sample for the EIS measurements. Fig. 8 presents the Nyquist diagrams obtained for the oxidation of borohydride on the electrodeposited samples in NaOH solution (1.0 M) and in the presence of NaBH4 (0.03 M). All samples represent a similar impedance pattern (a squashed semicircle) for borohydride oxidation. The existence of one semicircle was also confirmed by the Bode and Bode phase plots. For the oxidation of borohydride on the Ni electrodes [50,51], on glassy carbon and Au electrodes [52], similar Nyquist diagrams with one semicircle have also been reported previously. The diameter of the semicircle is directly related to the charge transfer resistance (Rct) of borohydride oxidation. Fig. 8 (inset) presents an equivalent circuit that is compatible with the experimental Nyquist diagrams while the calculated parameters are summarized in Table 3. In an equivalent circuit, Rs denotes the resistance of the solution. Constant phase element (CPE) includes the character of the double layer and its impedance is defined by Eq. 10.
where ω is the angular frequency of the AC signal, j is
- 1 C d l = T 1 / n R c t ( 1 - n ) / n
As it could be seen in Table 3, the values for charge transfer resistance (Rct) for the NiPd-2, NiPd-5, and NiPd-1 samples are remarkably smaller compared with the NiPd-3, NiPd-4, and Pd samples. This result obtained certifies that the enhanced electrocatalytic activity is related to the acceleration of electron transfer. Therefore, oxidation of borohydride is faster on the NiPd-2, NiPd-5, and NiPd-1 samples which is in good agreement with the CV, RDE, and CA results. According to these findings, the NiPd-2, NiPd-5, and NiPd-1 samples seem to be a potential anodic electrocatalyst for direct borohydride fuel cells.
4. Conclusions
In this work, the bimetallic NiPd electrocatalysts were prepared by electrodeposition through double potential step chronoamperometry. The surface morphology and composition of electrodeposited samples were evaluated by the FE-SEM and EDX analyses respectively. The EDX results demonstrated the low Ni content (0.80 to 7.10 atomic percentage) of the electrodeposited NiPd samples. The SEM results showed that the morphology of the NiPd samples was different from that for the Pd sample and that the Pd nanoparticles in NiPd catalysts were highly dispersed. For NiPd-3 sample with the highest Ni content (7.10%), a cauliflower-like structure was obtained. The electro oxidation of NaBH4 in NaOH solution (1.0 M) was then studied on these samples by the CV, CA, RDE, and EIS techniques. The number of exchanged electrons, the charge transfer resistances, apparent rate constants, and double layer capacitances were calculated for the oxidation of borohydride on the prepared catalysts. It was observed that the NiPd-1, NiPd-2, and NiPd-5 samples were more reactive than the Pd sample for oxidation of borohydride. It seems that the presence of a low amount of Ni in the bimetallic NiPd catalysts increases the reactivity for borohydride oxidation. Enhancement of the reactivity can be attributed to the probable formation of the NiPd alloys and variation in the electronic and geometric structures of Pd caused by the incorporation of Ni. In addition, the NiPd-2 sample with the lowest Ni content (0.80%) presented the highest catalytic activity toward borohydride oxidation. Therefore, the NiPd samples can be promising anode electrocatalysts for the direct borohydride fuel cell.