1. Introduction
Mild steel is one of the most frequently used metal in industries as it is easily available and possesses good mechanical properties. Corrosion of this metal in aggressive environment especially in presence of hydrochloric acid is a major problem faced in industrial process. Hydrochloric acid is commonly used in industries for acid pickling of steel, for cleaning of scales, for rust removal and for the cleaning of oil refinery equipments [1–3]. In order to minimize the loss of metals by corrosion, inhibitors are commonly employed. Organic compounds possessing S, N and O as heteroatoms act as good corrosion inhibitors. These compounds form a protective hydrophobic layer around the metal surface by adsorption of heteroatoms on the surface of the metal and thus prevent the attack by corrosive agents [4,5]. Though there are many such synthetic compounds available, most of them are expensive and toxic to environment and human beings. A good inhibitor should not only be efficient but also be non toxic and cheaply available. Thus there is an increasing attention towards the use of green or eco friendly inhibitors. Numerous plant extracts have shown to be highly efficient corrosion inhibitors both in acidic and alkaline medium. This is generally believed to be due to the presence of various metabolites synthesized naturally by the plants. These compounds which contains various hetero atoms and double bonds aids in the adsorption of these substances on the surface of metals [6–10].
Lepidagathis keralensis (Family: Acanthaceae) is an endemic plant of Kerala found widely distributed in lateritic hills near seacoast. It is a rigid prostrate under shrub with woody rootstock [11]. The plant possesses several medicinal properties. It is used as a preventive medicine for digestive disorders. Whole plant decoction is recommended for kidney stone. It is a blood purifier and increases blood. The plant is also used to treat bronchial asthma in children [12, 13]. Preliminary analysis of the plant in our lab has revealed the presence of various secondary metabolites like saponins, phenolics, flavonoids, alkaloids, tannins etc. The antimicrobial properties of the petroleum ether extract of the leaf and stem of the plant has been reported earlier [14]. Even though corrosion inhibition properties of several plants have been studied there is still scope for studies in this field because natural corrosion inhibitors are easily available, cost effective and eco friendly. The plant selected for the present study has not yet been explored for its corrosion inhibition properties. Since it is widely distributed in the hilly areas of south India, present study in this plant will contribute effectively in the search for novel corrosion inhibitors.
In the present study, corrosion inhibition property of the methanolic extract of leaf and stem of Lepidagathis keralensis for mild steel in 1M HCl were investigated. Weight loss methods, electrochemical impedance spectroscopy, and potentiodynamic polarization techniques were employed for the study. Further studies for the evaluation of mechanism of inhibition were done using UV-Vis and SEM methods. Quantum chemical studies on Phenoxyethene, which was identified as one of the major components in the leaf extract of the plant was also done in order to support the results obtained in experimental methods.
2. Materials and Methods
2.1. Preparation of Inhibitor
The plant Lepidagathis keralensis was collected from Madayipara, Kerala and identified from the Department of Botany, Govt. Brennen College, Kerala. The leaves and stem of the plant were separated, washed well to remove solid impurities and dried in shade for 3 weeks. The dried plant parts were then extracted with methanol in a soxhlet apparatus. The extract was then evaporated to dryness under reduced pressure and used as the corrosion inhibitor for mild steel.
2.2. Mild Steel Specimen and Medium
Weight loss studies were done using mild steel coupons having composition of C (0.2%), Mn (1%), P (0.03%), S (0.02%), and Fe (98.75%). The coupons were cut in 2×1.9 cm2 dimensions, polished well with different grades of emery paper and degreased with acetone. The coupons were then washed well, dried and used for weight loss studies. For electrochemical studies a surface area of 1 cm2 was exposed.
The test solution of 1M HCl was prepared by diluting analytical grade HCl (E. Merck).
2.3. Weight Loss Method
The corrosion performance of the extracts for mild steel in 1M HCl was determined by weight loss measurements at 303K, 313K and 323K. Previously weighed mild steel coupons were immersed in 50 ml 1M HCl solution containing varying amount of inhibitor concentration (50ppm, 100ppm, 150ppm and 200ppm) for 6 hours. Steel coupon immersed in 1M HCl without inhibitor was used as blank. After 6 hours, the coupons were taken out, washed with water, cleaned with acetone, dried and the weight was determined. The corrosion rate and inhibition efficiencies of the extracts were then calculated using the equations (1) and (2) respectively [15].
Where Wa and Wb are the weight of steel coupons after and before immersions in the corrosive medium. A is the area of the steel coupon in cm2 and t is the time of exposure in hours. W1 is the weight loss without inhibitor and W2 is the weight loss with inhibitor.
2.4. Electrochemical Measurements
The electrochemical impedance and polarization experiments were conducted in a computer controlled Gill AC electrochemical work station (model no: 1475; ACM, UK). The measurements were done at 303 K under atmospheric pressure using a conventional three electrode assembly. Mild steel specimen embedded in polytetrafluoroethylene with an exposed surface area of 1 cm2 acts as the reference electrode. Saturated calomel electrode and platinum electrode acts as the reference and auxiliary electrodes respectively. The measurements were taken without and with different concentrations of the extracts of stem and leaf of the plant as inhibitor. Mild steel specimens were immersed in the solutions for 1 hour prior to measurements in order to attain stability.
For electrochemical impedance spectroscopic (EIS) studies, a sinusoidal voltage of amplitude 10 mV in a frequency range 10 kHz to 0.1 Hz was imposed. The impedance measurements were represented as Nyquist plots. The inhibition efficiencies (IE) of the extracts were calculated from the equation, IE (%) = (Rct
Where Rct * and Rct are the charge transfer resistance in the presence of inhibitor and absence of inhibitor respectively.
Potentiodynamic polarization measurements were represented by Tafel plots obtained in +250 to −250 mV potential range with a scan rate of 60 mV/min. By extrapolation of linear Tafel segments of cathodic and anodic curves to the corrosion potential, the corrosion current densities (Icorr) were determined. The inhibition efficiencies (IE) of the extracts were then calculated from the equation,
Where I* corr and Icorr are the corrosion current densities in the presence of inhibitor and absence of inhibitor respectively.
2.5. UV-Visible Spectroscopy
UV-Visible absorption spectra of 1M HCl solution without extracts and with 200ppm of leaf and stem extracts of Lepidagathis keralensis were measured before and after immersion of mild steel specimen for 24 hours. The spectral measurements were performed using Shimadzu UV-1800 UV-VIS Spectrophotometer.
2.6. FT-IR Spectroscopy
FT-IR spectra of crude extracts and that of the film formed on the surface of mild steel after immersion in 200ppm inhibitor solution for 24 hours were recorded using Perkin Elmer Spectrum Two FT-IR Spectrometer in the frequency range of 4000-450cm−1.
2.7. Scanning Electron Microscopy
Surface morphological examinations of mild steel in 1M HCl were done by Scanning electron microscopy (SEM). Mild steel specimens were immersed in 1M HCl for 24 hours with and without 200ppm of methanolic extracts of leaf and stem. The specimens were taken out, washed well and dried. SEM images of the specimen were recorded using Jeol JSM-6390LA Scanning Electron Microscope.
2.8. Computational Studies
Phenoxyethene (also known as Benzene, (ethenyloxy)-) was identified as one of the major component in the GC-MS analysis of the methanol extract of leaves of the plant [16]. Quantum chemical calculations were performed in this compound to support the experimental results obtained. Calculations were done using DFT method with Becke’s three parameter exchange functional combined with the correlation functional of Lee, Yang and Parr. Complete geometry optimization of the inhibitor molecule was carried out using B3LYP/6–31G(d, p) basis set using Gaussian 09 program for Windows. This method is widely used for the study of corrosion process [17]. Quantum chemical parameters such as EHOMO, ELUMO, χ(electronegativity), η(global hardness), σ(global softness) and ΔN(fraction of electrons transferred from the inhibitor molecule to the metal surface) were calculated [18]
The fraction of electrons transferred from the inhibitor molecule to the metal surface can be calculated as follows:
where χFe and χinh are the absolute electronegativity of iron and inhibitor molecule respectively. ηFe and ηinh are respectively the hardness of the metal and inhibitor.
3. Results and Discussion
3.1. Weight Loss Method
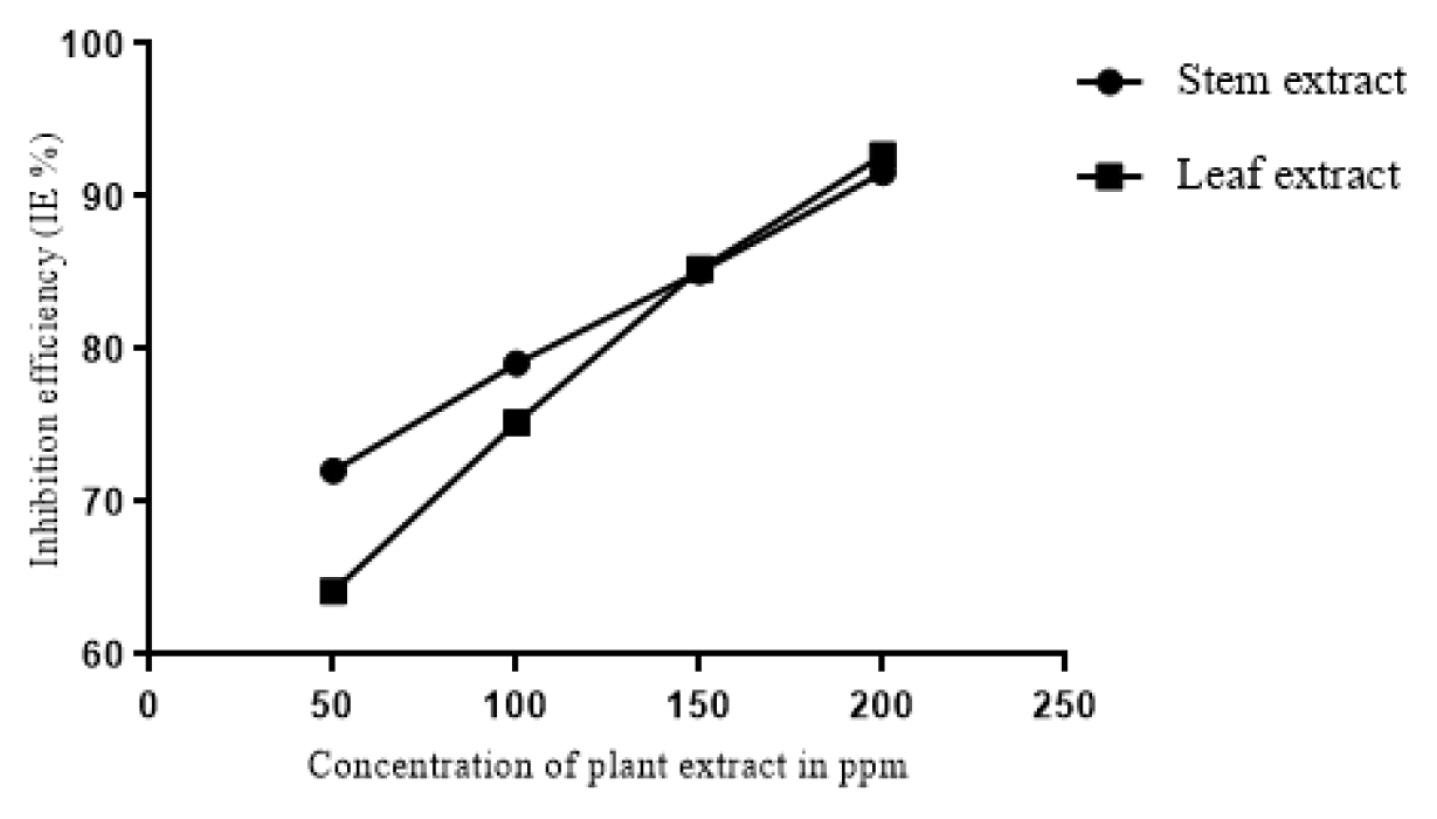
The results of weight loss measurements conducted at 303K, 313K and 323K are tabulated in Table 1. It is clear from the table that the methanolic extracts of both the leaf and stem of the plant acts as good corrosion inhibitor for mild steel in 1M HCl. The leaf and stem extracts showed highest inhibition efficiency of 92.73% and 91.57% respectively for 200ppm concentration. The corrosion rates showed a tremendous decrease with increase in concentration of the inhibitor and consequently the inhibition efficiencies of the extracts were found to increase with the concentration of the inhibitor (Fig. 1). The high inhibition efficiencies of the extracts is suggested to be due to the adsorption of inhibitor on the surface of mild steel and thus blocking the active sites against corrosion [19]. It is also obvious from the table that temperature plays a major role in the corrosion process. As the temperature is increased, the inhibition efficiencies of the extracts were found to decrease. This might be due to desorption of adsorbed inhibitor molecules at higher temperatures thus exposing the surface for active corrosion [20].
3.2. Electrochemical Measurements
3.2.1. Electrochemical Impedance Spectroscopic Studies (EIS)
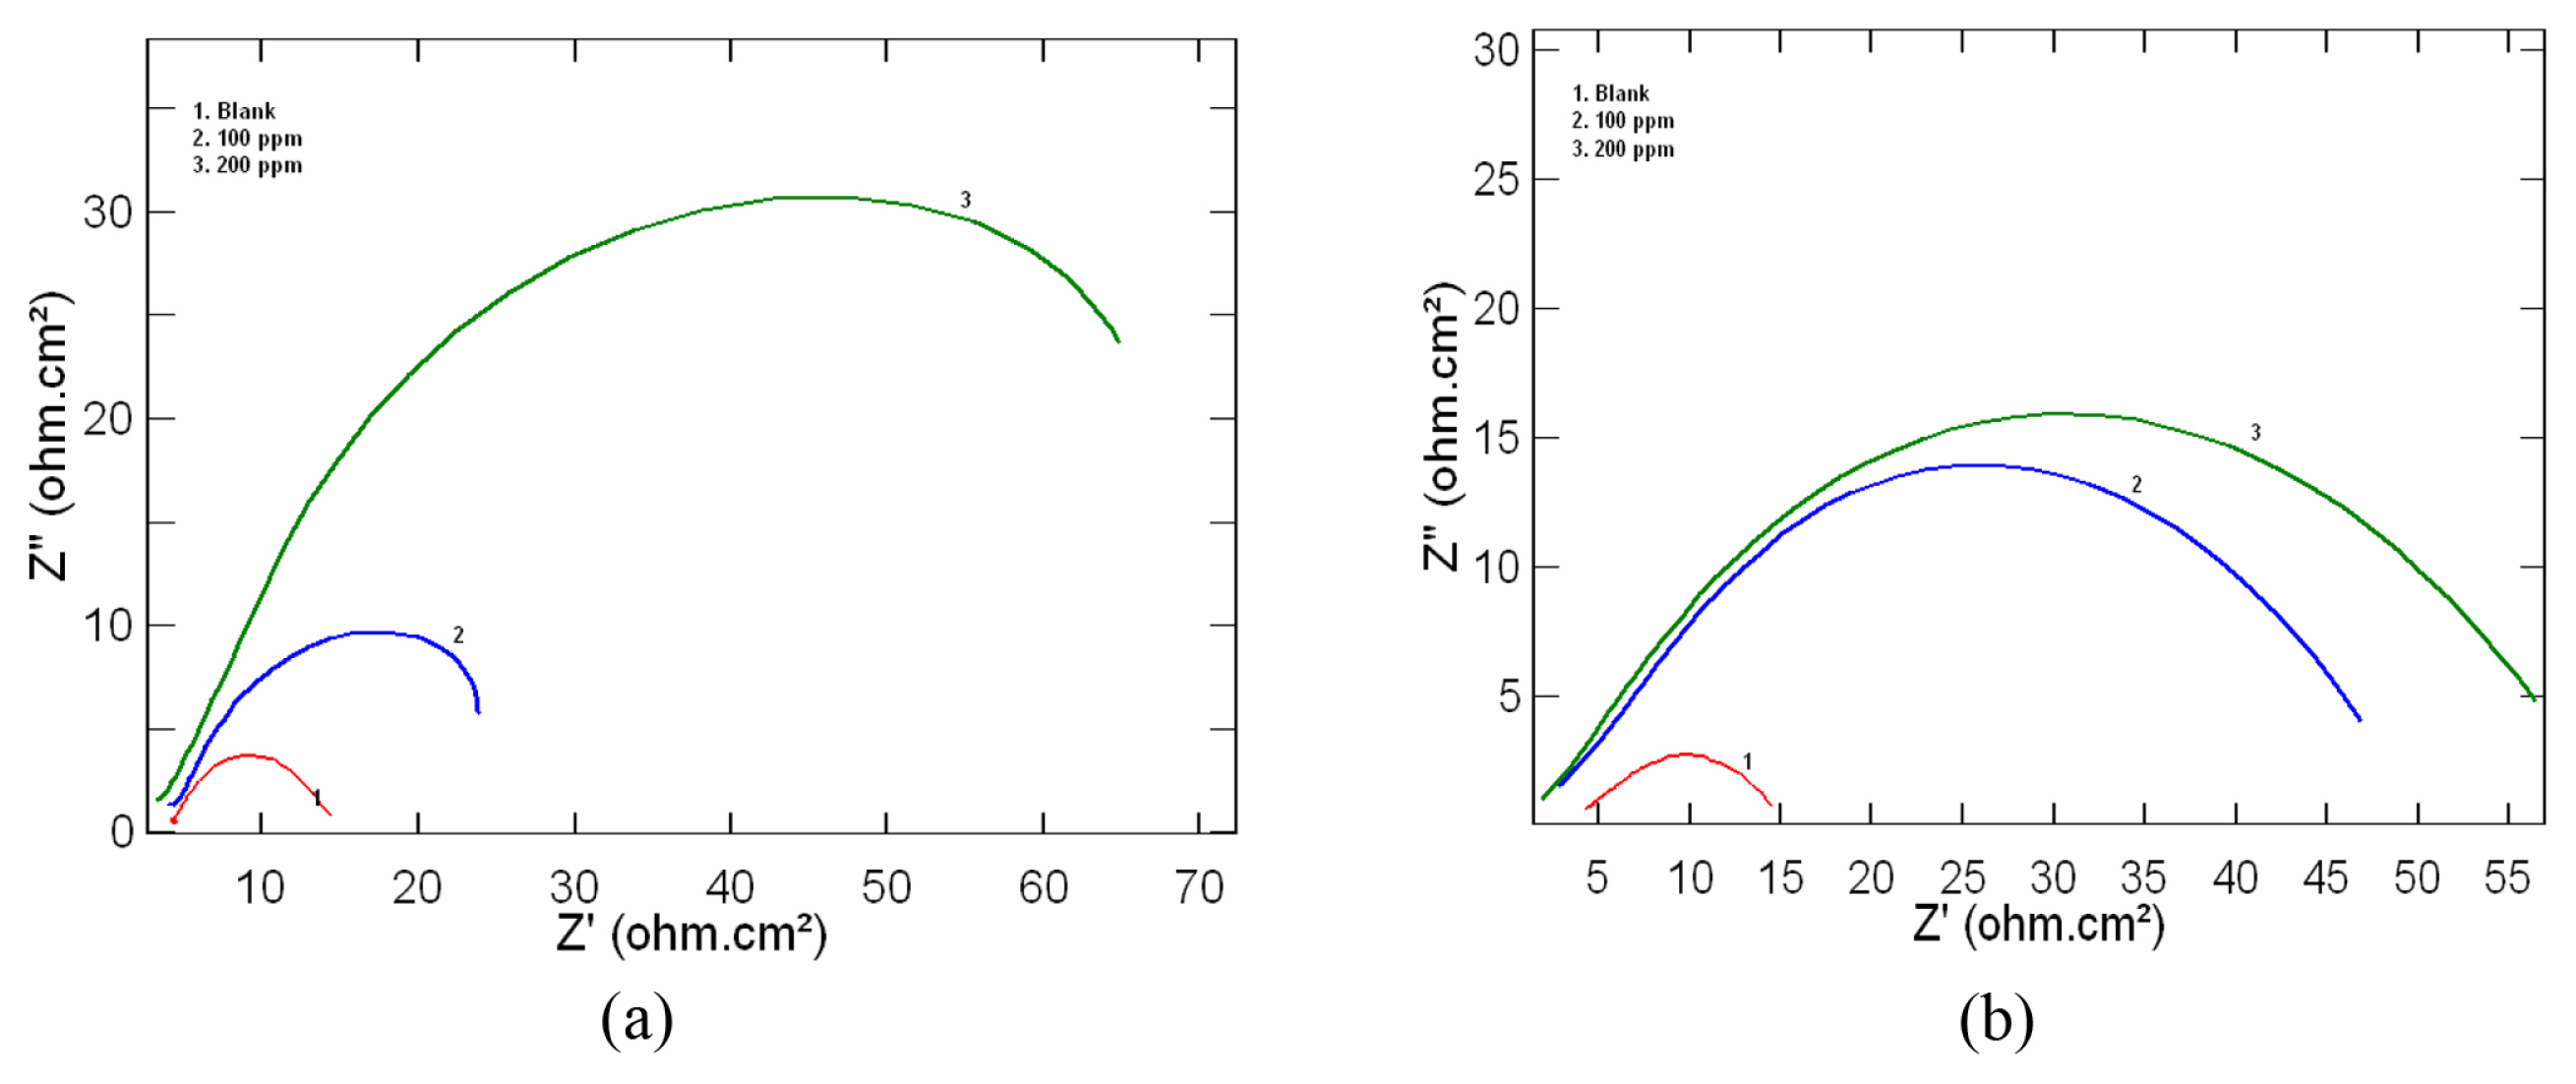
Electrochemical impedance spectroscopic measurements for mild steel in 1M HCl was determined in the absence and presence of 100ppm and 200ppm of the inhibitor at 303 K. The results obtained for leaf and stem extracts as inhibitor are represented as Nyquist plots in Fig 2a and 2b respectively. Nyquist plots obtained for the present study showed depressed semicircles with centre under the real axis which is characteristic of solid electrodes showing frequency dispersion of impedance data due to surface heterogeneities [21].
From the shape of the loop it can be inferred that corrosion of mild steel is controlled by charge transfer process and the presence of inhibitor does not affect the process. The increase in diameter of the depressed semicircle in the presence of plant extracts represents an increase in charge transfer resistance (Rct) value. The various impedance parameters such as charge transfer resistance (Rct), corrosion current density (Icorr) and inhibition efficiency (IE) as obtained from Nyquist plot are given in Table 2. From the table it is clear that there is an increase in Rct value, which in turn shows an increase in inhibition efficiency. This increase can be attributed to be due to the adsorption of inhibitor molecules on the mild steel surface and thus reducing the exposed surface area for active corrosion [22,23].
3.2.2. Potentiodynamic Polarization Studies
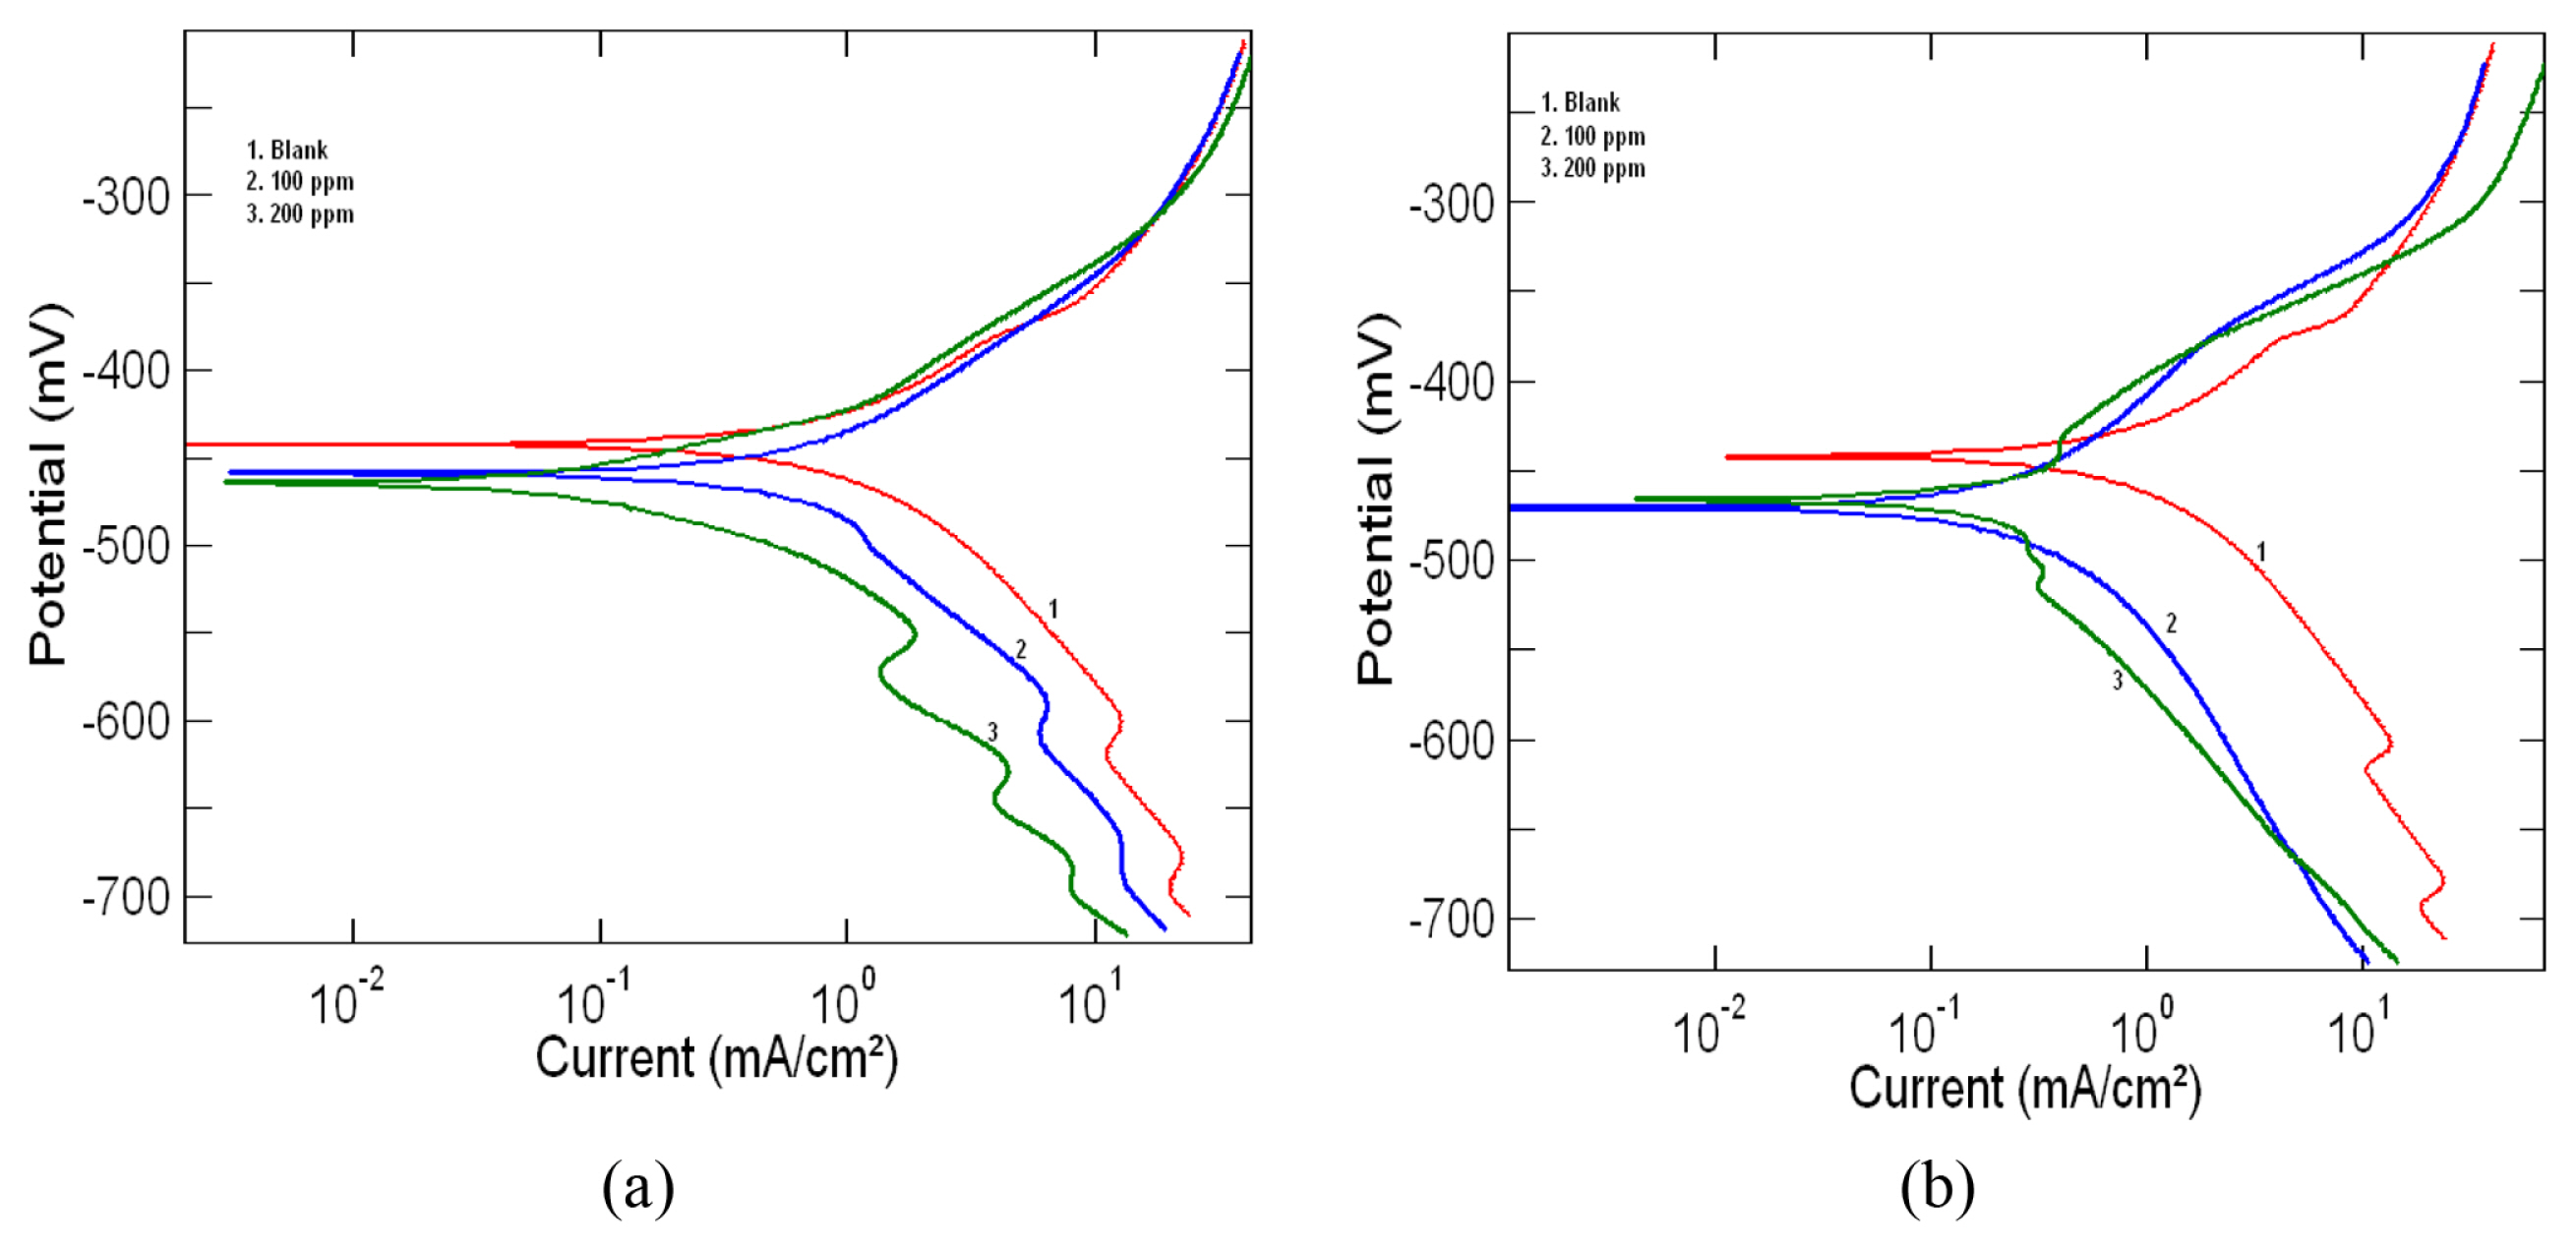
The potentiodynamic polarization curves for mild steel in 1M HCl at 303 K in the absence and presence of 100ppm and 200ppm of the leaf and stem extracts are shown in Fig. 3a and 3b respectively. From the polarization curves electrochemical parameters such as corrosion potential (Ecorr), corrosion current density (Icorr), corrosion rate (CR), cathodic Tafel constant (βc) and anodic Tafel constant (βa) were determined and are given in Table 3. The percentage inhibition efficiency (%IE) of the extracts calculated using the equation (4) is also shown in the table. From the table it is clear that with an increase in inhibitor concentration there is a decrease in corrosion current density and thus a corresponding increase in inhibition efficiency. The decrease in corrosion current density further supports the fact that the inhibitor molecules act by adsorption on the surface of mild steel and thus providing effective protection against corrosion [24,25]. The careful examination of the tafel plots in Fig. 3a and 3b also reveals that both the anodic and cathodic curves are affected by the addition of inhibitor. Thus the addition of both the leaf and stem extracts reduces the anodic dissolution of the metal and also resists the cathodic hydrogen evolution. Classification of an inhibitor as cathodic or anodic can be done if the Ecorr value is greater than 85 mV. In our present study, 26 mV and 21 mV was the largest displacement value observed for Ecorr for the stem and leaf extract respectively. This shows that the selected extracts of the plant acts as mixed type inhibitor [26–28].
3.3. Adsorption Studies and Thermodynamic Parameters
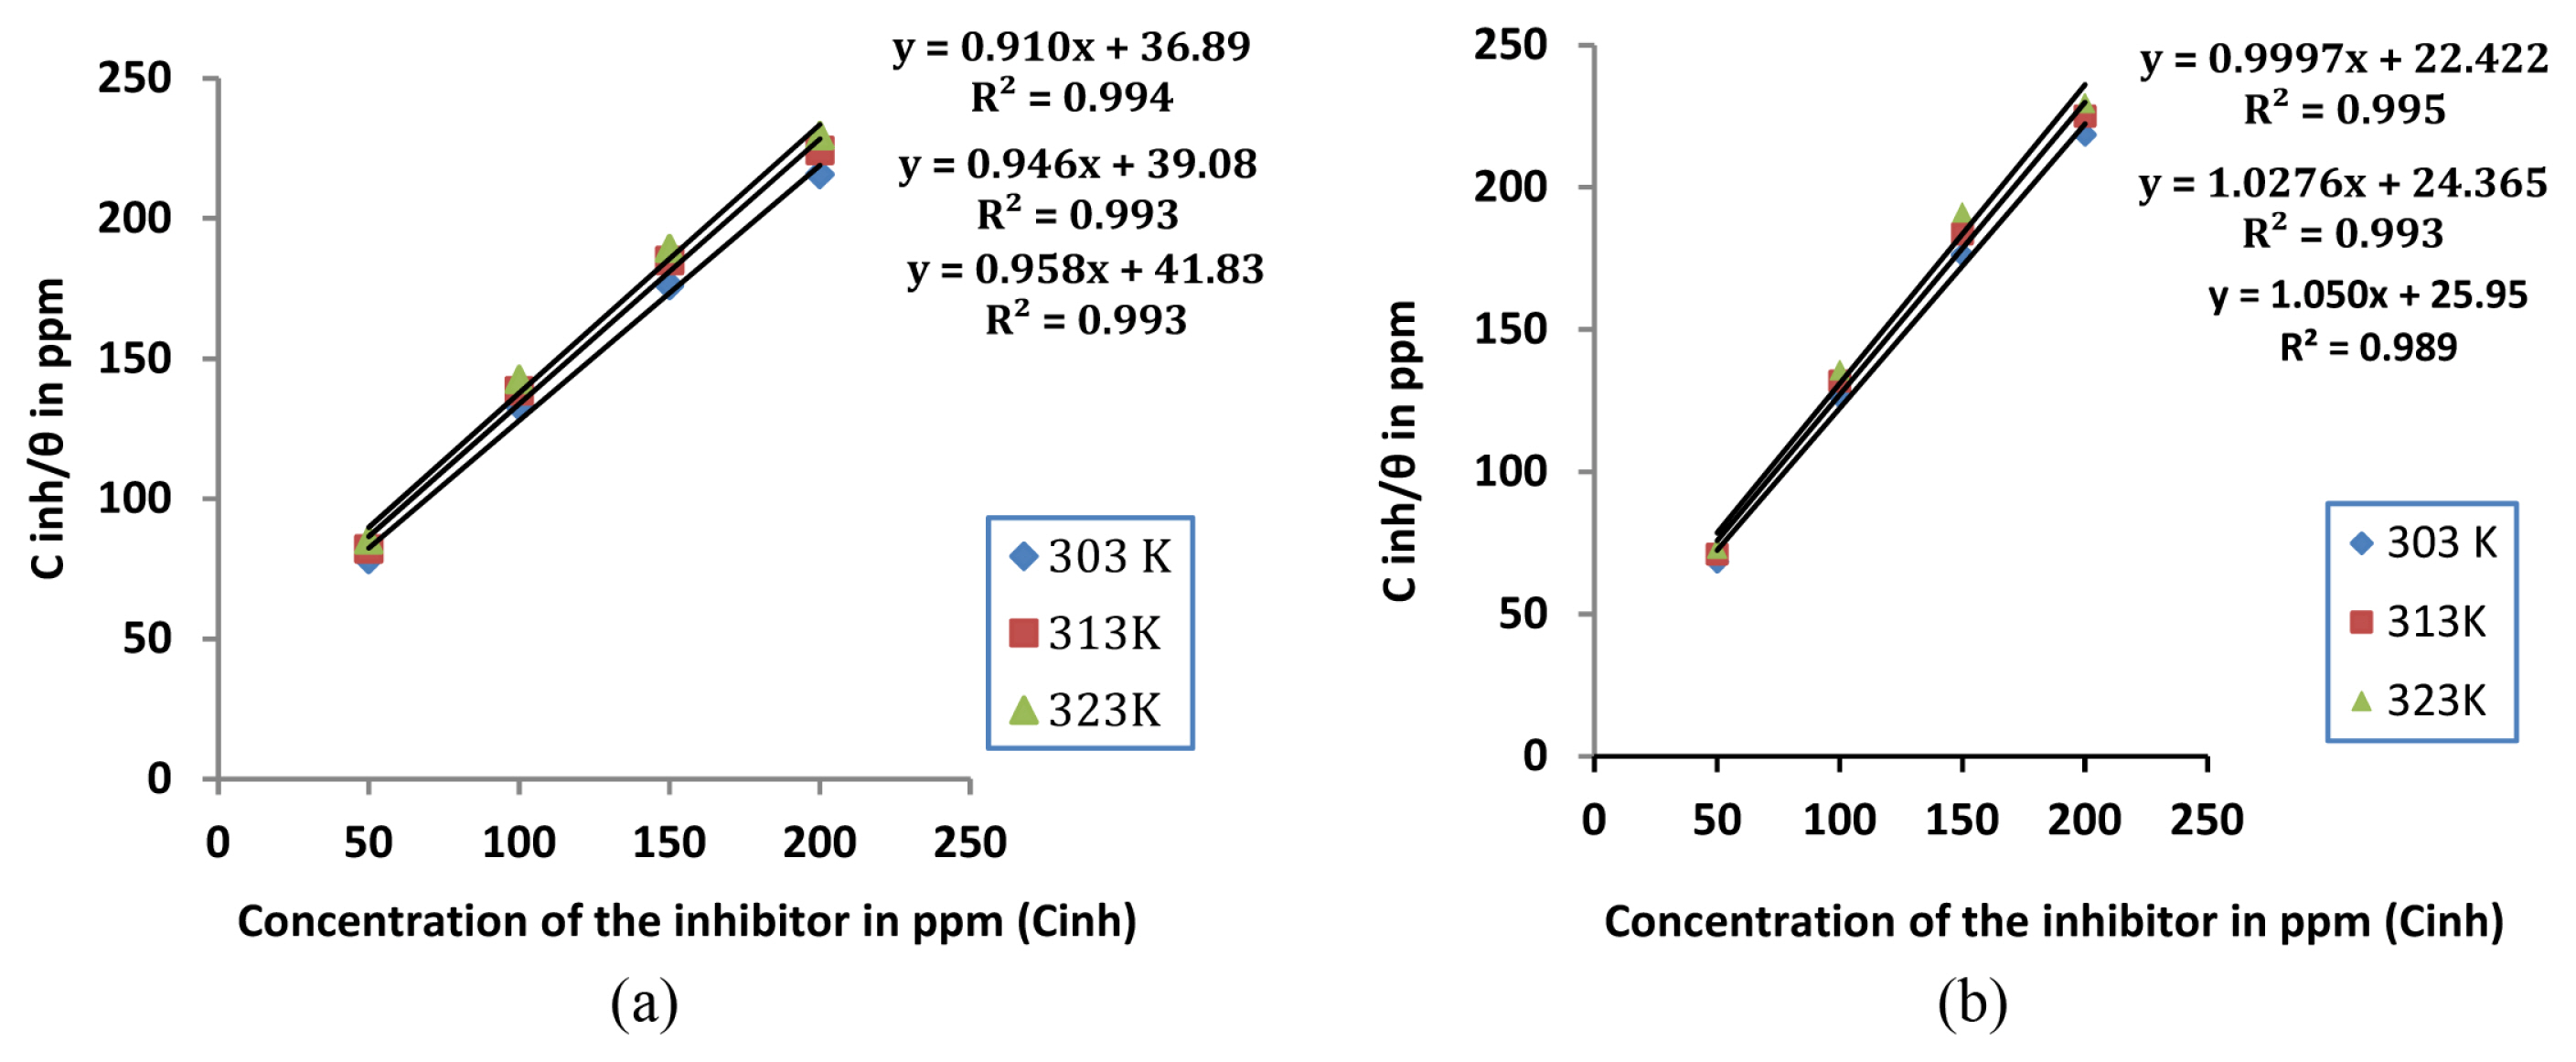
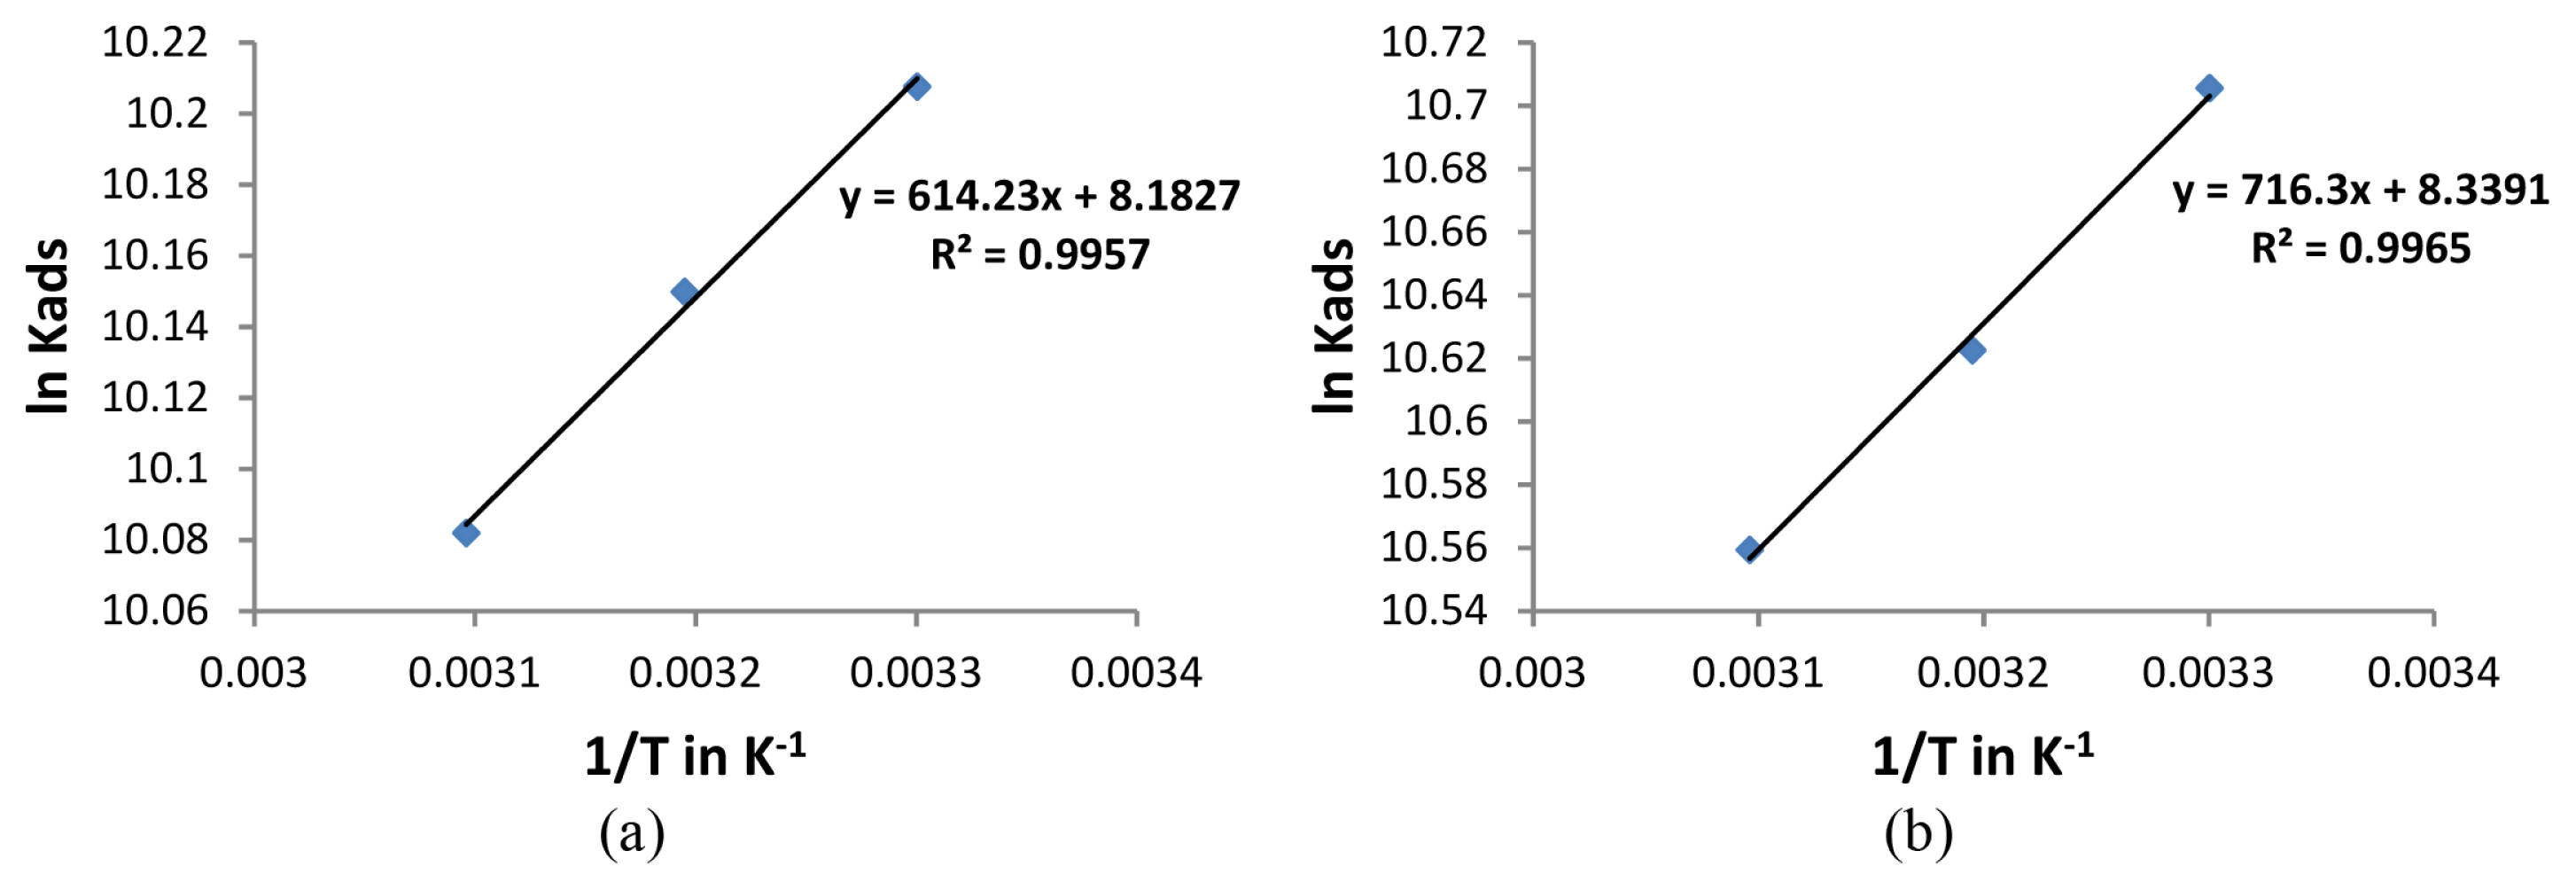
The mechanism of corrosion inhibition can be best explained using adsorption isotherms. Langmuir, Frumkin, Temkin and Freundlich isotherms are frequently employed for the study. In the present study, the surface coverage θ (IE %/100) for mild steel in 1M HCl in the presence of extracts of leaf and stem as inhibitor was calculated from weight loss measurements conducted at 303K, 313K and 323K. A straight line was obtained when Cinh/θ was plotted against Cinh with R2 value close to unity(Fig 4a and 4b) showing that Langmuir adsorption isotherm is obeyed at all temperatures which is represented by the equation
where Cinh represents the concentration of the inhibitor. Kads is the adsorption equilibrium constant which is obtained from the intercept of Langmuir plot lines. The free energy of adsorption (ΔGads) can then be calculated using the equation
where Kads is the adsorption equilibrium constant [29]. A negative value of ΔGads is indicative of spontaneous reaction and shows that there exists a strong interaction between the adsorbed molecules and the mild steel surface. Further it is generally considered that a value of ΔG around −20 kJ mol−1 or less supports physisorption mechanism involving an electrostatic interaction between the charged inhibitor molecules and metal while values around −40 kJ mol−1 supports chemisorption mechanism involving the formation of a coordinate bond by charge transfer from the inhibitor to the metal surface [30,31]. For the present investigation, calculated value of ΔG ads was between −20kJmol−1 and −40kJmol−1(Table 4), which indicates that the mechanism of adsorption of inhibitor molecules on the metal surface involves a combination of both physisorption and chemisorption [32].
The heat of adsorption (ΔHads) could be calculated according to the Van’t Hoff equation
Figs. 5a and 5b shows the plot of ln (Kads) against 1/T in the presence of leaf and stem extracts respectively and the plots were found to be a straight line. From the slope of the line, ΔHads can be found out. In the present study a negative value was obtained for ΔHads (Table 4) indicating that the mechanism of adsorption is exothermic in nature. The decrease in corrosion inhibition efficiencies at higher temperatures can thus be explained to be due to the exothermic process. An exothermic process indicates the occurrence of either physisorption or chemisorption while in an endothermic process only chemisorption is liable to occur [33].
3.4. UV-Visible Spectroscopy
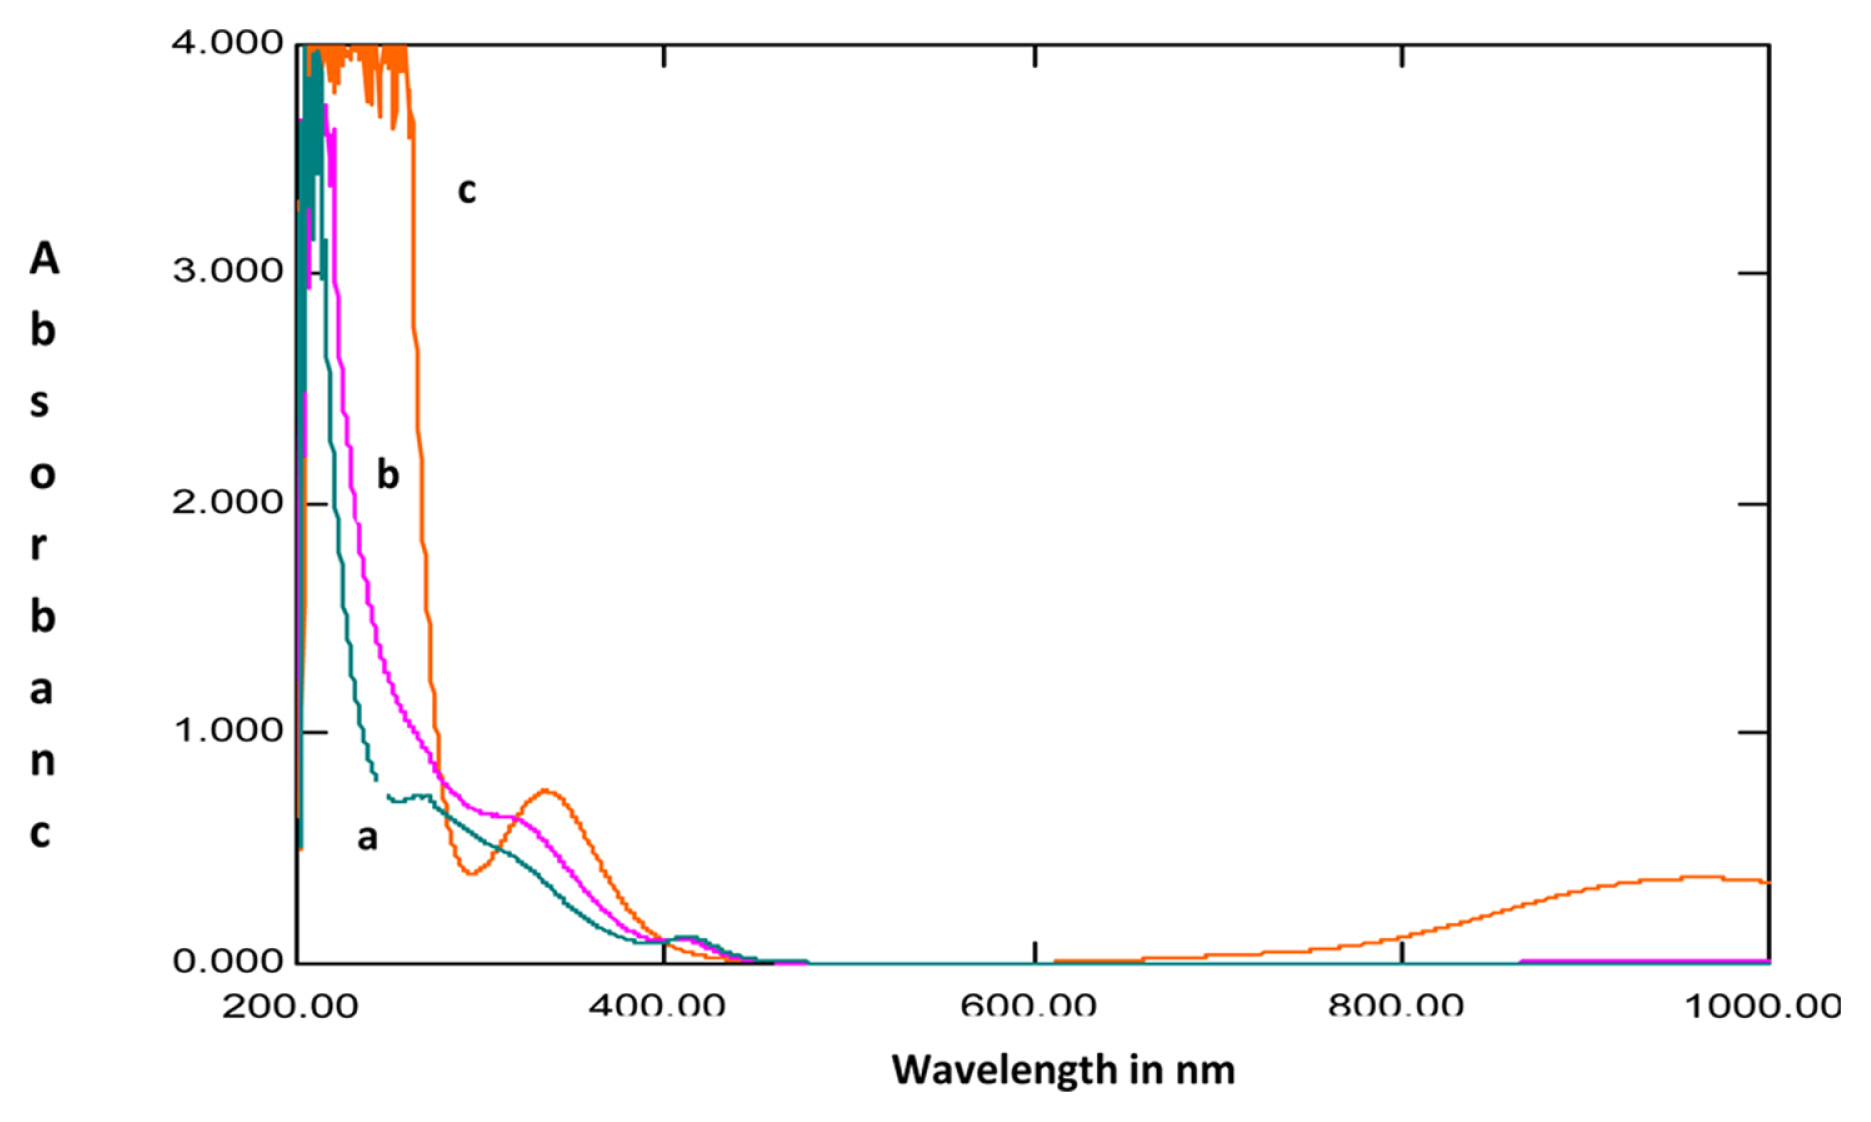
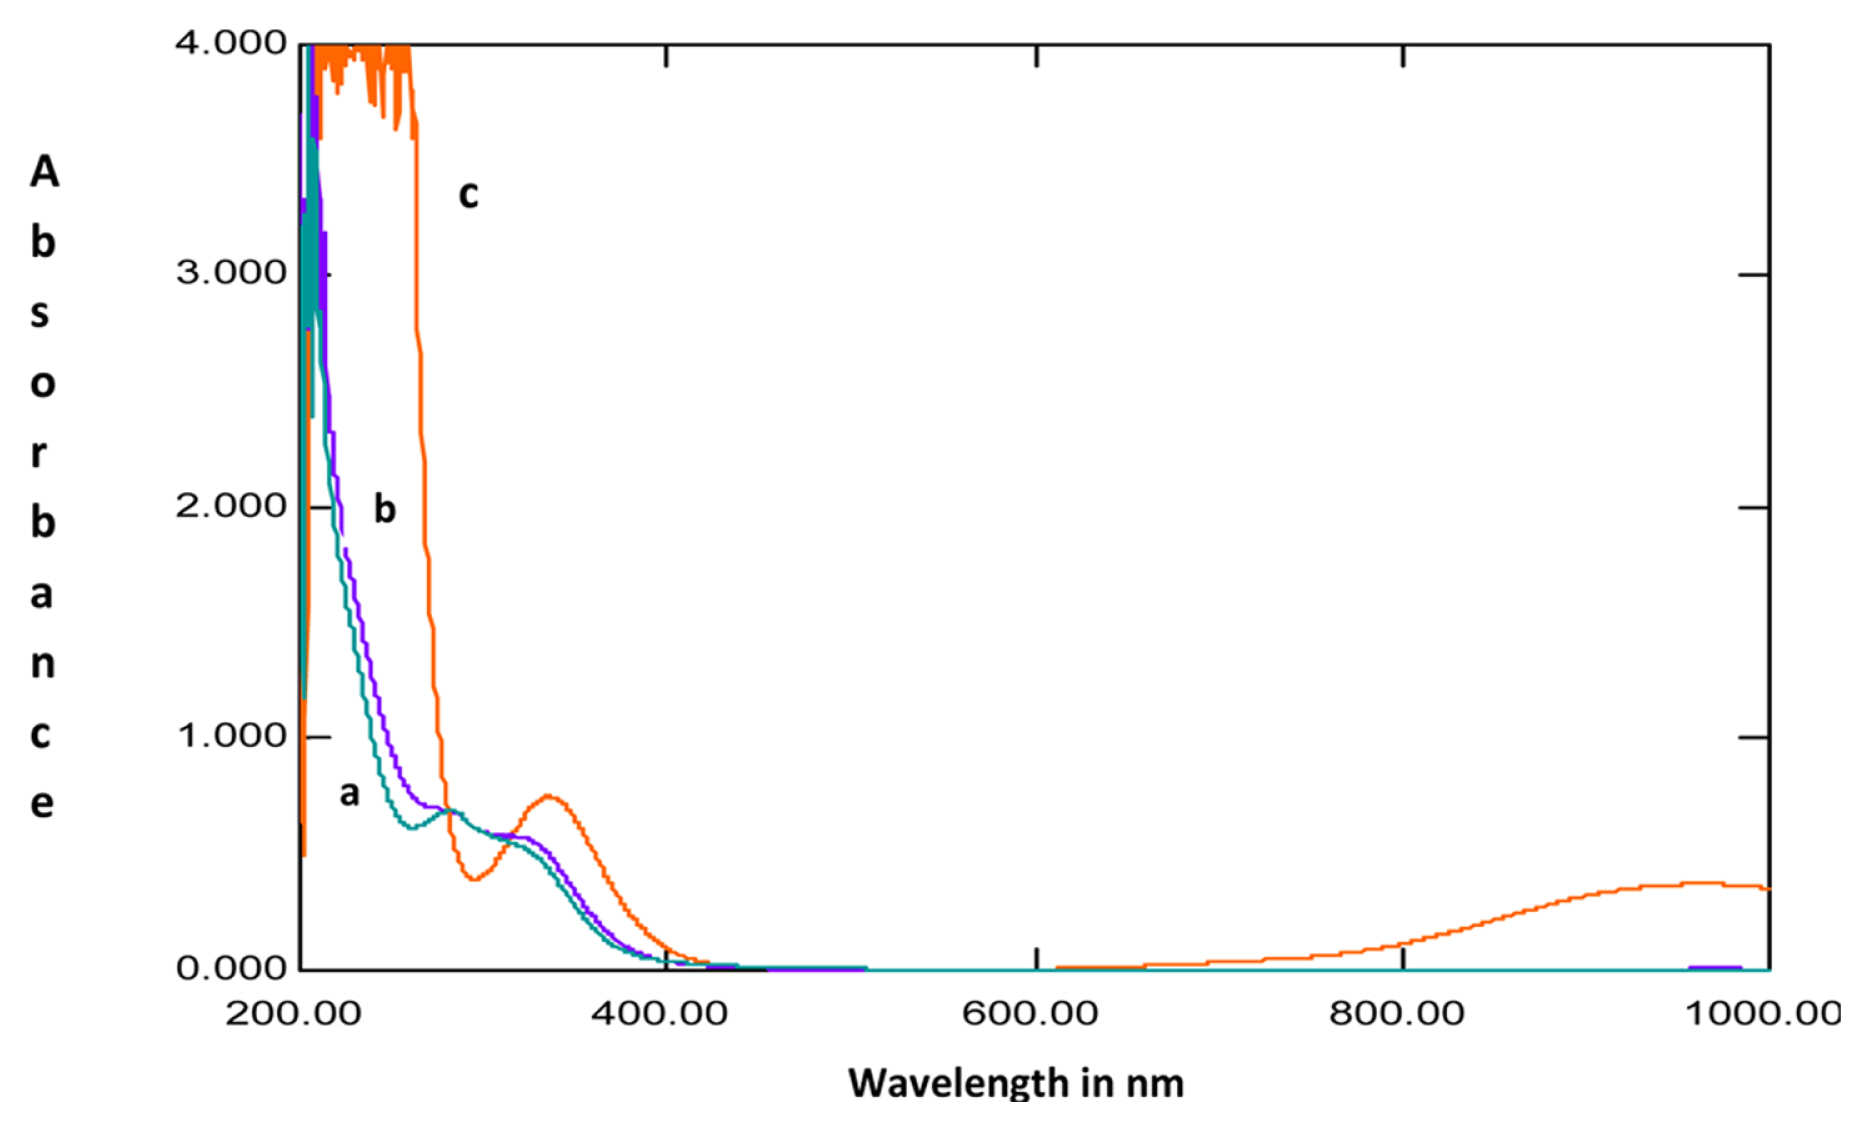
The UV-Visible absorption spectra recorded for 1M HCl solution without the extracts after mild steel immersion and with 200ppm extracts before and after immersion of mild steel are shown in Fig. 6 and 7. The spectra recorded after mild steel immersion without the extracts showed a peak at 335 nm with an absorbance value of 0.754 which indicates the presence of Fe2+ ions in the solution. This observed peak is absent for the spectra recorded in the presence of extracts. Thus it can be inferred that the plant extract is blocking the active sites of mild steel and prevents the dissolution of Fe2+ ions in the solution [34]. It was also observed from the spectra that the absorbance values for the solution with the extracts after mild steel immersion was higher than that observed for the solution before immersion of the specimen. This indicates a complex formation of plant extracts with Fe2+ ions which might be responsible for the anticorrosion behavior of the extracts [35,36].
3.5. FT-IR Spectroscopy
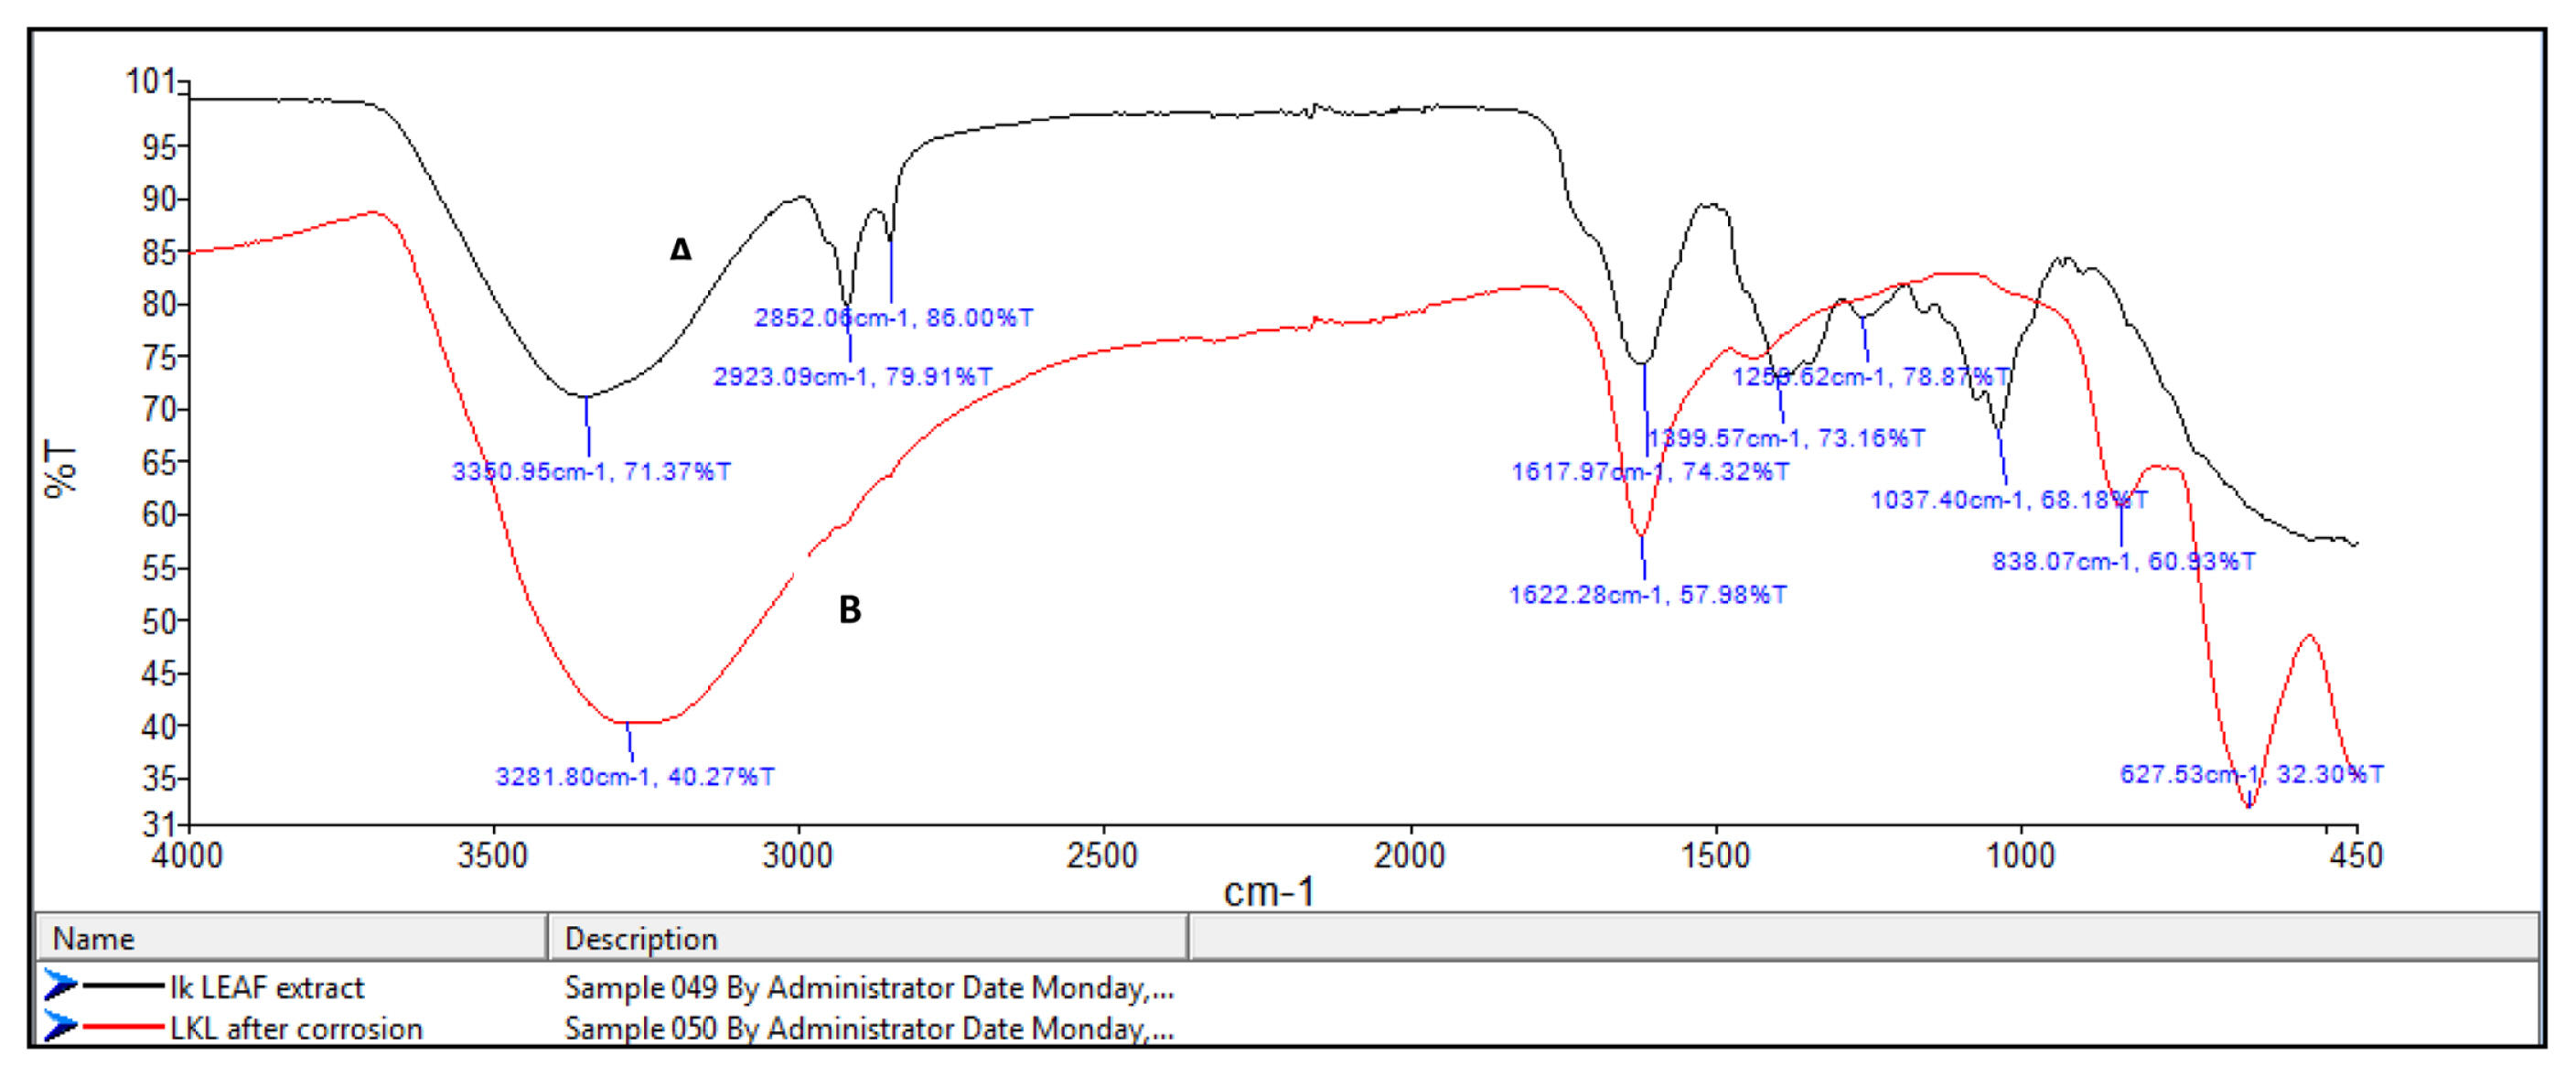
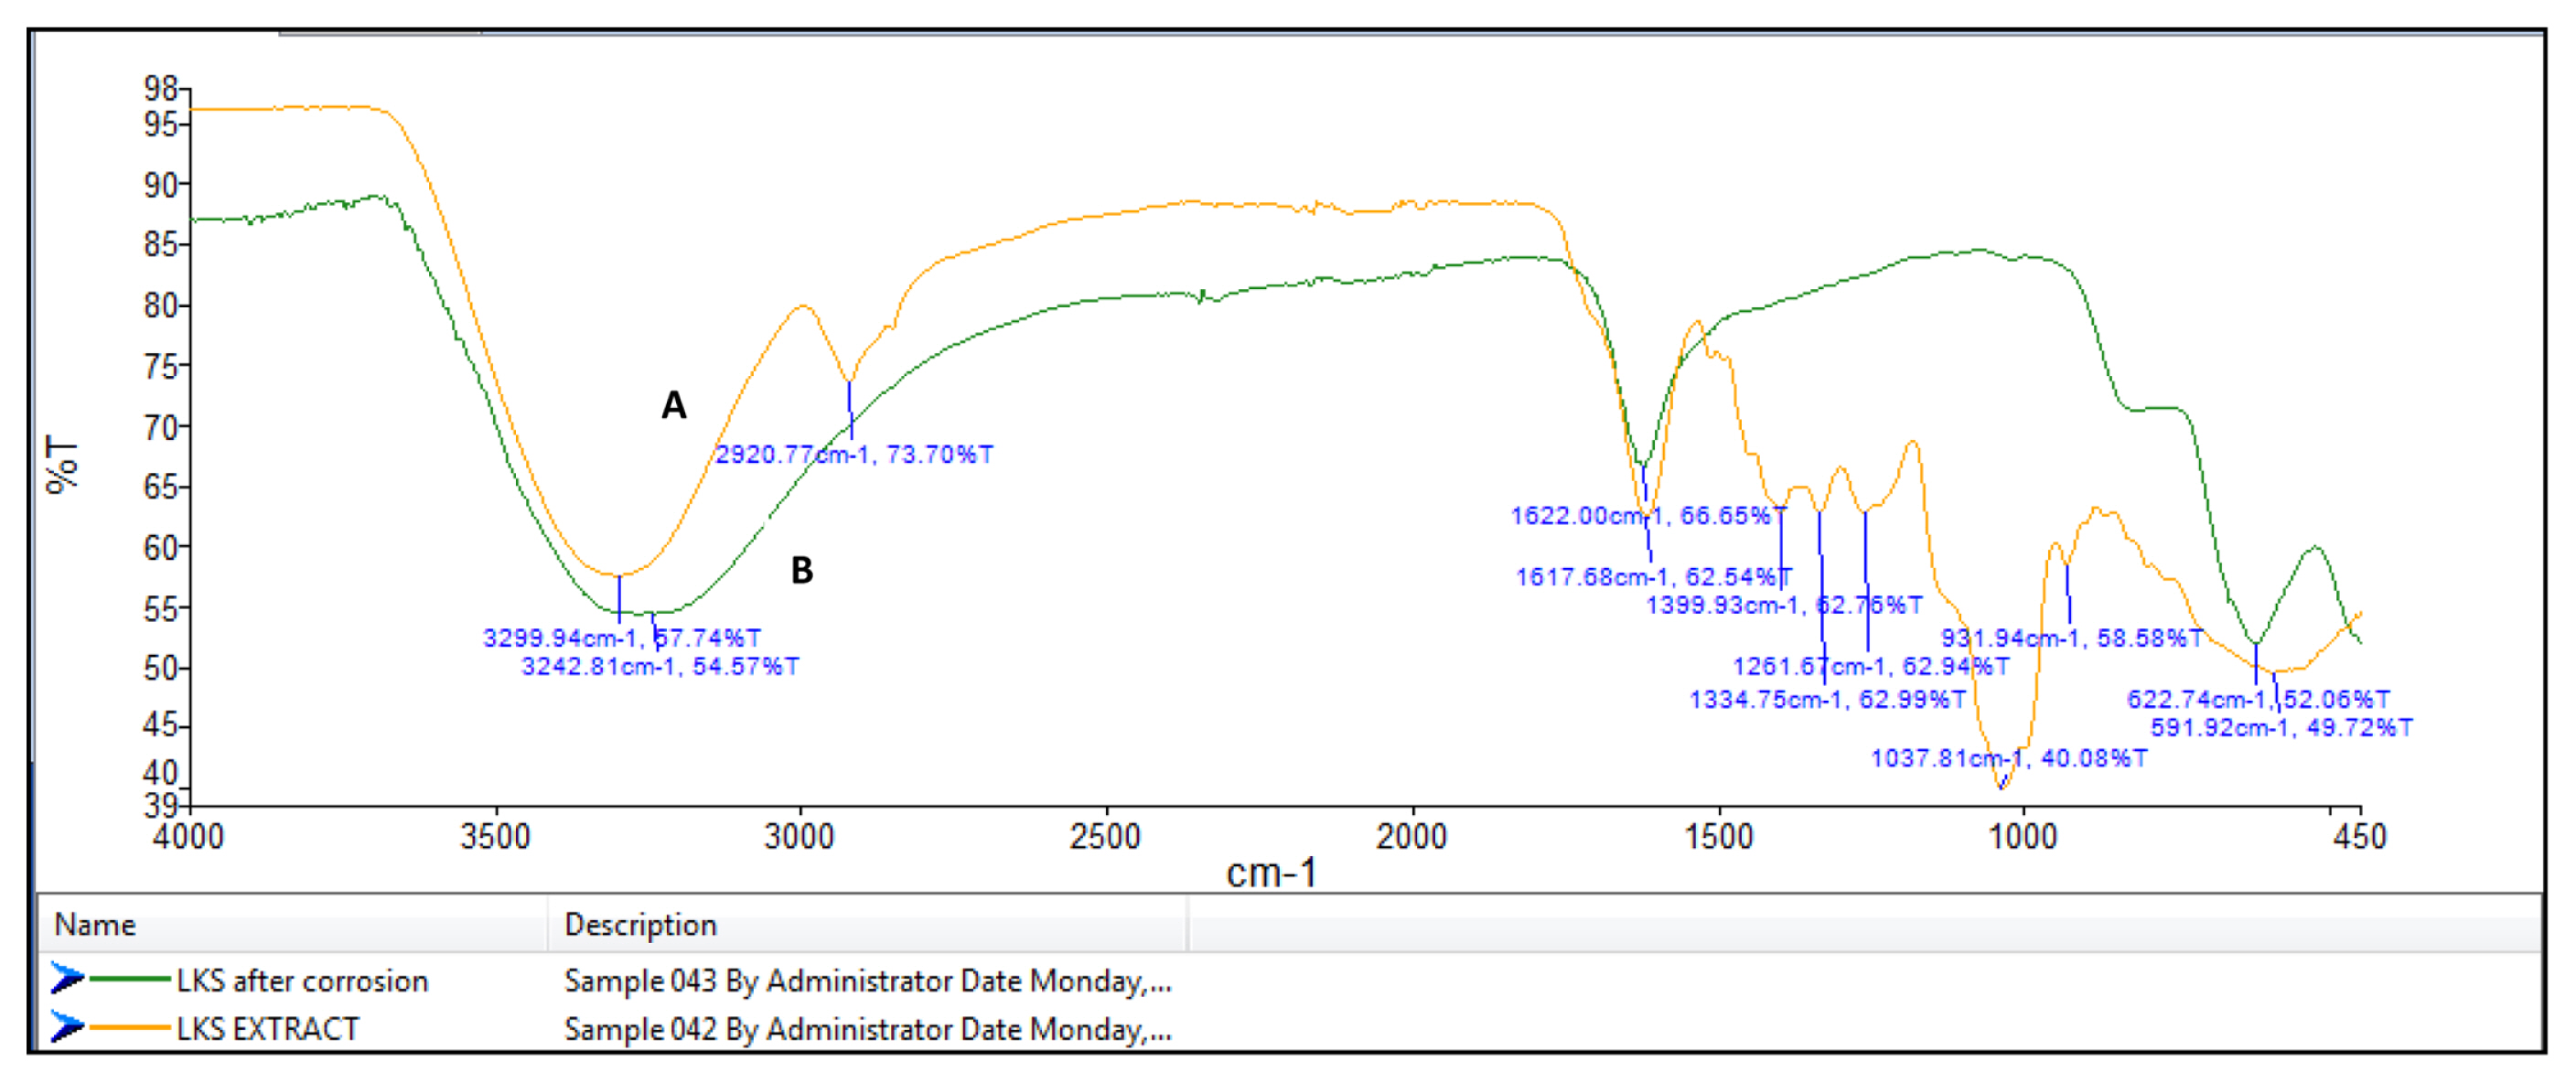
FT-IR spectrophotometers are very useful in identifying the presence of functional groups in organic compounds. The plant extracts which are used here as corrosion inhibitors contain several organic compounds. It is expected that these compounds gets adsorbed on the surface of mild steel and thus protects the metal against corrosion. Thus FT-IR analysis of the surface of mild steel helps in predicting whether the inhibitor molecules are adsorbed or not. Fig. 8a shows the FT-IR spectrum of Lepidagathis keralensis leaf extract and that of the film formed on the mild steel surface after immersion for 24 hours in 1M HCl solution containing 200ppm of leaf extract. Similar plots for Lepidagathis keralensis stem extracts are shown in Fig. 8b.
The FTIR spectra clearly reveal the presence of various functional groups in the leaf and stem extracts. In Fig 8a for the leaf extracts the peak at 3350cm−1 indicates the presence of OH group. The two peaks at 2852cm−1 and 2923cm−1 suggests aliphatic and aromatic C-H stretching. Aromatic C=C stretching is shown by the peak at 1617 cm−1 while the band at 1399 cm−1 shows aromatic C-C stretching. The presence of alcoholic C-O group is shown by the peak at 1260cm−1. Similarly for Fig. 8b the -OH stretching peak is shown at 3299cm−1. C-H stretching vibration is shown by the peak at 2920cm−1. The peak at 1617cm−1 indicates aromatic C=C stretching while the peak at 1261cm−1 shows alcoholic C-O group. The FTIR spectra of the corrosion product formed on the surface of mild steel has also been recorded in the Fig 8a and 8b. It is clear from the spectrum that the product also showed several peaks corresponding to the plant extracts. Thus it can be concluded that there occurs an adsorption of plant extract on the mild steel surface forming a protective layer during corrosion process. It is also noted that there is a shift in the wavelength of absorption values in the corrosion product. For example the peaks at 3350cm−1 and 3299 cm−1for OH stretching have been shifted to 3281 cm−1 and 3242 cm−1 respectively for the leaf and stem extracts. A shift in aromatic C=C stretching absorption is shown by peak shift from 1617 cm−1 to 1622 cm−1. Similar shifts were observed for other absorption values. These shifts indicate the interaction between mild steel and plant extracts. It is also noted that certain functional groups are missing in the spectra of corrosion product which indicates that the adsorption of the inhibitor might have occurred through the missing bonds [37–39].
3.6. Scanning Electron Microscopy
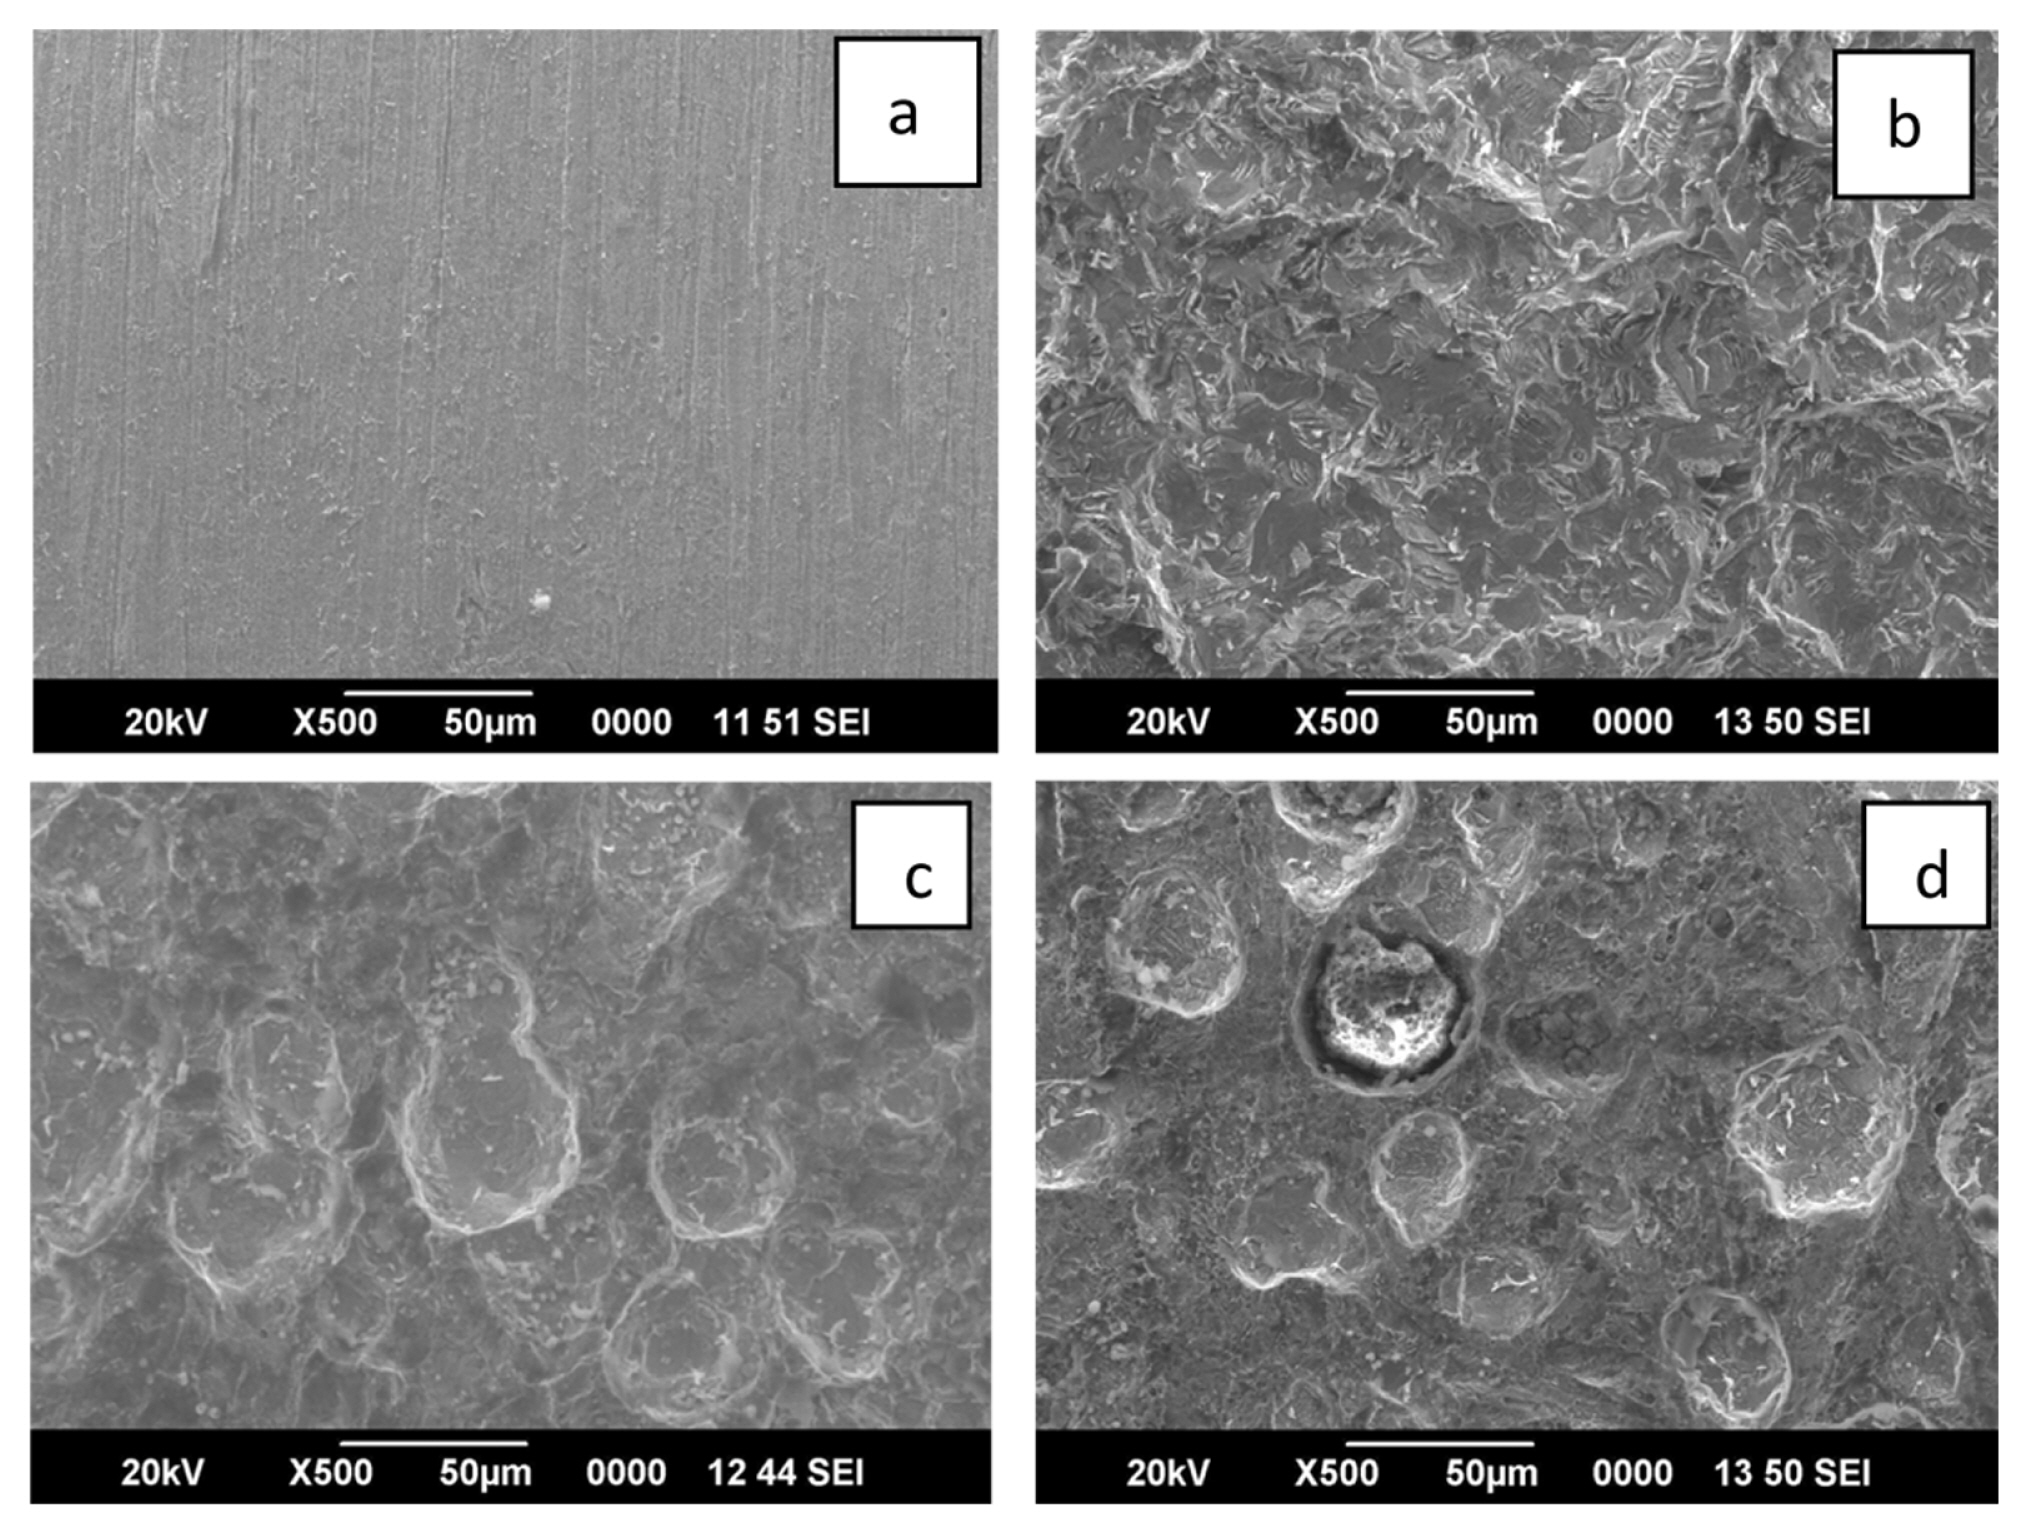
In order to study the interaction of the inhibitor with the mild steel specimen the scanning electron microscopic (SEM) images were recorded. The SEM images of mild steel immersed in 1M HCl with and without the inhibitor are shown in Fig. 8b, 8c and 8d. Fig. 8a shows the SEM image of polished mild steel surface. From the images it is clear that in the absence of inhibitor the surface of mild steel specimens were damaged by corrosive attack of the acid while in the presence of inhibitor the damage has been reduced effectively. Thus the SEM images supports the fact that the extracts of leaf and stem of the plant Lepidagathis keralensis effectively inhibit corrosion of mild steel in 1M HCl by adsorption of inhibitor molecules on the mild steel surface to form a protective film.
3.7. Computational Studies
Phenoxyethene (also known as Benzene, (ethenyloxy)-) was identified as one of the major phytochemical in the methanolic extract of Lepidagathis keralensis by GC-MS analysis [16]. In order to study the inhibition property of selected molecule quantum chemical calculations were carried out. The optimized geometry, HOMO and LUMO of Phenoxyethene are shown in Fig. 9. The various quantum chemical parameters calculated on the basis of optimized structure are shown in Table 6.
Corrosion inhibition property of a molecule can be very well explained by investigating the HOMO and LUMO of the selected molecule [40]. The HOMO (Highest Occupied Molecular Orbital) is often associated with electron donation capability of the molecule. A high value of EHOMO shows high electron donating capacity of the inhibitor to the unoccupied orbital of the metal which in turn signifies high corrosion inhibition efficiency. The LUMO is associated with the ability to accept electrons from the metallic surface. A low value of ELUMO implies greater tendency to accept electrons and hence greater corrosion inhibition property [41,42]. From Table 6 it is found that Phenoxyethene has a high EHOMO value (−6.22 ev) which indicates the tendency of the molecule to donate electrons to the unoccupied orbital of Fe atom. The low value of ELUMO (−0.46 ev) in turn indicates its ability to easily accept electrons from the metal surface. Thus the high value of EHOMO and low value of ELUMO supports the corrosion inhibition property of Phenoxyethene.
ΔE value (energy difference between ELUMO and EHOMO) is also an important parameter in deciding the corrosion inhibition efficiency. As ΔE decreases the inhibition efficiency increases as only a low energy is required to remove an electron from HOMO [43]. In the present case, ΔE for Phenoxyethene is only 5.76 ev which is a low value indicating effective inhibition against corrosion [44,45].
Other chemical reactivity parameters such as electronegativity (χ), global hardness (η), global softness (σ) and fraction of electrons transferred from the inhibitor molecule to the metal surface (ΔN) were also determined from the values of HOMO and LUMO.
The parameter χ is related to chemical potential. High value of χ (3.34 ev) implies better corrosion inhibition [46]. Global hardness and softness also helps in explaining the reactivity of molecules. Chemical hardness represents resistance towards polarization of the electron cloud of atoms, ions or molecules under small disturbances of chemical reaction. Hard molecules has more energy gap and are less reactive while soft molecules have low energy gap and are more reactive [47]. In our study, Phenoxyethene has a low hardness value of 2.88ev and high softness value of 0.35ev which indicates better polarisability and hence good corrosion inhibition property.
ΔN value was calculated using the theoretical values of χFe (7ev) and ηFe (0). When ΔN>0, there occurs transfer of electrons from inhibitor molecule to the metallic surface. It is reported that the electron donating ability increases when the value of ΔN is less than 3.6 [48,49]. In our study the ΔN value obtained was 0.64, which indicates that the inhibitor molecule can easily donate electrons to the vacant d orbital of the metal atom.
4. Conclusions
From the present investigation it can be clearly concluded that the methanolic extracts of the leaf and stem of the plant Lepidagathis keralensis acts as good corrosion inhibitor for mild steel in 1M HCl. The inhibition efficiencies were found to increase with increase in concentration of the inhibitor and the data obtained in the different methods of analysis such as weight loss, EIS and polarization methods are in good agreement. Adsorption of inhibitor molecules on the surface of mild steel was considered to be responsible for the protection against corrosion. This was confirmed by UV-Visible Spectroscopic and SEM analysis methods. Adsorption was found to obey Langmuir adsorption isotherm. A negative value obtained for the free energy of adsorption, ΔGads indicates the spontaneity of the adsorption process. It was also observed that the inhibition efficiencies of the inhibitor decreased on increasing the temperature which is due to desorption of inhibitor molecules from the mild steel surface at higher temperature. A negative value of heat of adsorption (ΔHads), indicating the exothermic nature of the process also supports this fact. Polarization studies revealed that the extracts behaved as mixed type inhibitors affecting the anodic dissolution of the metal and cathodic hydrogen evolution. Quantum chemical studies also support the experimental investigations. Corrosion inhibition property of a plant extract is due to synergistic interaction of several components present in the extract. Hence theoretical calculations based on a single component are not adequate to explain the inhibition potential of an extract. But in order to gain an insight into the corrosion inhibition property of Lepidagathis keralensis plant, we have done DFT based calculations on one of the major components of the leaf extract. The quantum chemical parameters obtained support the inhibition potential of the plant.