1. Introduction
AA2024 is an aluminum alloy containing Cu that is typically coated in the aerospace applications [1]. The high strength of the alloy arises from the insertion of Cu into Al matrix. In the meanwhile, the presence of Cu significantly lowers the corrosion resistance of the alloy due to the formation of numerous intermetallic phases (such as Al2CuMg, Al2Cu and Al20Cu2(MnFe)3) [2,3]. The decreased resistance results from the formation of complex galvanic couples between the different intermetallic phases and Al matrix. In order to enhance the corrosion protection, the alloy surface can be coated with an organic coating [4]. The corrosion properties of the uncoated alloy have been widely studied in the literature [5ŌĆō8], but fundamental studies of coated AA2024 are more scarce [1,9].
Conducting polymers have found considerable applications in science and technology because of both the ease of their preparation and their interesting properties [10ŌĆō15]. Polypyrrole (PPy) as a conducting polymer has good mechanical properties, high stability and eco-friendly features [10,16].
Electropolymerization as a cheap and clean method for PPy synthesis allows preparing an adherent and protective coating on the metal and alloy surfaces [10,17,18]. Electrosynthesis of PPy film on a metallic surface such as aluminum needs the appropriate electrolyte namely oxalic acid due to the dissolution of the surface at the oxidation potential of the pyrrole monomer [19].
Various methods of synthesis of polypyrrole have been reported in the literature [20ŌĆō22]. Electropolymerization is a widespread method for the synthesis of PPy including three different modes of polymerization/ deposition, namely, cyclic voltammetry (CV), galvanostatic (GS), and potentiostatic (PS) deposition [23]. The PS mode is based on applying a constant potential in order to avoid the occurrence of side reactions at the electrode surface whereas the GS mode is based on a constant current which is independent of the system resistance, thus suitable for deposition of films on large surface areas. The most important advantage of the CV mode of PPy deposition is the pause in the deposition between each CV cycle leading to a discontinuous growth and the potential sweep of the growing film which is expected to produce uniform PPy microstructures [21,22].
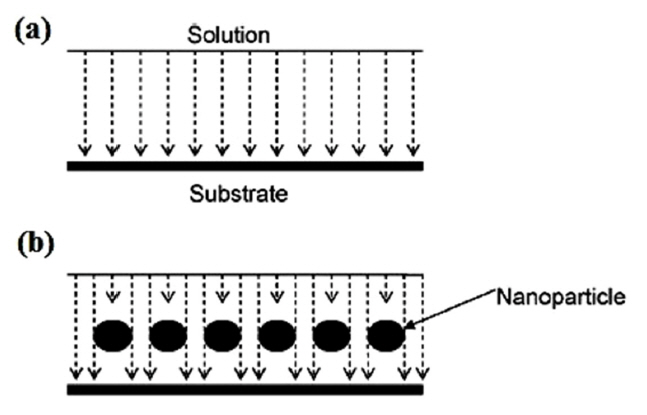
When nanoparticles are added to a coating, the micropores of the coating are filled by them and thereby, the diffusion through the nanoparticle-doped coatings is slowed down because the nanoparticles prevent uniform diffusion and introduce the mechanism of non-uniform diffusion (Fig. 1) [24].
Nowadays, the performance of PPy coatings has been improved by doping nanoparticles. The nanoparticle-doped coatings have been exhibited good corrosion resistance at short times, but the long-term corrosion protection is not easy to achieve [25].
Electrochemical impedance spectroscopy (EIS) is a powerful nondestructive tool for evaluation of coating properties and their changes with exposure time [26]. Linear polarization resistance (LPR) is a nondestructive and simple technique that can be used for long-term monitoring of corrosion protection. The LPR technique almost overcomes the destructive nature of polarization techniques since only the small region near Vcorr is of interest [27,28].
In the present work, the PPy coatings were doped with nanosized metal oxides including TiO2 and CeO2 nanoparticles and Nd2O3 nanorods. Then the EIS and LPR methods were employed to evaluate the effect of the doped PPy coatings on the corrosion protection of AA2024 Al alloy in the solutions of 0.1 M H2SO4 and 3.5% NaCl.
2. Experimental
2.1. Materials
The TiO2 nanoparticles (surface area = 65 m2 gŌłÆ1 and particle size = 21.0 nm) and CeO2 nanoparticles (with an average diameter of 10ŌĆō20 nm) were purchased from Sigma Aldrich and all other chemicals and solvents were procured from Merck. Purification of pyrrole was performed by distillation under vacuum and then it was stored in a refrigerator around 0┬░C. All solutions were prepared from deionized water.
2.2. Methods
2.2.1. Preparation of Nd2O3 nanorods
Nd2O3 nanorods have been electrosynthesized by cathodic pulse electrochemical deposition technique. The conventional three-electrode cell was used. The saturated calomel electrode (SCE) was employed as a reference electrode, 316 stainless steel (100├Ś50├Ś0.5mm) as a working electrode centered between two parallel graphite plates (100├Ś50├Ś5mm) as the counter electrodes.
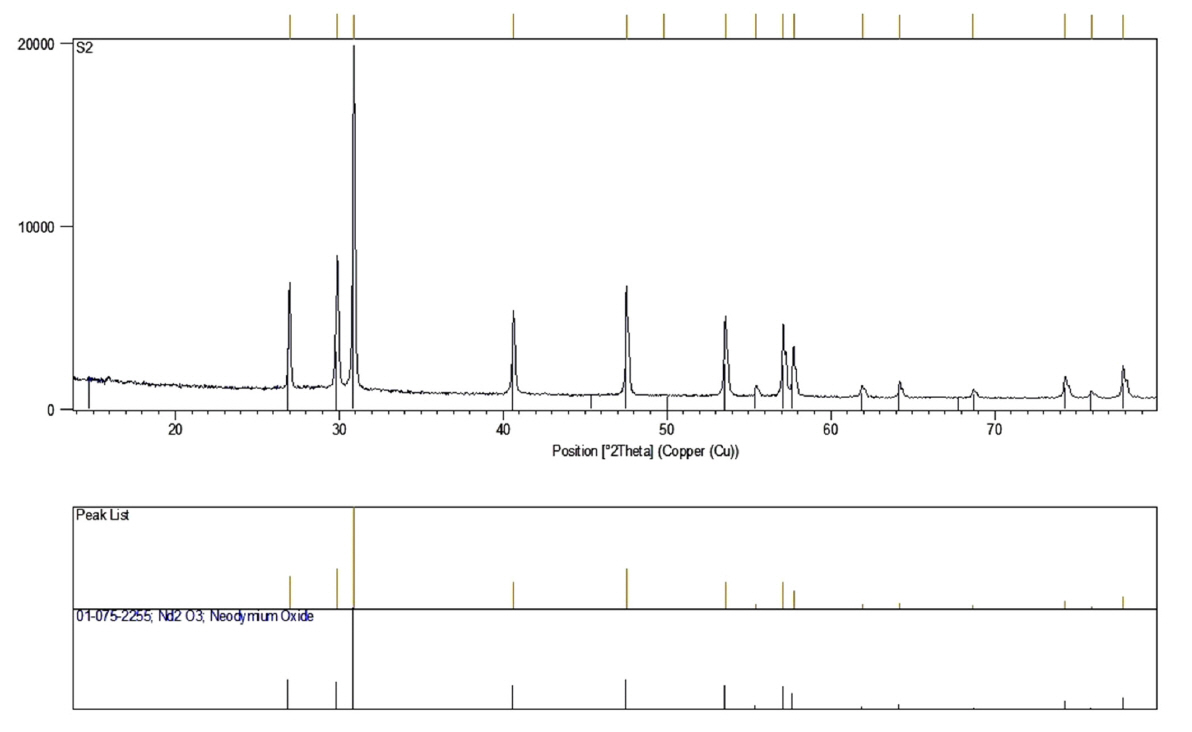
The electrolyte solution was 0.005 M Nd(NO3)3┬Ę6H2O. The square wave potential (ŌłÆ2.1 V vs. SCE) was applied in the cathodic electrodeposition. The experiment was performed at the current density of 5 mA/cm2 and ton = toff = 1 ms for 10 min at 353 K and pH=4.2. The stainless steel electrodes were washed after electrodeposition process and then dried at room temperature for 24 h. The gel deposits were scraped from the surface of the steel electrode. The scraped gels were subjected to heat-treatment at 1000┬░C for 5 h by an electrical furnace with the heating rate of 10┬░C/min. FESEM image of Nd2O3 nanorods is shown in Fig. 2. Fig. 3 shows the XRD pattern of as prepared Nd2O3 nanorods.
2.2.2. Preparation of PPy coated samples
A disk of AA2024 (100 mm2), a platinum rod and a saturated (KCl) Ag/AgCl were used as working, counter and reference electrodes, respectively. Before performing electropolymerization, the working electrode was polished by wet abrasive papers (600ŌĆō2500 grades) and washed with ethanol to degrease it.
The PPy electrosynthesis was performed on the surface of the AA2024 electrode immersed in 0.3 M oxalic acid + 0.1 M pyrrole solution containing 0.01% nanosized metal oxides by cyclic voltammetry technique in the potential range between ŌłÆ1.0 and +2.5V (vs. Ag/AgCl) at scan rate of 100 mV/s and 25 cycle numbers. The nanoparticle-free coating which was prepared in the absence of nanosized metal oxide was used as the blank. After rinsing with distilled water the PPy coated electrodes were immersed in each of 0.1 M H2SO4 or 3.5% NaCl solutions.
The following equation was used to calculate the thickness of the PPy coating on the electrode surface [29]:
where Q is the electrical charge for electrodeposition of PPy, Mm is the molecular weight of the monomer (67 g/mol), Ma is the molecular weight of the inserted anion (88 g/mol), y is the doping yield of the anions into PPy coating (generally y = 0.3), F is the FaradayŌĆÖs constant, A is the electrode surface area (1.0 cm2) and Žü is the polymer density (1.5 g cmŌłÆ3). The calculated thickness values of PPy films are gathered in Table 1.
2.2.3. Corrosion tests
In the EIS measurements, a sinusoidal potential signal of 10 mV amplitude versus open circuit potential (OCP) was used in the frequency range of 100 kHz-10 mHz. A conventional three-electrode cell was employed to measure the EIS data by a potentiostat/galvanostat (Autolab Model PGSTAT-302N). The coated AA2024 sample was used as the working electrode, a platinum rod as the counter and a saturated (KCl) Ag/AgCl electrode as the reference electrode. The impedance spectra were analyzed by fitting the experimental data to the equivalent circuit using Nova 1.9 software.
LPR measurements were performed by recording the current arising from the scanning of potential from ŌłÆ25 to +25 mV around OCP value at a scan rate of 1.0 m V/s. The polarization resistance, Rp, was determined from the slope of the obtained current versus potential plots in the vicinity of OCP.
3. Results and Discussion
3.1. Sulphuric acid solution
3.1.1 EIS measurements
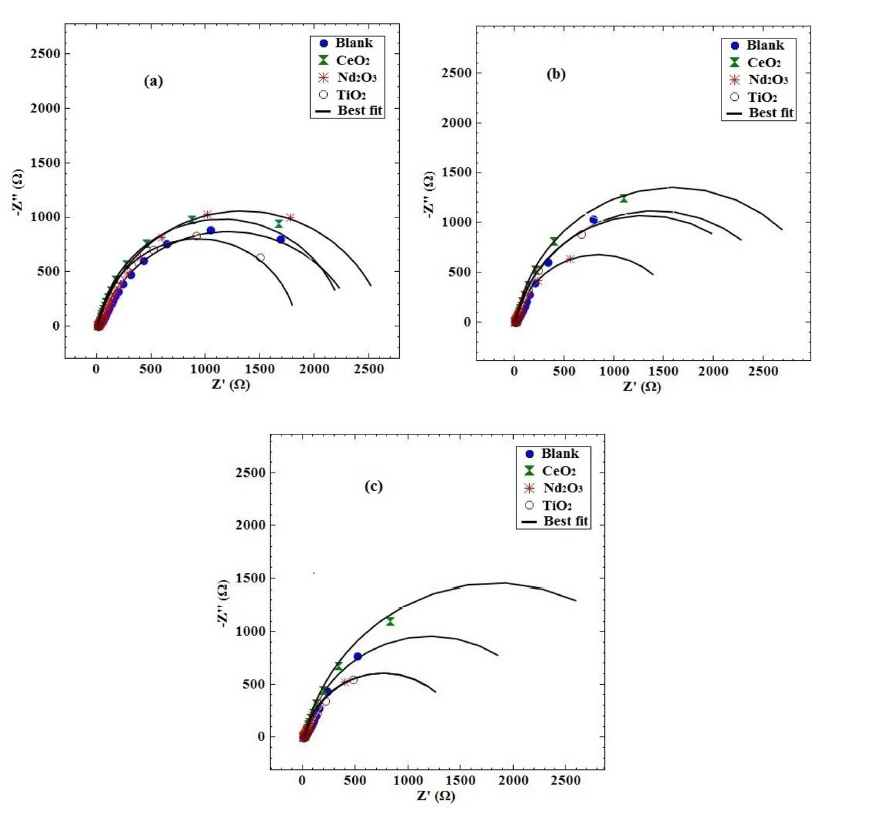
The corrosion protection of coated samples has been widely evaluated by EIS technique [30ŌĆō32]. Fig. 4 presents the Nyquist plots of different coating samples obtained at various exposure times after immersing in H2SO4 solution.
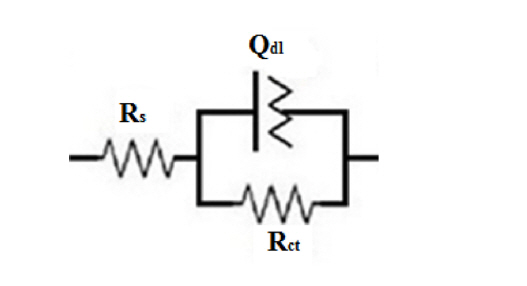
Recently, a new equivalent circuit (EC) was porposed for the modeling of EIS data concerning the alloy surface coated with PPy which can be simplified to one of the simple equivalent circuits concerning the corrosion behavior of PPy coated alloy in the case of short-term, medium-term and long-term immersion periods [15]. The short-term EC (Fig. 5) is suitable to employ for fitting the impedance data up to 72 h after immersion time. This is due to the presence of only one semicircle in the Nyquist plots, related to the charge transfer from the metal to the polymer/solution, and the absence of a second semi-circle at low frequencies. This circuit consists of the double layer capacitance (Qdl) and the charge transfer resistance (Rct) in parallel and connected in series with the solution resistance (Rs). A constant phase element (CPE), Qdl, was used instead of a pure capacitance because of the non-ideal capacitive behavior of the coatings. The impedance function of CPE is given by:
where Y0 is the admittance magnitude of CPE (F.cmŌłÆ2 ┬ĘsnŌłÆ1 or sn┬Ę╬®ŌłÆ1┬ĘcmŌłÆ2), w is the angular frequency and n is the CPE exponent. The CPE is a calculated parameter when the circuit element behaves between capacitor (n=1) and resistor (n=0).
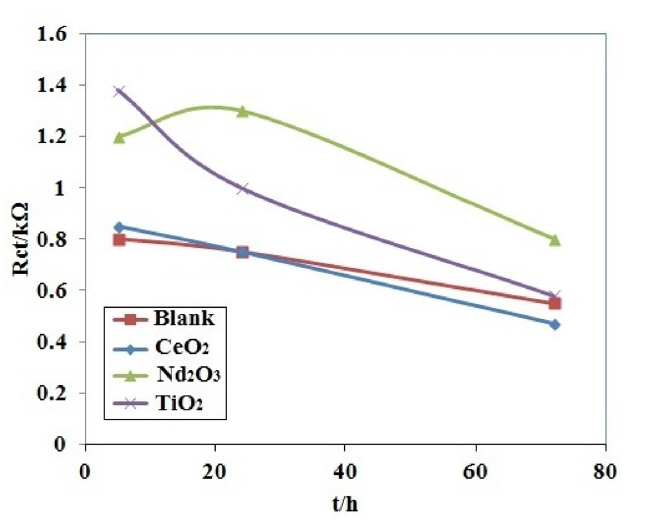
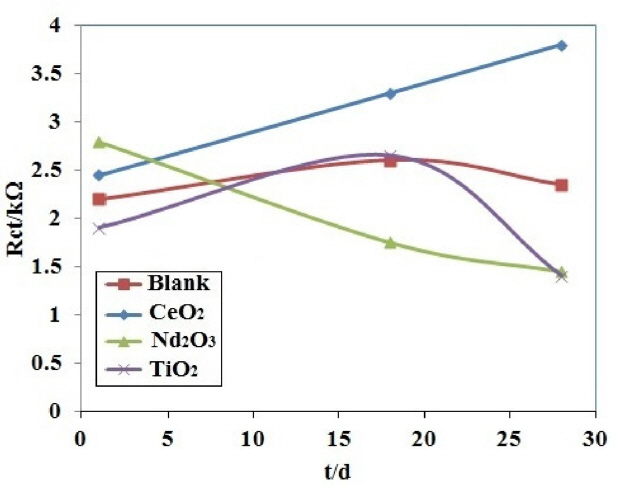
Table 2 shows the fitted impedance parameters for different coating samples. In order to visualize the differences in the corrosion behavior of the coating samples, the fitted values of the charge transfer resistance as a function of exposure time have been plotted in Fig. 6 for different coating samples. The decrease in charge transfer resistance with exposure time is an indication of the electrolyte penetration through the coating. The decrease in charge transfer resistance is significantly less for the coating with Nd2O3 nanorods than the other coatings. It is noticeable from Fig. 6 that the resistance of the coating containing Nd2O3 after 72 h exposure is as the same as the blank coating during 5 h of exposure. It seems that the Nd2O3 nanorods in the coating significantly increased the charge transfer resistance and slowed down the electrolyte penetration through the coating.
The effect of different nanosized metal oxides on the corrosion behavior of coated samples in H2SO4 solution can also be evaluated using protection efficiency (PE) values, which are calculated by the following equation [33]:
where and RctŌĆ▓ are the charge transfer resistances of the coated samples with and without nanosized metal oxides, respectively. Table 2 presents the calculated PE values for different coating samples. The charge transfer resistances, Rct, for each set of four coated samples at a certain time of immersion were used for calculating the PE values of the coatings at that time. According to the PE values in Table 2, the Nd2O3 sample provided the highest corrosion protection at any time of immersion up to 72 hours after immersion in H2SO4 solution. All of these observations reveal that the Nd2O3 sample is the most efficient coating.
Based on the EIS results, the effect of the nano-sized metal oxides on the barrier properties of the PPy coating samples immersed in H2SO4 solution are ranked as follows: Nd2O3 > TiO2 > CeO2 ~ blank. Therefore, it can be concluded that the Nd2O3 nanorods strongly improve the barrier properties of the PPy coating samples in H2SO4 solution, and provide a better anti-corrosion performance in comparison with other nanosized metal oxides. This is due to the fact that Nd2O3 dissolves in sulfuric acid solution to form the precipated neodymium sulfate [34]. In this way, the retarding of the corrosion activity of coating containing Nd2O3 nanoparticles after immersion in H2SO4 solution can be attributed to the formation of a stable surface layer of insoluble neodymium sulfate.
3.1.2 Linear polarization measurements
Linear polarization technique can be employed as an alternative method to verify the EIS results. Linear polarization resistance measurements enable the calculation of polarization resistance and hence the corrosion protection of coating samples. In the LPR measurements, a potential sweep from ŌłÆ0.025 to +0.025 V versus open circuit potential (OCP) at the sweep rate of 1.0 mV/s was employed and the polarization resistance (Rp) was measured from the slope of overpotential, h, versus i plot at the corrosion potential (h=0).
The protection efficiency has been calculated from the measured polarization resistance values using the equation:
where and RpŌĆ▓ are the polarization resistance values of the coated samples with and without nanosized metal oxides, respectively.
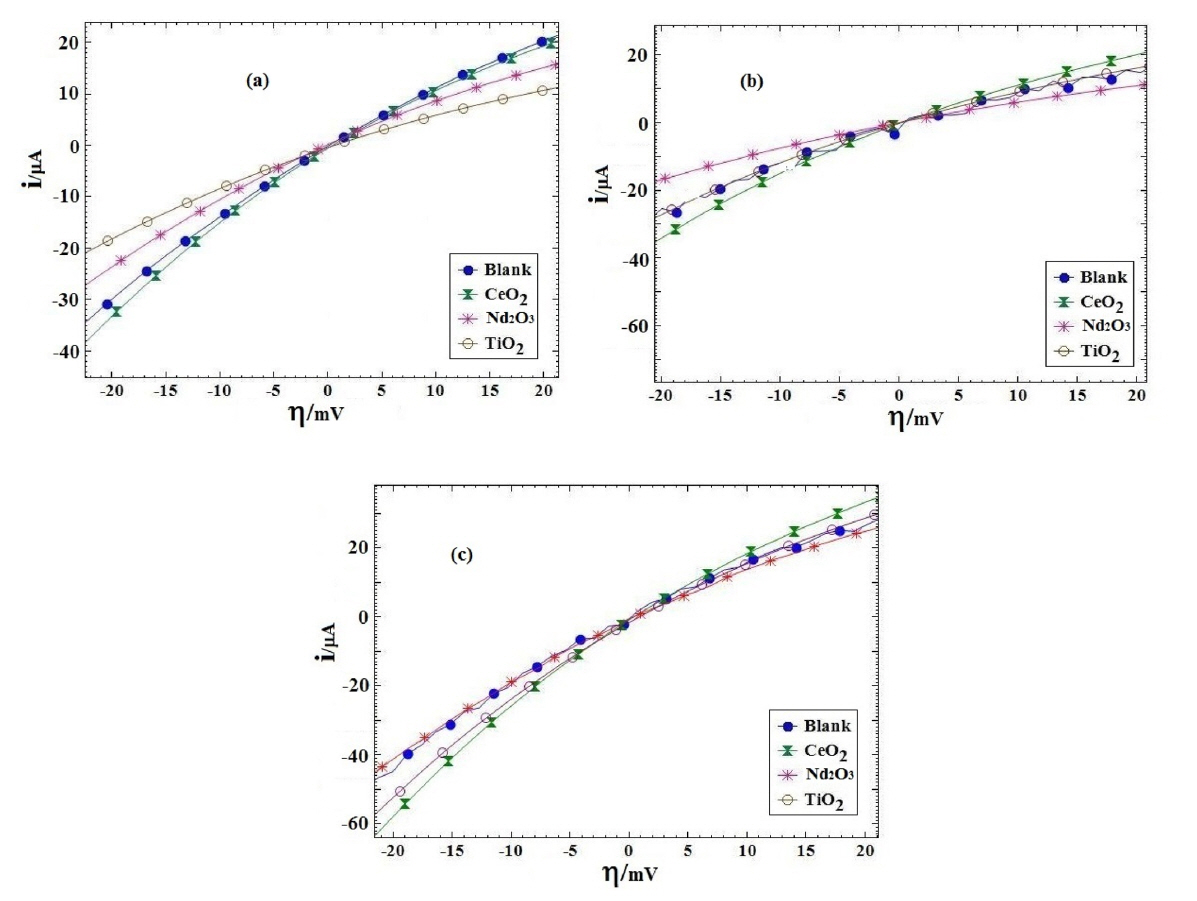
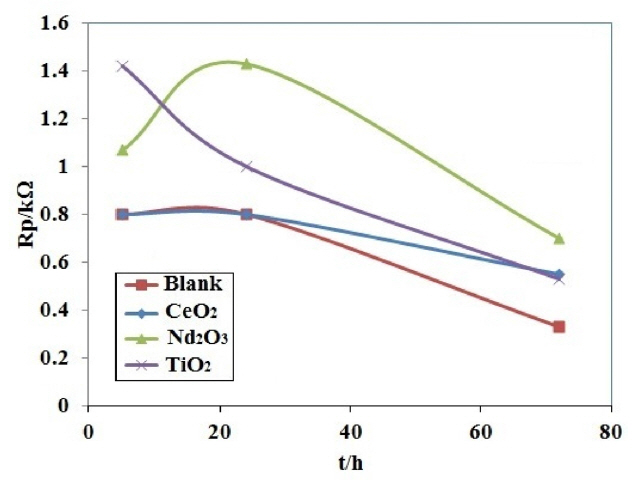
Fig. 7 presents i-h plots resulted from PPy coated AA2024 samples after immersing in H2SO4 solution at various exposure times. Table 3 lists the polarization resistance Rp and the calculated PE values for different coating samples. The polarization resistances of different coating samples were plotted versus exposure time in Fig. 8. As shown in Fig. 8 and Table 3, the blank coating sample had the lowest polarization resistance when compared to the other samples, which might be attributed to the higher coating deterioration due to the electrolyte penetration into the coating. On the other hand, the polarization resistance of the Nd2O3 coating sample was higher than that of the other samples after 72 h from immersion time. These results showed that the Nd2O3 coating sample displayed better anticorrosive properties than the other coating samples.
In agreement with the EIS results, the LPR data proved that the Nd2O3 nanorods play an important role in delaying the penetration of acid solution through the coating, and thus enhance the barrier property. The decrease in Rct during immersion time was due to the penetration of the electrolyte through the PPy coating and undercoating corrosion occurring.
3.2. Sodium chloride solution
3.2.1 EIS measurements
Fig. 9 shows the Nyquist diagrams of the PPy coating with and without various nanosized metal oxides after different times from immersion in 3.5% NaCl solution. It is clear that there is only one semicircle in the Nyquist diagram. Therefore, the short-term EC (Fig. 5) should be employed for fitting the impedance data.
Table 4 lists the impedance parameters for different PPy coating samples. Fig. 10 shows the Rct vs. time plot of the coating samples. The Rct value of CeO2 coating sample was higher than that of the other coating samples after 28 days from immersion time. In addition, for the CeO2 coating sample, Rct increases rapidly from 1 day to 28 days after immersion time. This is due to the inhibition effect of cerium on aluminum alloys. The cerium ions released from CeO2 nanoparticles behave as inhibitor under near-neutral and alkaline conditions due to the formation of insoluble cerium hydroxides, which block the pitting corrosion [8]. In NaCl solution, the cerium hydroxides precipitate on the cathodic zones of AA2024 surface, which in turn hinder the cathodic reaction and thereby the entire corrosion process. This behavior cannot be seen in H2SO4 solution because the cerium hydroxides are stable in near-neutral and alkaline solutions and dissolve in acidic solutions [35]. Therefore, in the presence of CeO2 nanoparticles, the retarding of the overall corrosion activity can be attributed to the formation of a more stable surface layer of insoluble cerium hydroxides.
3.2.2 Linear polarization measurements
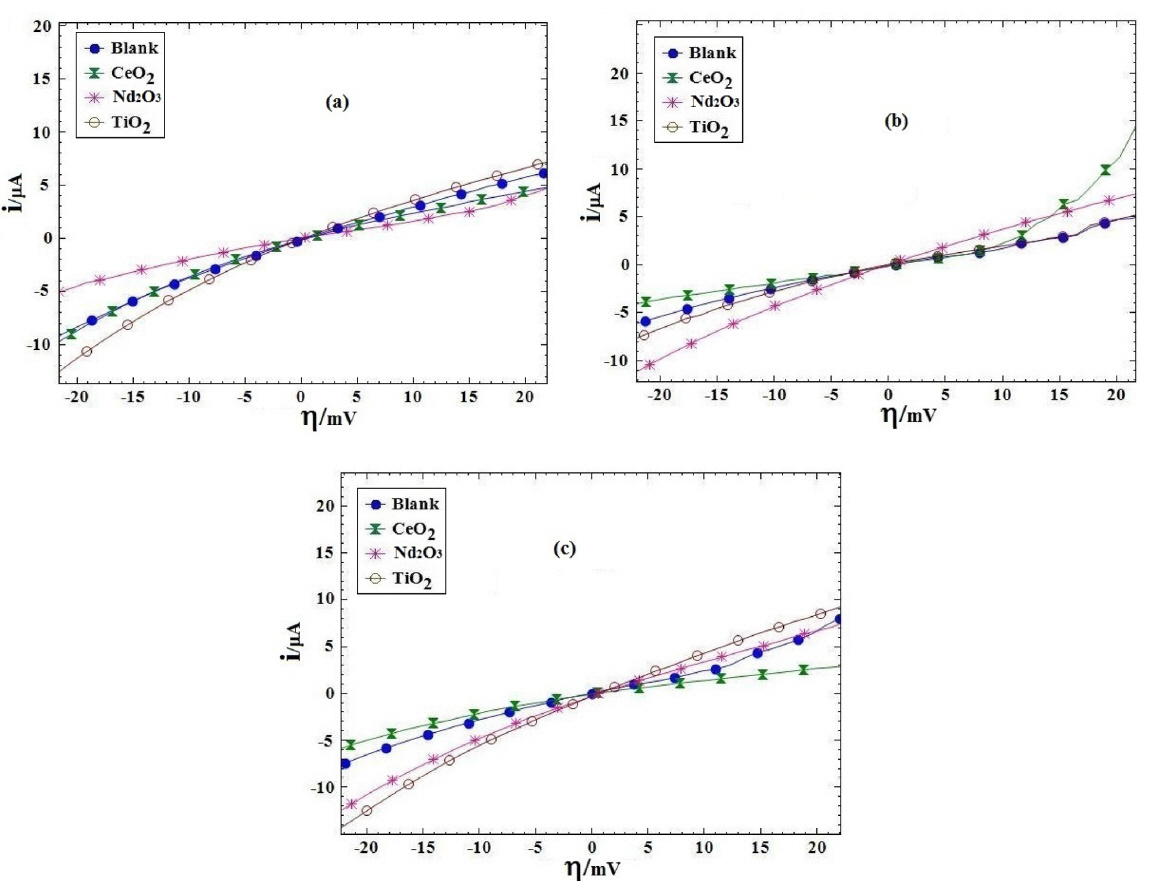
Protection performance of the different coating samples was evaluated at different times after immersion in 3.5% NaCl solution by linear polarization method. Fig. 11 shows the plots of current vs. overpotential, h, obtained from linear polarization measurements of the PPy coated samples after immersing in 3.5% NaCl solution at various exposure times. The polarization resistance (Rp) was measured from the slope of overpotential, h, versus i curve at the corrosion potential (h=0). The PE values were calculated by Eq (3) for different coating samples. The resulted Rp and PE values for different coating samples are listed in Table 5.
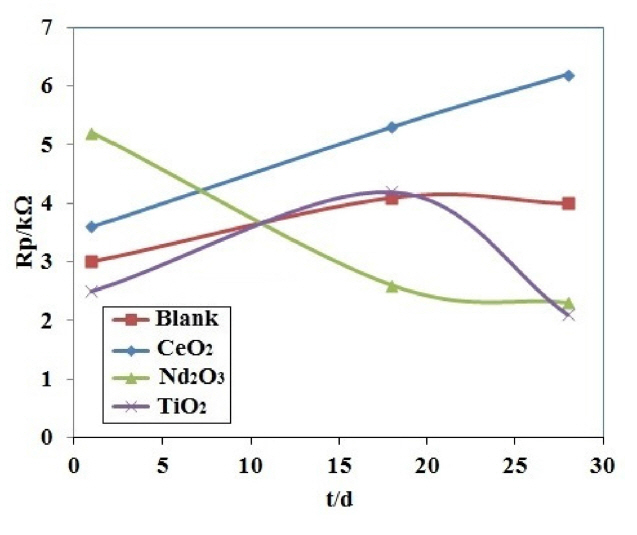
Fig. 12 presents the polarization resistances of the different coating samples after immersing in NaCl solution as a function of exposure time. In the first day of immersion, the Nd2O3 coating sample showed the highest polarization resistance. It is clear from Fig. 12 that among the different coating samples the coating containing CeO2 nanoparticles provides the best corrosion protection. In fact, the values of the polarization resistance of CeO2 coating sample are the highest after 28 days from the immersion time in NaCl solution.
The sample containing CeO2 nanoparticles shows the polarization resistances higher than those arising from the other coating samples especially after 28 days of immersion. On the other hand, the Nd2O3 coating sample showed a continuous decrease in the polarization resistance. This is indicative of the large scale penetration of electrolyte through the coating and therefore the progression of a corrosion process [36].
For the CeO2 coating sample, the polarization resistance increased with the immersion time, in agreement with the EIS results. As mentioned above, this unusual behavior is generally related to the inhibition effect of cerium on aluminum alloys which can cause an increase of the ionic barrier properties.
4. Conclusions
The corrosion behavior of PPy coating on AA2024 alloy doped with each of TiO2 and CeO2 nanoparticles and Nd2O3 nanorods, called as nanosized metal oxides, was investigated during exposure to the solutions of 0.1 M H2SO4 and 3.5% NaCl. The EIS and LPR measurements proved that among the different PPy coatings containing nanosized metal oxides immersed in H2SO4 solution the Nd2O3 coating sample provided the highest corrosion protection at any time of immersion up to 72 h after immersion time. On the other hand, after immersion in NaCl solution up to 28 days the CeO2 coating sample displayed the best anticorrosive properties among the other coating samples. The cause of this behavior is the inhibition effect of cerium ions on aluminum alloys at near-neutral solutions.