Electroanalytical Measurement of TEDA (Triethylenediamine) in the Masks of War
Article information
Abstract
In this paper, for the first time, the electroanalytical study of Triethylenediamine, TEDA was done on a typically graphene modified carbon paste electrode (Gr/CPE) in pH=10.5 of phosphate buffer solutions (PBS). The surface morphology of the bare and modified electrodes was characterized by scanning electron microscopy (SEM), electrochemical impedance spectroscopy (EIS) and cyclic voltammetry (CV). The electro-oxidation of TEDA was investigated at the surface of modified electrode. The results revealed that the oxidation peak current of TEDA at the surface of Gr/CPE is 2.70 times than that shown at bare-CPE. A linear calibration plot was observed in the range of 1.0 to 202.0 ppm. In this way, the detection limit was found to be 0.18 ppm. The method was then successfully applied to determination of TEDA in aqueous samples obtained from two kinds of activated carbon from the masks of war. On the other hand, density functional theory (DFT) method at B3LYP/6-311++G** level of theory and a conductor-like Polarizable Continuum Model (CPCM) was used to calculate the pKa values of TEDA. The energies of lowest unoccupied molecular orbital (ELUMO) and highest occupied molecular orbital (EHOMO), gap energy (ΔE) and some thermodynamic parameters such as Gibbs free energy of TEDA and its conjugate acid (HT+) were calculated. The results of calculated pKa were found to be in good agreement with the experimental values.
1. Introduction
Graphene (Gr) is a two-dimensional sheet of sp2-hybridized carbon atoms that form a flat hexagonal lattice [1]. Since the discovering by Geim et al. in 2004 [2], graphene has received enormous consideration due to its excellent electrical conductivity, large surface area and low production costs [1,3]. Graphene provides an ideal base for electronics, electric devices and biosensors [3-5]. Among all of the carbon electrodes, the carbon paste electrode (CPE) is an appealing and widely used electrode in the fields of electrochemistry and electroanalysis due to simple preparation, low-cost implementation and renewability [6,7]. Graphene electrodes have shown superior performance in terms of electrocatalytic activity and macroscopic scale conductivity than glassy carbon, graphite and even carbon nano tube electrodes [3,8,9]. The modified graphene carbon paste electrodes have been successfully applied to study and measurement some biological and organic molecules [10].
Triethylenediamine, TEDA (Scheme 1(A)), exhibits certain unusual properties and good complexing ability due to its tricyclic structure and two end tertiary nitrogen atoms. It is an effective antioxidant that acts as a quencher of singlet oxygen and it can be used to improve the lifetime of dyes [11,12]. TEDA is more effective than other amines at providing enhanced protection against cyanogen chloride, so it widely used in the war masks [13]. Therefore, an accurate, fast and simple method for its determination is significantly important in various samples.
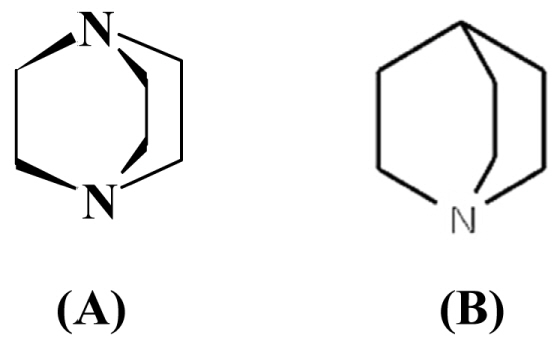
Chemical structure of (A) TEDA and (B) Quinuclidine.
With the best our knowledge there are a few methods for the quantitative determination of TEDA. Anderson reported a capillary gas chromatography method for heterocyclic tertiary amines N-methylimidazole (MI) and triethylenediamine (TEDA) analysis in vapor phase [14]. However, this method requires several time-consuming manipulation steps and high running costs. Hence, it is of primary importance to develop an alternative method for TEDA determination with a high degree of selectivity and sensitivity. The low cost, rapid detection and high accuracy of electrochemical analysis has attracted the attention of scientists in determination of electro active compounds [15].
In this paper, at first we prepared a simple and selective graphene modified carbon paste electrode and used it to quantify TEDA in commercial samples. This electrode offered advantages such as easy preparation and large potential window [16-18]. After that, theoretical calculation was used for determination of pKa of TEDA and the results compared with the experimental data.
2. Experimental Section
2.1 Materials
TEDA, graphene nanosheets, KCl, K4[Fe(CN)6], K3[Fe(CN)6], triethylamine (C6H15N), tetramethylethylenediamine (C6H16N2), ethylenediamine (C2H8N2), NaOH and H3PO4 purchased from Merck and used without any further purification. Pure fine graphite powder (Merck) and paraffin oil (DC 350, Merck, ρ = 0.88 gcm−3) were used as binding agents for the graphite pastes. PBS (0.1 mol/L) with different pH (2.0-11.0) values were prepared from solutions of H3PO4 (0.1 mol/L) and a saturated solution of sodium hydroxide. All analysis was carried out at the ambient condition (25℃) and all solutions were freshly prepared using double distilled water (0.055 μS).
2.2 Surface analysis and electrochemical measurement
A scanning electron microscope (TESCAN, Czech Republic) was used to study the surface of bare and Gr/CP electrodes. In addition, CV and EIS were used to characterize each electrode surface. Voltammetric measurements were carried out using a potentiostat/ galvccccanostat (SAMA 500, electro analyzer system, I.R. Iran) which was adopted with a conventional three-electrode system. The working electrode was bare-CPE or Gr/CPE and the auxiliary and reference electrodes were platinum wire and Ag/AgCl electrode, respectively.
2.3 Fabrication of CPEs
The bare carbon paste electrode (bare-CPE) was prepared by dispersing of 0.5 g graphite powder in 5.0 mL water with the aid of ultrasound waves (60.0 minutes). The Gr/CPEs were fabricated by dispersing of 2.0, 3.0, 4.0, 5.0, 6.0 and 7.5 mg of Gr and 0.5 g graphite powder in 5.0 mL water with ultrasonic agitation for a 70.0 minutes to give a black suspension. These suspensions were dried in oven (65℃ for 24 hour) and then mixed with approximately 100 μL of paraffin oil. For preparation of bare-CPE and Gr/CPE, the obtained pastes were put into plastic syringe tubes with the inner diameter of 2.0 mm. Finally, the copper wire was used for electrical contact to the paste.
2.4 Density functional theory (DFT)
Theoretical calculations were carried out at DFT level using the 6–311++G(d,p) basis set for all atoms with Gaussian 03 program package [19]. The electronic properties such as ELUMO, EHOMO and some thermodynamic parameters such as Gibbs free energy and enthalpy of compounds were calculated. The molecular sketches of all compounds were drawn using Gauss View 03 [20]. The optimized molecular structures and natural charge population analysis of TEDA (T) and its conjugate acid (HT+) were depicted. For solution phase calculation, the solvent model needs a relatively high computational cost and is merely appropriate for a limited number of small molecule systems. Among the implicit solvent models, conductor polarized continuum model (CPCM) is one of the most popular approaches [21].
3. Results and Discussions
3.1 Surface Characteristics of modified electrode
The surface of the carbon paste electrode before and after Gr incorporation was characterized by scanning electron microscopy (SEM) and voltammetry methods. SEM images (Fig. 1(A) and (B)) clearly illustrates the appearance difference of surface between bare-CPE and Gr/CPE. The Gr/CPE has typical flake-like shape with slight wrinkles on the surface, which it is appropriated to presence of Gr nanostructures.
In an attempt to clarify the differences among the electrochemical performance of the bare-CPE and Gr/CPE, cyclic voltammetry (CV) and electrochemical impedance spectroscopy (EIS) were used for the characterization of each electrode surface. CVs for 5.0 mM of Fe(CN)63−/4− in 0.1 M of KCl solution on the bare-CPE and Gr/CPE are shown in Fig. 2. A (curves a and b respectively). The quasi reversible one-electron redox behavior of Fe(CN)63−/4− ions was observed on the bare-CPE with a peak separation (ΔEp) of 0.156 V at the scan rate of 50 mV/s. After incorporating of graphene sheets to electrode, the anodic peak current for Fe(CN)63−/4− increased about 2.27 times in comparison with bare-CPE, while the ΔEp decreased. ΔEp was found to be 0.089 V for Gr/CPE. The comparison of the peak currents obtained for two electrodes indicates that the modification of bare-CPE with Gr caused easier and faster charge transfer at the electrode surface. Quantitative parameters extracted from CV data are summarized in Table 1.

Typical SEM images of (A) Bare-CPE and (B) Gr/CPE.
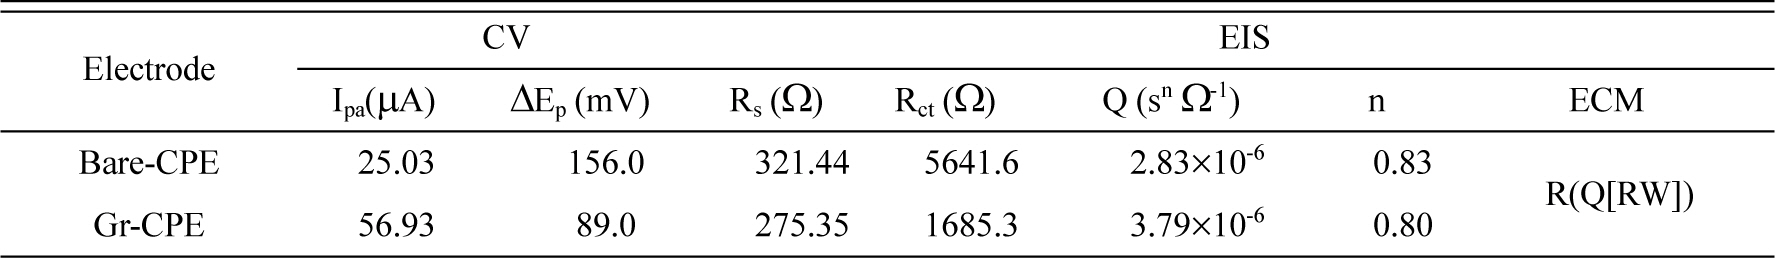
Electrochemical parameters extracted from CV and EIS data obtained on bare-CPE and Gr/CPE in the presence of 5.0 mmol L−1of Fe(CN)63−/4− in 0.1 mol L−1 of KCl.
On the other hand, EIS is a suitable technique for investigation of the electrode surface dependent charge transfer process (interfacial properties, i.e., resistance and capacitance) [22,23]. The measurements are generally performed in Faradaic mode, using redox probe K4[Fe(CN)6]/K3[Fe(CN)6]in order to focus on the variations of the charge transfer resistance (Rct) between solution and electrode surface. After incorporating Gr to bare-CPE, the value of Rct changes, due to its conduction properties. To obtain the detailed information of the EIS, an equivalent circuit model was used to fit the results. In this circuit, Rs, Q and Rct represent solution resistance, a constant phase element model parameter that is sometimes shown as Y0 or T and named as double layer parameter and electron transfer resistance, respectively. W is a finite-length Warburg short-circuit term coupled to Rct, which accounts for the Nernstian diffusion. In our work, EIS results obtained from a Nyquist plot showed a large decrease in Rct at Gr-CPE (Fig. 2 (B), curve b) compared to bare-CPE in 0.1 mol/L KCl solutions (Fig. 2 (B), curve a), indicates a significant increase in the rate of charge transfer. As shown in Fig. 2 (B), when bare-CPE was unmodified, the semicircle associated with Rct increased obviously, suggesting that bare-CPE has a low rate of electron transfer due to its poor conductivity. However, after modification of bare-CPE with Gr, the semicircle decreased distinctively. This indicate that Gr could accelerate the electron transfer between the electrochemical probe [Fe(CN)6]3−/4− and bare-CPE. On the bare-CPE, Rct was 5641.6 Ω by fitting of the obtained Nyquist diagram on equivalent circuit model as [Rs(Q[RctW])]. After modification, the value of Rct decreased to 1685.3 Ω (by fitting to [Rs(Q[RctW])] model) which is much lower than bare-CPE. This may mean that the increasing surface of bare-CPE by graphene facilitate the electron transfer on the electrode surface. The results are summarized in Table 1.
3.2 Voltammetric behavior of TEDA
Fig. 3 depicts the cyclic voltammetric responses of bare-CPE and Gr/CPE in the absence (curves a and b) and in the presence of 100.0 ppm TEDA (curves c and d) in pH=10.5, respectively. The oxidation current of TEDA at Gr/CPE (curve d) is about 10.53 μA, while at bare-CPE (curve c) is about 3.92 μA and the peak potential of TEDA at the surface of Gr/CPE is about 30.0 mV lower than bare-CPE. Therefore, we concluded that the mixing Gr with graphite powder was improved the process of TEDA oxidation. The amount of Gr added in the paste was optimized in present of 100 ppm TEDA, which the best result was obtained by adding 6.0 mg of Gr (1.2% w/w) to the paste and at lower or higher percentage of Gr, no further improvement in peak current was observed. The CVs to optimize amount of Gr NSs in CPE is shown in Fig. 4.

(A) CVs of bare-CPE (a) and Gr/CPE (b) in the presence of 5.0 mM of K4Fe(CN)6/K3Fe(CN)6 in 0.1 M of KCl, and scan rate: 50 mV/s. (B) Nyquist plots for bare-CPE (a) and Gr/CPE (b) in the presence of 5.0 mM of K4Fe(CN)6/K3Fe(CN)6 in 0.1 M KCl, DC potential: +300 mV, AC amplitude:5.0 mV, and frequency range: 10 kHz-100 mHz.

Cyclic voltammograms of bare-CPE and Gr/CPE in the absence (a and b) and presence (c and d) of 100.0 ppm TEDA at pH 10.50, respectively.
3.3 Calibration plot
The differential pulse voltammograms (DPVs) of TEDA on the Gr/CPE at the concentration range of 1.0 to 202.0 ppm are shown in Fig. 5. The plot of peak current versus TEDA concentration was consisted two linear sections in the concentration ranges of 1.0 - 65.0 and 65.0 - 202.0 ppm. These two plots can be given by:

DPVs of 100 ppm TEDA at the surface of CPEs with different amounts of Gr NSs in 0.1 mol L−1 PBS (pH 10.50). Inset: The curve of variation of I(μA) versus amount of Gr NSs.
I (μA) = 0.26C (ppm) + 0.09 (R² = 0.99)
I (μA) = 0.17C (ppm) + 6.5 (R² = 0.99)
The detection limit (3σ) of TEDA was 0.18 ppm according to the formula 3Sb/m criteria (where Sb is the standard deviation of the blank signal (n=5) and m is the first slope of the calibration curve). The relative standard deviations of Ep and Ip for different electrodes (named as 1, 2 and 3) with two concentration of TEDA are summarized in Table 2. In addition, when the electrode was stored at room temperature, the modified electrode retained 96.8% of its initial response to oxidation of 100 ppm TEDA after 12 days. These results (see Fig. 6) indicate that Gr/CPE is highly sensitive with significant potential for electrochemical sensor applications.
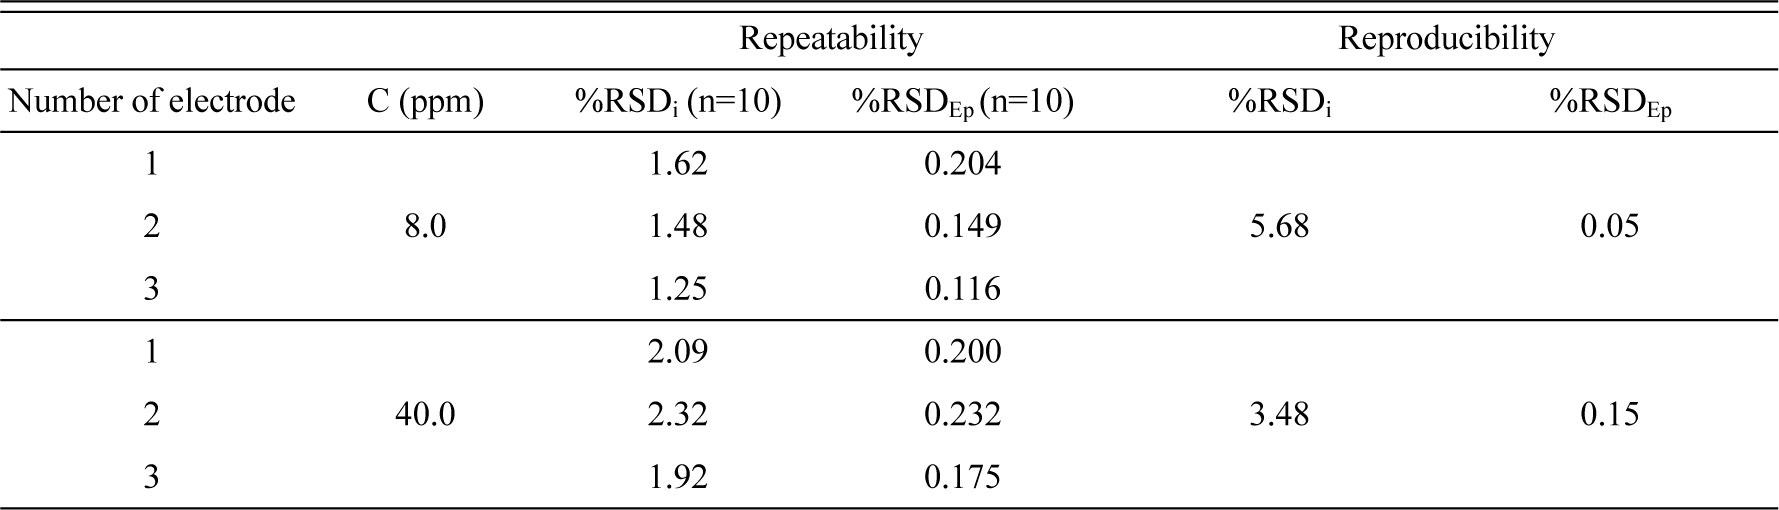
The RSD percentage of three different Gr/CPEs that have been prepared at a time

Differential Pulse Voltammograms of different concentrations of TEDA at the surface of Gr/CPE in 0.1 mol L−1 PBS (pH 10.50). The letters a-t correspond to buffer, 1.0, 2.0, 2.9, 4.8, 6.5, 10.7, 14.5, 18.0, 24.2, 29.6, 34.2, 40.5, 46.8, 52.9, 65.0, 76.7, 104.9, 131.4, 156.3 and 203.2 ppm of TEDA. Inset show the plots of the anodic peak current vs TEDA concentration in the ranges of 1.0 - 65.0 and 65.0 - 202.0 ppm.
3.4 Diffusion coefficient study
Chronocoulometry was used for calculating diffusion coefficient of TEDA at Gr/CPE for the first time. The chronocoulometric responses for various concentration of TEDA at Gr/CPE are shown in Fig. 7(A). The plot of Q against t1/2 for different concentrations of TEDA is shown in Fig. 7(B). The slopes of the resulting straight lines were plotted against the TEDA concentration (Fig. 7(C)). According to the integrated Cottrell equation [24], the apparent diffusion coefficient (D) of TEDA was calculated to be about 1.54 × 10⁻⁵ cm2s−1.

DPVs of 100 ppm TEDA at the surface of Gr/CPE in 0.1 mol L−1 PBS (pH 10.50) during twelve consecutive days. Inset: The curve of variation of I(μA) versus day.
3.5 Interference study and real sample analysis
To estimate the selectivity of the Gr/CPE in determination of TEDA, the effect of some ions and molecules, such as Ag+, Zn2+, Cu2+, Cr2O72−, ethylenediamine and Tetramethylethylenediamine was investigated. The tolerance limit was considered for the maximum concentration of substances, which caused a ± 5.0% relative error in detection of TEDA [25]. The results showed that no conventional substances affected the peak current of TEDA. In the case of 40.0 ppm TEDA, no interference could be observed for triethylamine (200 ppm). These results indicated that selective and sensitive determination of TEDA could be possible in spiked samples at the Gr/CPE in pH=10.75. Therefore, the recovery was measured by spiking different concentrations of TEDA into double distilled water samples. Recoveries were found to be 98.0 and 99.1% for 20.0 and 100.0 ppm TEDA, respectively.
To determine the concentration of TEDA in real samples, we selected two different activated carbons obtained from war masks, which their TEDA was extracted after 30 minutes reflection in water solution. Then, a standard addition method was applied based on DPV measurements (Fig. 8 (A) and (B)). Finally, the suitable results (Table 3) were obtained at the Gr/CPE.

Chronocoulomograms obtained at Gr/CPE in 0.1 mol L−1 PBS (pH 10.50) for different concentration of TEDA. The letters a–e correspond to 200.0, 300.0, 400.0, 500.0 and 800.0 ppm TEDA. Insets: (A) Plots of the charge (Q) vs square root of the time (t1/2) obtained from chronocoulomograms a-e. (B) Plot of the slope of the straight lines against TEDA concentration.

Measurement of TEDA in two different activated carbons obtained from war masks.
3.6 Experimental and theoretical calculation of pKa
To investigate the oxidation process of TEDA, the effect of pH on its peak current was studied. The effect of pH on the oxidation peak potential and peak current of TEDA from 5.0 to 11.0 was investigated at the Gr/CPE surface by DPV method (Fig. 9). Result shows that the maximum value of the peak current appeared at pH 10.50 (Fig. 9 (A)). So, this value was selected during the experiments. It was found that the peak potential shifts to negative values with the pH increase (Fig. 9 (B)). According to the Nernst equation (equation 1), where n & m represents the number of electrons and protons involved in reaction and a & b represents the coefficients reagent, a slope of 0.027 V pH−1 (in pH range 5.0 - 9.0) indicates that this oxidation process is a two electron-one proton process.

The curve of I(μA) vs. mg L−1 of TEDA in two different activated carbons obtained from war masks based on standard Addition method.

From the interceptions of the Ep vs. pH graph (Figs. 9 (B)), the pKa value of protonated TEDA (HT+) was determined to be 9.0. It is well known that the pKa value of HT+ was very close to the value reported in the literature, pKa = 8.8 [26].
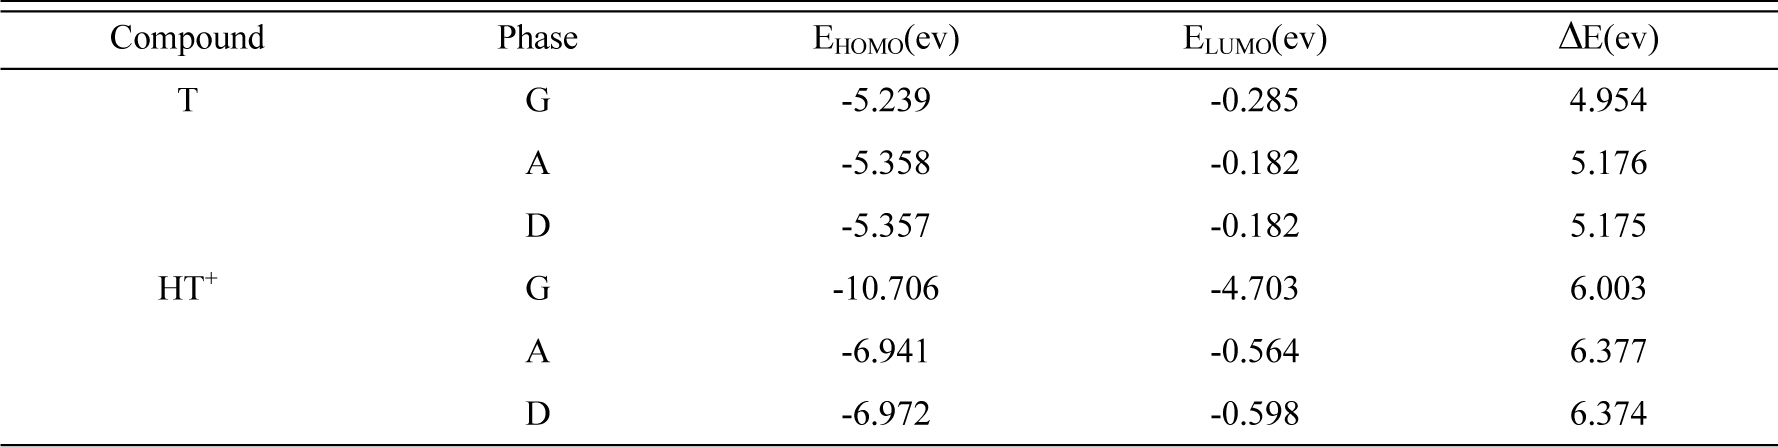
The calculated quantum chemical parameters such as EHOMO (the energy of the highest occupied molecular orbital), ELUMO (the energy of the lowest unoccupied molecular orbital), gap energy (ΔE), and some thermodynamic parameters of compounds in the gaseous (G), DMSO (D) and aqueous (A) phases are listed in Tables 4 and 5. The optimization geometry, HOMO and LUMO orbital of TEDA and conjugated acid are given in Fig 10.
Orbital energies for HOMO, LUMO and HOMO-LUMO gap energy (ΔE) of Compounds in the gaseous (G), aqueous (A) and DMSO (D) phases.
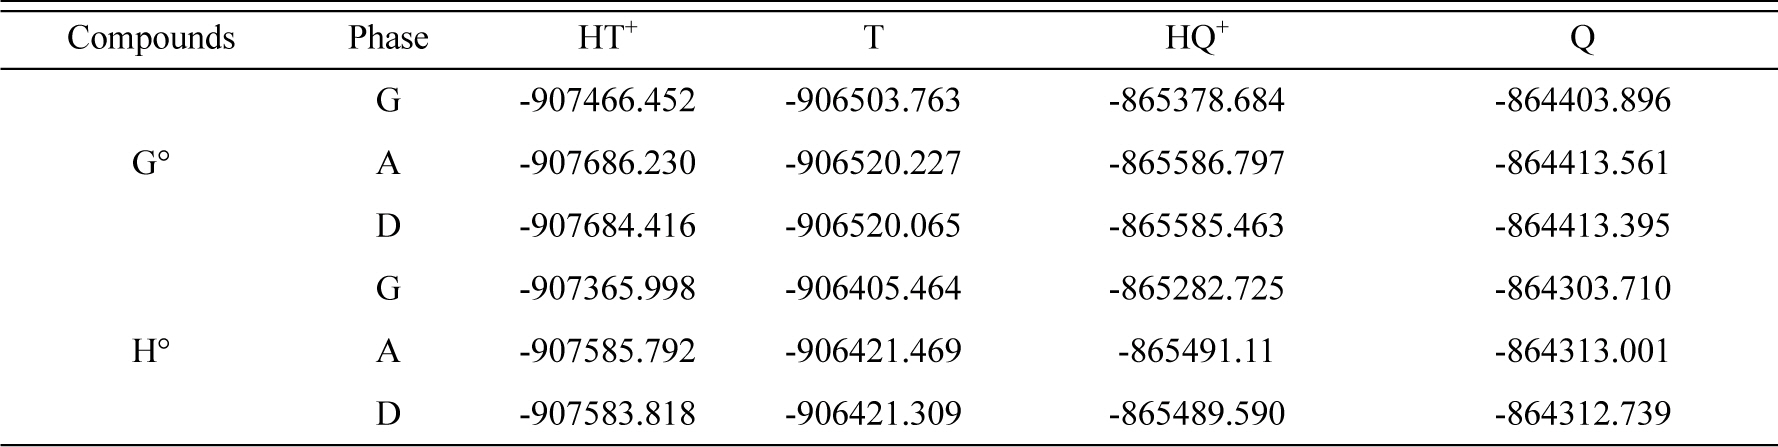
Calculated thermodynamic parameters (kJ/mol) of compounds in the gaseous (G), aqueous (A) and DMSO (D) phases.

The effect of pH on the oxidation of 200.0 ppm TEDA; (A) I(μA) vs. pH (5.0-11.0) and (B) Epa (mV) vs. pH (5.0-11.0).

The optimization geometry, HOMO and LUMO orbitals of T and HT+.
To confirm the results of experimental pKa, theoretical calculations were carried out according to the following equation in water and dimethyl sulfoxide (DMSO):

In this reaction, Quinuclidine (Scheme 1, B), was used as reference due to its similar structure to TEDA. Using the ΔGo of above reaction and equation 3, the acidity constants of protonated TEDA (HT+) were calculated (Table 6).

Theoretical ΔH (kJ/mol), ΔS(J/molK) and ΔG (kJ/mol) and pKa values of reactions at 298.15 K in the aqueous (A) and DMSO (D) phases.

Where R is the universal gas constant (8.314×10⁻³ kJ/mol.K), T is the room temperature (298.15 K) and Ka is the acidity constant. The experimental pKa values of protonated Quinuclidine (HQ+) in water and DMSO are 11.0 and 9.8, respectively [26].
The gas phase acidity of HT+ at 298.15 K is defined for the following deprotonation process:

The enthalpy, Gibbs free energy and entropy changes of process can be calculated as [27]:
ΔHacidity = ΔE + PΔV= (ET + EH+) − EHT+ + PΔV = ET − EHT+ + 5/2 RT
ΔGacidity = ΔH − T ΔS
ΔS= SHT+ − (ST − SH+)
Where E and S refer to the total energy and entropy of the compounds, respectively. The 5/2 RT term is the summation of the translation energy of proton and the PΔV term.
The values of theoretical ΔH (kJ/mol), ΔS (J/molK) and ΔG (kJ/mol) and pKa at 298.15 K are listed in Table 6. The calculated pKa values of HT+ in aqueous and DMSO is in good agreement with that reported in literature. The difference between aqueous calculated pKa (9.6) and experimental obtained by CV method (9.0) is about 0.6 unit (6.7% error). Also, the experimentally pKa value obtained from this work and literature (8.82) in water indicate a few difference (2.0%).
4. Conclusions
This research describes the computational studies and electrochemical behavior of TEDA at the surface of carbon paste electrode modified with Gr nanosheets. The TEDA showed good electrochemical activity at Gr/CPE with a detection limit of 0.18 ppm. The diffusion coefficient of TEDA was determined using chronocoulometry. Using this method, the determination of TEDA was successfully done in aqueous samples obtained from two kinds activated carbon of war masks. In computational studies, the experimental pKa value of protonated TEDA (HT+) was evaluated from Ep vs. pH graph. The results obtained from DFT calculation of pKa of HT+ in aqueous and non- aqueous (DMSO) media showed good agreement with corresponding experimental pKa values. In this theoretical calculation, the error for HT+ was less than 0.8 and 0.5 pKa units for water and DMSO respectively.