


1. Introduction
Carbonaceous (e.g., graphite, soft carbon, and hard carbon) and Li-alloying (e.g., Si and SiO) materials are currently used as negative electrodes for lithiumion batteries (LIBs) [1-3]. At the working potential of these materials, most conventional carbonate-based electrolytes are unstable and susceptible to reductive decomposition. The decomposed products deposit as a film on the electrode surface; this film is known as the solid electrolyte interphase (SEI) [4-7]. The formation of an SEI is undesirable because equivalent amounts of Li+ ions and electrons are consumed during electrolyte decomposition, which manifests as irreversible capacity. However, deposition of an SEI layer is necessary for the desired lithium-ion chemistry [8-10] because the SEI layer is electronically insulating, which hinders electrochemical reactions at the electrode/electrolyte interface owing to negligible electron tunneling through the SEI layer [7,11]. As a result, the electrolyte stops decomposing once a certain thickness of SEI is achieved. In other words, the electrodes are protected by the passivating surface films. Furthermore, the SEI layers exhibit high lithium-ion mobility. Therefore, they do not induce concentration polarization in the reactions involving Li+ ions and enable reversible Li+ intercalation/deintercalation in the negative electrodes [12,13]. The SEI layers should uniformly cover the electrode surface to passivate the entire electrode surface. A thin SEI layer is generally favored to minimize the ohmic resistance, as it plays a passivating role. Thermal stability must also be considered because SEI films are vulnerable to damage at high temperatures [14]. Once thermally degraded, the SEI layer loses its ability to passivate, leading to further electrolyte decomposition and additional film deposition, which leads to cell polarization and eventual capacity fading.
In general, SEI deposition on the negative electrodes is completed over the first few cycles. In practice, the passivation film is generated during the ŌĆśformation processŌĆÖ, during which the full-cells are subjected to several charge/discharge cycles before being sent to market. The formation process is conducted to activate the cells, identify defective cells, generate the passivation layer, and stabilize the cells. Inevitably, this formation step takes up most of the time required for the manufacture of secondary batteries [15]. Hence, the formation rate is important as it influences the productivity and economic feasibility of the cell manufacturing process.
Lithium titanate (LTO; Li4Ti5O12) has emerged as an alternative negative electrode material to graphite and has been widely studied because of its excellent rate performance [16-19]. Lithium ions are inserted into the spinel lattice (Li4Ti5O12) at 1.55 V (vs. Li/Li+). The LTO electrode has a theoretical capacity of 175 mA h gŌłÆ1 and transforms into a rock-salt structure (Li7Ti5O12) upon lithium insertion. In addition to its superior rate performance, LTO exhibits excellent reversibility and outstanding structural stability owing to its zero-volume change properties [20-22]. Many previous works have reported that the voltage corresponding to the reaction of LTO with lithium (1.55 V vs. Li/Li+) is too high to reductively decompose electrolytes. However, recent studies have demonstrated that electrolyte decomposition does occur and generates surface films on the LTO surface, even when the cell is operated within the stability window of the common salts and solvents used in LIBs [23-28]. Song et al. [27] reported the formation of a surface film on an LTO surface, which is significantly enhanced by the presence of conductive carbon in the composite LTO electrodes. Kitta et al. [25,28] found that the SEI layer generated during the first cycle prevents irreversible structural changes on the LTO surface. He et al. [24,26] reported gas evolution accompanied by electrolyte decomposition on the LTO surface and concomitant film formation.
The primary objective of this study is to elucidate the effect of the formation rate on the passivation ability of the SEI layers generated on the LTO surface. To investigate the processes occurring at the LTO surface during the formation process, Li/LTO half-cell experiments were conducted. Therefore, we use the term ŌĆśpre-cyclingŌĆÖ instead of ŌĆśformationŌĆÖ. In this study, Li/LTO coin cells were fabricated and precycled at two different rates to produce two different types of surface films on the LTO surface. The thicknesses and coverage of the two surface films were compared, and the relationship between the film properties after pre-cycling and LTO performance during charge/discharge cycling was examined.
2. Experimental Section
LTO powder (5-10 ╬╝m, provided by LG Chem.) was used as the active material for the coin cells. To prepare the working electrodes, the active material, Super P (conductive carbon), and poly(vinylidene fluoride) (PVdF; 90:5:5 by wt.%) were dispersed in N-methylpyrrolidone (NMP), and the resulting slurry was coated onto a piece of copper foil. The electrode plate was pressed and dried in a vacuum oven at 120Ōäā for 12 h.
2032-Type coin cells were fabricated with lithium foils as the counter and reference electrodes and a porous polypropylene (PP)-polyethylene (PE)-PP film as the separator. The electrolyte consisted of 1.0 M LiPF6 dissolved in a mixture of ethylene carbonate and diethyl carbonate (3:7 volume ratio). Precycling was carried out at 25Ōäā at two different rates. The Li/LTO cells were pre-cycled five times in the voltage range of 3.0-1.0 V (vs. Li/Li+) at 16 mA gŌłÆ1LTO (0.1 C) and 80 mA gŌłÆ1LTO (0.5 C). After pre-cycling, the cells were galvanostatically cycled at 60Ōäā and 1 C (160 mA gŌłÆ1LTO) for performance comparison.
A full-cell was fabricated from the as-prepared LTO electrode and a separately prepared LiNi0.5Mn1.5O4 (LNMO) electrode. The latter was prepared from a mixture of LNMO powder, conductive carbon (Super P), and PVdF (94:3:3 wt.%). The slurry was coated on Al foil, pressed, and dried following the procedure for the LTO electrode. The same electrolyte and separator used in the Li/LTO half-cell were used in the full-cell. The negative/positive (N/P) ratio was controlled to be 1.1 via the reversible capacity per active material mass. The LTO/LNMO full-cell was charged at a current density of 12 mA h gŌłÆ1LNMO (0.1 C) at 25Ōäā.
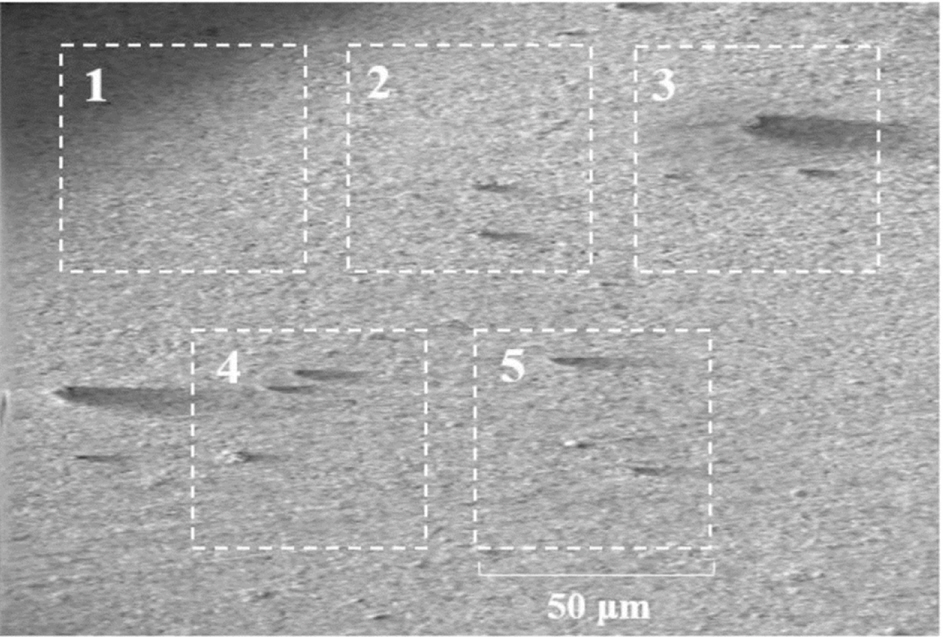
The morphologies of the SEI layers were investigated using transmission electron microscopy (TEM; JEM-2100) at an acceleration voltage of 200 kV. The chemical compositions, uniformity, and thicknesses of the SEI layers were analyzed using Auger electron spectroscopy (AES; PHI JEOL-660) and X-ray photoelectron spectroscopy (XPS; Sigma probe, U.K.). For these analyses, the cells were disassembled in an argon-filled glove box, and the LTO composite electrodes were collected and washed with dimethyl carbonate. For the AES analysis, the washed electrodes were mounted in a holder, and the specific measurement positions were selected using a field-emission scanning electron microscope (FE-SEM). To reduce deviations in the measurements, five squares (50 ╬╝m ├Ś 50 ╬╝m each) were selected on the electrode surface, and electron beams were targeted onto each square to determine the number of Auger electrons. The measurements at each square were conducted ten times, and the data were averaged. The atomic percentage of each element was calculated using the following equation [29]:
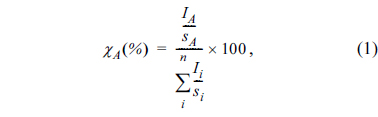
where Ii is the peak intensity of Auger electrons emitted from a given element and si is the relative sensitivity factor.
AC impedance measurements were conducted at 25Ōäā over a frequency range of 5 mHz to 100 kHz with an amplitude of 10 mV. Before the measurements, the Li/LTO cells cycled at 60Ōäā were rested for 24 h at 25Ōäā to stabilize the electrode surfaces. To exclude the contribution from charge transfer resistance, measurements were conducted in the fully delithiated state of LTO (OCV = 2.3-2.5 vs. Li/Li+).
For the high-temperature storage tests, the Li/LTO cells were pre-cycled five times at two different rates and fully lithiated to 1.0 V (vs. Li/Li+). The Li/fully lithiated LTO cells were stored at 60Ōäā in an oven for three days. After high-temperature storage, the Li/LTO cells were de-lithiated at 60Ōäā to determine the remaining de-lithiation capacity. It may be noted that the fully lithiated LTO electrodes lost some Li+ ions/ electrons (i.e., are de-lithiated) during storage, while the remaining Li+ ions/electrons contributed to the de-lithiation capacity.
3. Results and Discussion
To identify the electrode potential at which electrolyte decomposition and film deposition onto LTO occur, the lower cut-off voltage was varied between 1.55 and 1.0 V by charging the LTO electrode to predetermined values during the first cycle. As seen in Fig. 1(a), the potential applied to the LTO electrode initially plateaus (1.55 V for data points (i), (ii), and (iii)), and then rapidly drops after lithiation (1.0 V for data point (iv)). The surfaces of the resulting LTO electrodes were examined using XPS. Fig. 1(b) shows the Ti 2p XPS spectra: The intensity of the X-ray photoelectrons emitted from the Ti atoms in LTO inversely correlates with the thickness of the SEI layer on the LTO surface. As observed in Fig. 1(b), the pristine LTO electrode exhibits two strong Ti 2p peaks; however, after lithiation of the LTO electrode up to 40 mA h gŌłÆ1 in the first cycle (curve (i)), the intensities of Ti 2p peaks significantly decrease, indicating that the LTO surface is covered by an appreciable SEI layer. The intensities of the Ti 2p peaks become negligible after point (ii) in Fig. 1(b), illustrating that the SEI layer is sufficiently thick to block the emission of Ti 2p photoelectrons from the LTO. In other words, a significant thickness of surface film is generated as a result of electrolyte decomposition before the LTO electrode is 50% lithiated at 1.55 V during the first lithiation period. To examine whether the SEI layer is also deposited on the LTO electrode in a full-cell and determine the electrolyte decomposition potential, an LTO/LNMO full-cell was prepared and charged, during which the LTO electrode was lithiated according to the voltage profile shown in Fig. 1(a). Here, because the N/P ratio in the fullcell was fixed at 1.1, the potential of the LTO electrode remained within the plateau region (1.55 V vs. Li/Li+) during charging. After a 50% charge during the first cycle, the full-cell was disassembled and XPS spectra of the LTO electrodes were recorded. As shown in Fig. 1(c), the Ti 2p XPS peaks, which are intense in the pristine state, disappear after 50% charging, which indicates that the LTO surface is covered by an SEI layer. This confirms that the SEI layer deposits onto the LTO electrode in a full-cell, and the electrolyte decomposition potential is 1.55 V.
Fig.┬Ā1.
(a) Voltage profiles of the LTO electrodes as a function of specific capacity, and (b) Ti 2p XPS spectra of the LTO electrodes collected at various points indicated in the voltage profile in (a); these correspond to lithiated capacities of (i) 40, (ii) 80, (iii) 120, and (iv) 160 mA h gŌłÆ1. (c) Ti 2p XPS spectra of the LTO electrodes after 50% charging in an LTO/LNMO full-cell.
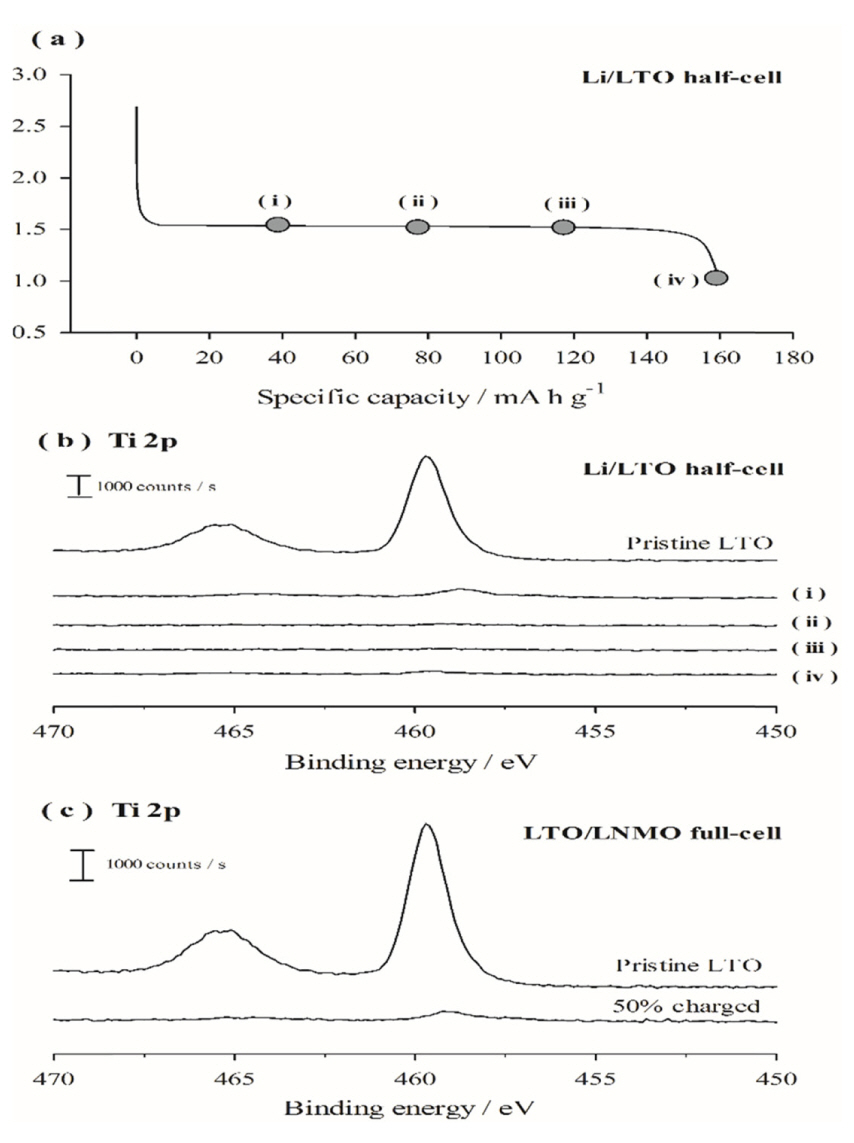
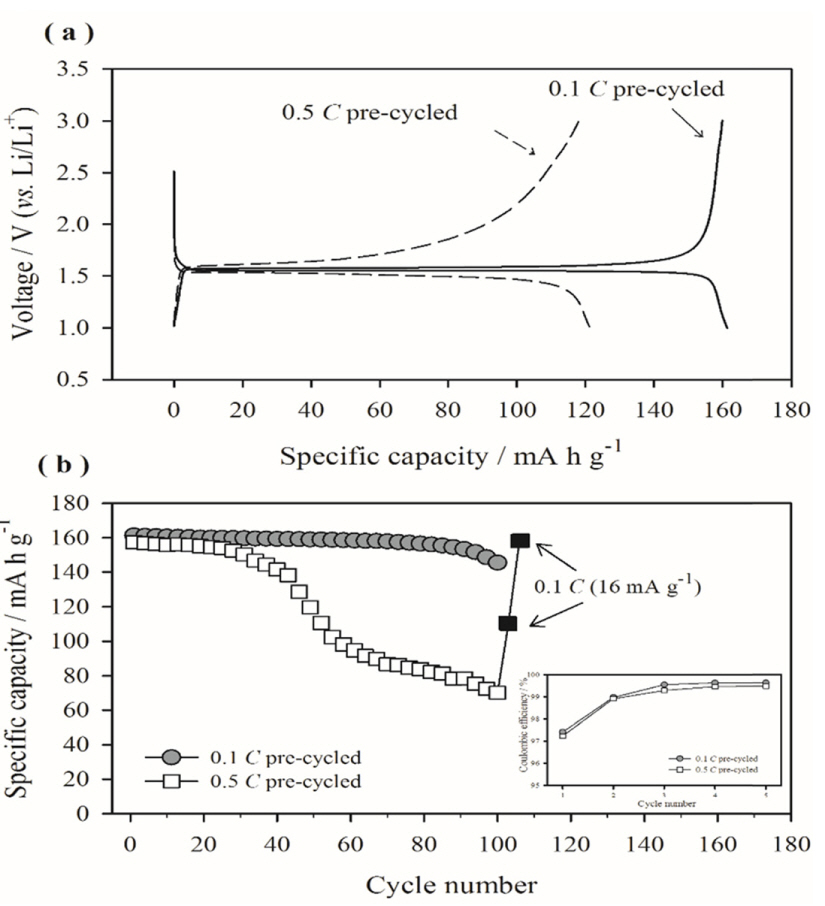
Fig. 2(a) compares the galvanostatic lithiation/delithiation voltage profiles of the Li/LTO cells that were pre-cycled at two different rates, i.e., 0.1 and 0.5 C. The cell pre-cycled at 0.1 C (hereafter referred to as the 0.1 C pre-cycled cell) shows a very flat voltage profile at 1.55 V (vs. Li/Li+) during the 50th cycle as well as during the 1st cycle (data is omitted in the figure for clarity). However, the Li/LTO cell precycled at a faster rate of 0.5 C (hereafter referred to as the 0.5 C pre-cycled cell) shows a sloped voltage profile with high cell polarization in the 50th cycle. Fig. 2(b) presents the cycle retention behavior observed for the Li/LTO cells pre-cycled at 0.1 and 0.5 C. The 0.1 C pre-cycled cell shows a reasonably good cycle performance up to 100 cycles; in contrast, the cell cycled at 0.5 C shows inferior cycle performance. Since the only difference between the two cells is the pre-cycling rate, Fig. 2(b) implies that the initial precycling condition critically affects the subsequent charge/discharge cycling behavior of the LTO electrode. Generally, the capacity degradation of the electrodes with cycling may be attributed to two factors: 1) loss of active material and 2) increased polarization [30-32]. The former frequently occurs when the active material undergoes irreversible structural changes to form inactive phases. It could also occur when the active material is pulverized or cracked as a result of significant volume changes, resulting in detachment of particles from the electrode or generation of electrically isolated particles; however, this is unlikely because LTO is structurally stable as it does not undergo phase transitions during cycling and is a zero-volume change material. The second possibility, i.e., increased polarization with cycling, is frequently caused by electrolyte decomposition and deposition of resistive surface films. If cell polarization is dominant, the capacity of the electrode would be rate dependent. In other words, even if a small capacity is delivered at a high rate owing to cell polarization, the capacity would be restored to the theoretical value as the charge/discharge rate slows. This possibility was tested by changing the galvanostatic charge/discharge rate, and the results are shown in Fig. 2(b). The 0.5 C pre-cycled Li/LTO cell, which appears to be severely degraded in capacity after 100 cycles at a current density of 160 mA gŌłÆ1, delivers a capacity close to the theoretical value (175 mA h gŌłÆ1) when the charge/discharge rate is slowed to 16 mA gŌłÆ1. This result clearly demonstrates that cell polarization is responsible for the poor cycle performance of the 0.5 C pre-cycled cell. The above results show that the pre-cycling rate significantly affects the performance of the LTO electrodes.
Fig.┬Ā2.
(a) Comparison of the galvanostatic lithiation/delithiation voltage profiles (50th cycle) of the Li/LTO cells at 60Ōäā. Pre-cycling was conducted at 25Ōäā at two different rates, i.e., 0.1 and 0.5 C. (b) Comparison of the cycle retention of Li/LTO cells measured at 60Ōäā with a current density of 160 mA gŌłÆ1. The cells were pre-cycled at 0.1 and 0.5 C. The Coulombic efficiencies of the two cells during pre-cycling are presented in the inset.
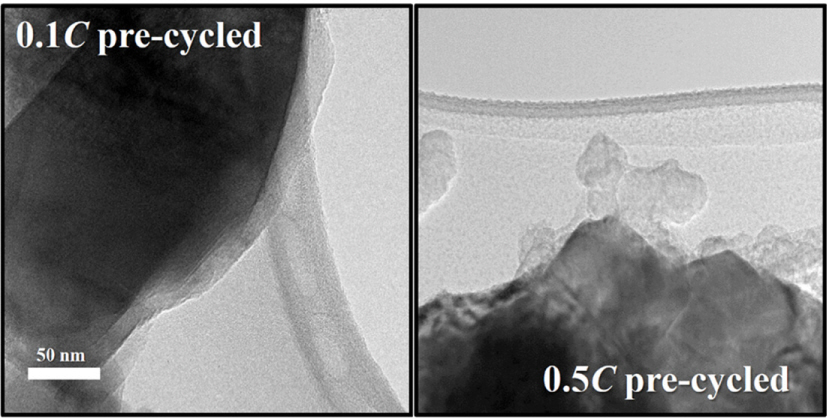
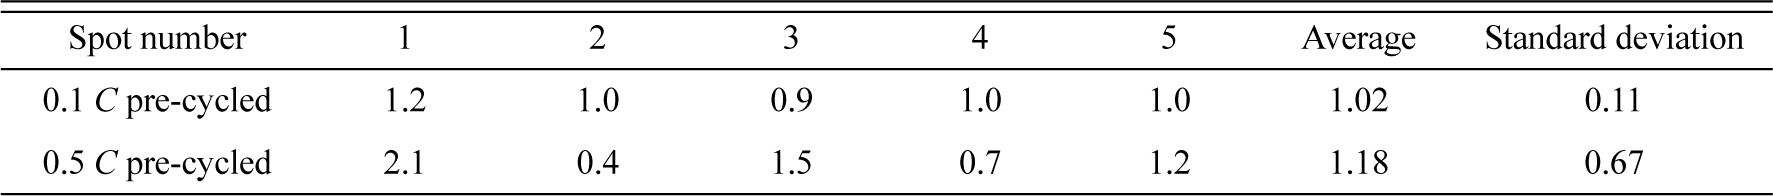
Considering that passivating films are generated during pre-cycling, the surface film properties could be affected by the pre-cycling rate. Fig. 3 compares the TEM images of the surface films generated immediately after pre-cycling at two different rates. The surface film formed on the 0.1 C pre-cycled electrode is thin and uniformly covers the entire electrode surface, whereas an uneven and irregular surface film is observed on the surface of the electrode pre-cycled at 0.5 C. In the latter case, some parts of the electrode surfaces are covered by a thick film, whereas other areas are not covered. This uneven film deposition behavior is further confirmed by the AES measurements. Table 1 lists the atomic percentages (at.%) of Ti measured at the five squares marked in Fig. 4. A large Ti at.% indicates either a thin surface film or uneven film deposition. The Ti at.% values obtained from the 0.1 C pre-cycled electrode (slower precycling) were 0.9-1.2% at the five squares with a standard deviation of 0.11%. On the other hand, the Ti at.% values obtained for the 0.5 C pre-cycled electrode (faster pre-cycling) were more scattered (0.4-2.1% with a standard deviation of 0.67%). Clearly, the surface film generated at a slower rate is more uniform in thickness, as suggested in Fig. 3, and more likely to have a high passivation ability. In contrast, the film deposited at a faster rate is uneven and is expected to have a poor passivating ability. Further, electrolyte decomposition and film deposition are expected when the electrode pre-cycled at the faster rate is subjected to charge/discharge cycling.
Table┬Ā1.
Atomic percent (at.%) of titanium calculated from the AES measurements at the five spots marked in Fig. 4.
To assess the passivating ability of surface films, storage tests were conducted under open-circuit conditions after the LTO electrode was fully lithiated. If the electrode has a poor passivating ability, the electrolyte reductively decomposes while the LTO electrode oxidizes (self-discharges). The net result is an increase in the open-circuit voltage (OCV) of the Li/LTO cell and decrease in the de-lithiation capacity. Fig. 5(a) shows the evolution of the OCV during high-temperature storage. The 0.5 C pre-cycled electrode shows a rapid increase in the OCV, indicating rapid oxidation (de-lithiation) of the LTO electrode, which in turn signifies the poor passivating ability of the surface film. The relatively slow increase in the OCV of the 0.1 C pre-cycled electrode implies that the passivating ability of this surface film is superior to that formed during faster pre-cycling. The inferior passivating ability of the film deposited on the 0.5 C pre-cycled electrode was further confirmed by the specific capacity data shown in Fig. 5(b): The 0.5 C pre-cycled electrode delivers a specific de-lithiation capacity of 80 mA h gŌłÆ1 after storage, which is about 50% of the value delivered before storage. This implies that about 50% of the Li+ ions/electrons stored in the LTO electrode by lithiation are lost (through self-discharge) during storage. However, the electrode pre-cycled at the slower rate loses only 25% of the Li+ ions/electrons, confirming the superior passivating ability of its surface film; this is attributed to slower film deposition. The Coulombic efficiency shown in the inset of Fig. 2(b) reveals that the two cells exhibit similar Coulombic efficiencies during pre-cycling, which suggests that the extent of electrolyte decomposition is comparable for the two cells. In the 0.5 C pre-cycled cell, film deposition occurs within a shorter period of time, resulting in coarser film growth. However, in the 0.1 C precycled cell, the electrolyte decomposition rate is slower and, thus, the decomposition products deposit more evenly and densely.
Fig.┬Ā5.
(a) Evolution of the OCV of the Li/LTO cells during storage at 60Ōäā, and (b) de-lithiation capacity at 25Ōäā immediately after storage. The Li/LTO cell was cycled five times at 25Ōäā (pre-cycled) at two different rates and lithiated to the pre-determined capacity (160 mA h gŌłÆ1). The cell was then stored at 60Ōäā for three days under open-circuit conditions. The current density for (b) was 1.6 mA gŌłÆ1 (0.01 C).
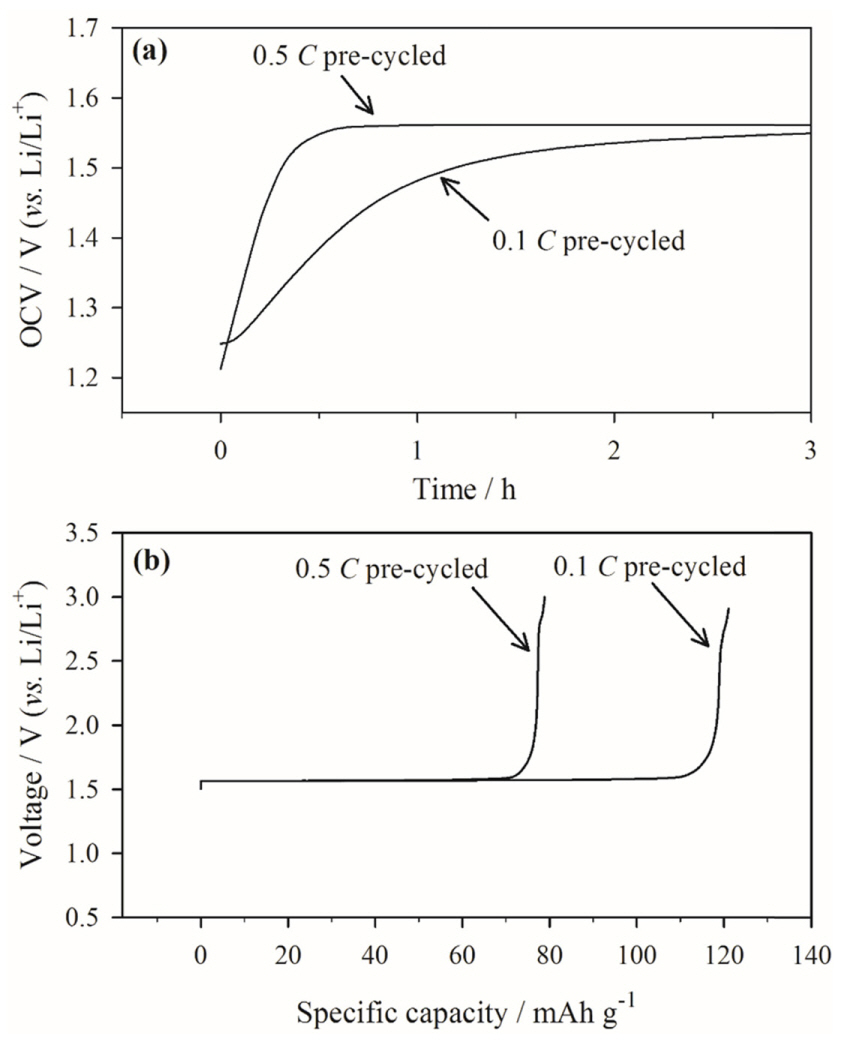
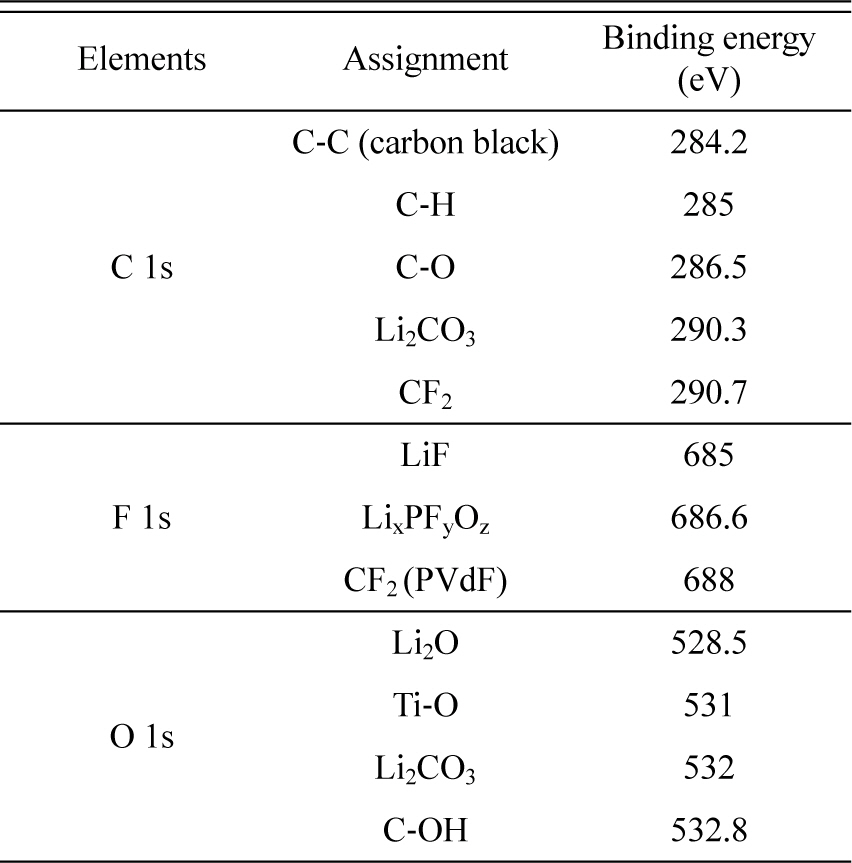
Fig. 6 presents the XPS data, which illustrate the chemical composition of the two surface films. All the XPS spectra were fitted according to the reported binding energies in Table 2 [33-35]. For accurate comparison, the scale bar for each element is included in Fig. 6. Overall, there is no significant difference in the C 1s, F 1s, and O 1s spectra of the two surface films. However, notably, the F 1s peak from the PVdF binder is more intense in the spectrum of the 0.5 C pre-cycled electrode than in that of the 0.1 C electrode, which is likely due to the thinner or partial surface film on the electrode surface. This indicates that the pre-cycling rate does not affect the chemical composition of the surface film.
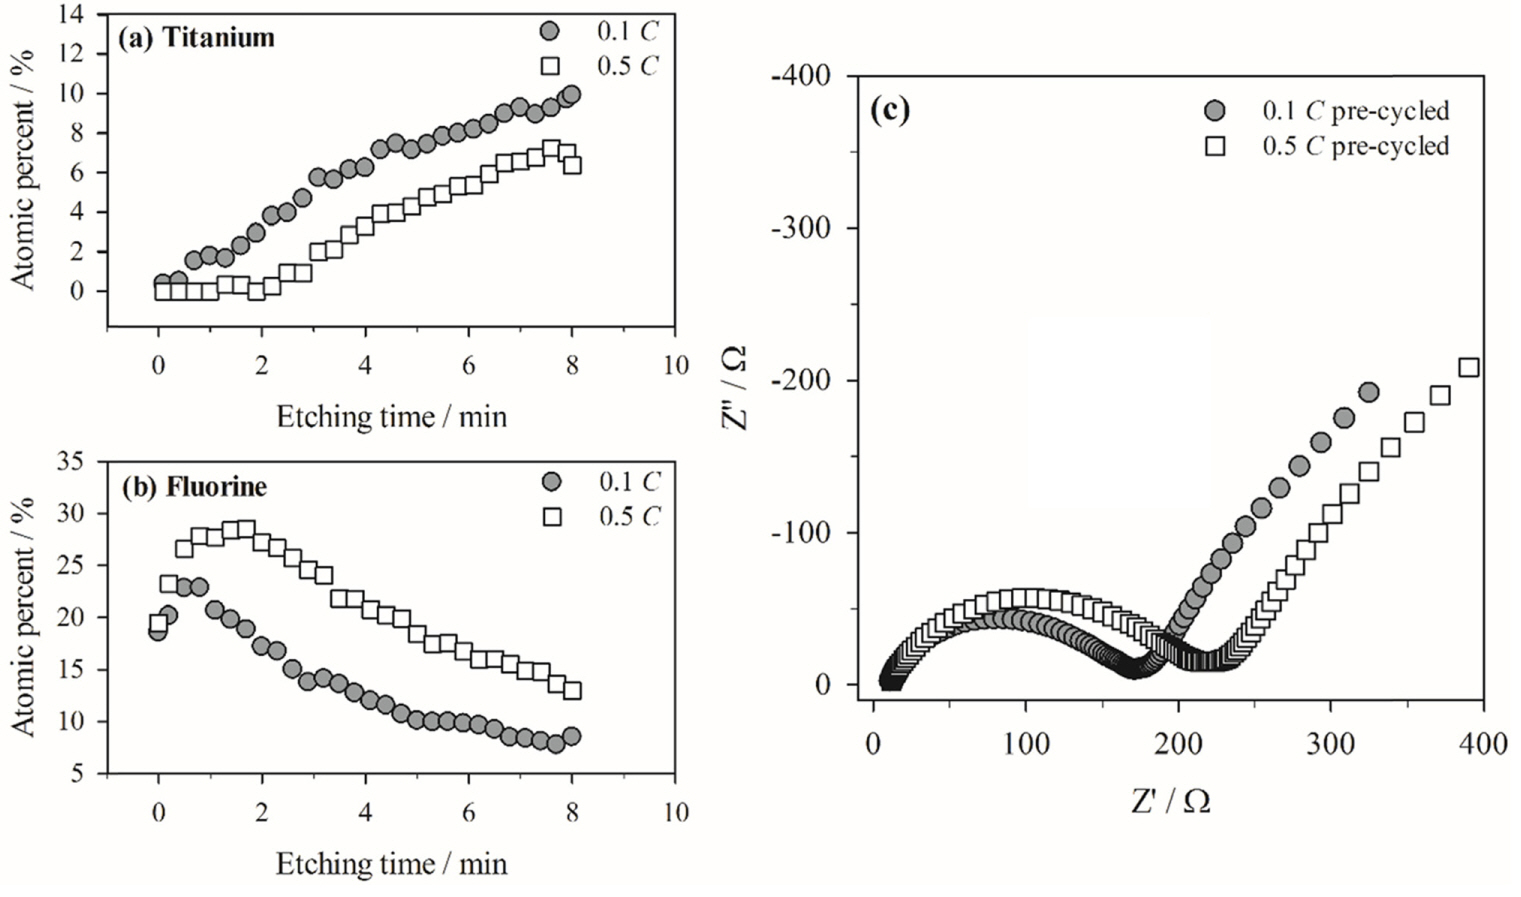
So far, the physico-chemical properties of surface films generated during the pre-cycling stage have been discussed; these properties indicate that faster pre-cycling is not desirable because of the poor passivating ability of the resulting surface film. As shown in Fig. 2(b), the Li/LTO cell pre-cycled at a faster rate shows poorer cycle performance than that pre-cycled at a slower rate. Based on the capacity recovery at a slower cycling rate, electrode polarization is assumed to be caused by the thick surface film. It is also assumed that storage causes deposition of a thick film (Fig. 5). The rapid increase in the OCV of the cell pre-cycled at 0.5 C indicates rapid oxidation of the LTO electrode, which likely causes significant electrolyte decomposition and additional film deposition. This assumption is validated by the Ti and F at.% values derived from the depth-profiling AES spectra (Fig. 7). As observed in Fig. 7(a), the at.% of Ti increases, while the at.% of F decreases with increasing etching time; this is likely due to gradual removal of the surface film covering the LTO surface. In other words, the number of Ti Auger electrons emitted from LTO increase and the number of F Auger electrons decrease due to gradual exposure of the LTO surface caused by removal of the surface film with continued etching. Comparison of the Ti at.% values of the two electrodes reveals that the surface film deposited on the LTO electrode pre-cycled at 0.5 C and subsequently charged/discharged 100 times is thicker than that on the electrode pre-cycled at a lower rate. More importantly, the at.% of Ti is close to zero for the first 2 min of etching (Fig. 7(a)), which clearly indicates that the surface film is much thicker on the faster pre-cycled electrode. Note that the electrode samples were collected after 100 charge/discharge cycles. At this stage, the film properties should differ from those immediately after precycling (Figs. 3, 4, 5, and 6). The surface film generated after pre-cycling at a faster rate shows poorer passivating ability owing to uneven coverage on the LTO electrode. Hence, additional electrolyte decomposition during the subsequent charge/discharge cycling period is more significant in generating a thicker surface film. This was confirmed by the AC impedance measurements: A larger semi-circle in the case of the 0.5 C pre-cycled electrode indicates higher film resistance, which can be explained by a thicker film. Thicker film deposition was concluded from Fig. 2 based on the observation that the specific capacity decays significantly after 100 cycles, but recovers at a slower rate (Fig. 2(b)), and that the cell is significantly polarized (Fig. 2(a)).

Fig.┬Ā7.
(a) and (b) Ti and F at.% values calculated from the depth-profiling AES spectra. The Li/LTO cells were cycled 100 times at 60Ōäā after pre-cycling at two different rates. (c) AC impedance spectra measured for two Li/LTO cells after the 100th cycle. Note that the measurements were made at the fully de-lithiated state of LTO (OCV = 2.3 - 2.5 vs. Li/Li+) to exclude the contribution from charge transfer resistance.
To compare the morphologies and chemical compositions of the two surface films after 100 cycles, TEM and energy dispersive X-ray spectrometry (EDX) analyses were performed (Fig. 8). Both the PVdF binder and surface passivation film contain fluorine. Since the PVdF binder is associated with the LTO particles in the electrode, fluorine atoms in the binder are always detected with the titanium atoms in LTO during EDX analysis. In the surface film on the 0.1 C pre-cycled electrode, the Ti atom distribution (Fig. 8(c)) is very close to that of the F atoms (Fig. 8(d)). Hence, the overlapped mappings of the two elements, as shown in Fig. 8(b), reveal almost complete superimposition of the red (Ti) and green (F) spots with only the few remnant green spots indicated by the arrows. These green spots likely originate from F in the surface film because they are not accompanied by red spots. In contrast, in the 0.5 C pre-cycled electrode, the remnant green spots after superimposition of the red and green spots are much larger (Fig. 8(f)) than those in Fig. 8(b), indicating heavier surface film deposition on the 0.5 C precycled electrode over 100 charge/discharge cycles. These characteristics are related to the inferior passivating ability of the surface film generated at a faster pre-cycling rate.

4. Conclusion
The deposition of surface films onto an LTO electrode and their passivating ability were examined. The following points should be noted:
(i) Electrolyte decomposition and film deposition onto the LTO electrodes, which were not previously considered to be possible because of the high working voltage of the LTO electrode (1.55 V vs. Li/Li+), were confirmed in this work. The surface films were deposited during the initial few charge/discharge cycles (i.e., pre-cycling).
(ii) The surface films deposited at two different pre-cycling rates differ from each other in their surface coverage and thickness uniformity. The film generated at a slower rate has a superior passivating ability than that generated at a faster rate. The surface film in the former case uniformly covers the LTO surface resulting in a higher passivating ability. As a result, the Li/LTO cell pre-cycled at a slower rate exhibits better performance.
(iii) The results of the present work suggest that a slower pre-cycling rate leads to better cell performance during subsequent charge/discharge cycling; however, a slower rate is undesirable from the perspective of cell-fabrication productivity and economic feasibility. Therefore, the challenge of generating a highly passivating surface film under fast pre-cycling conditions remains. One way to shorten the film-formation time is to introduce electrolyte additives that can produce desirable surface films with strong passivating abilities. If such favorable surface films can be generated at faster formation rates through the decomposition of electrolyte additives, the cell-fabrication productivity and economic feasibility can be improved. Further studies on this aspect are required.


