1. Introduction
Nowadays, it is widely recognized that hydrogen is an alternative and a sustainable energy carrier in future community. A feasibility of hydrogen economy is directly dependent on the cost down and the efficiency improvement of technologies for production, storage, and exploitation of hydrogen [1ŌĆō3]. In view of sustainability, the most promising approach for hydrogen production is a water electrolysis using the electric power generated a renewable source requiring no further purification process. [4ŌĆō6] Furthermore, this approach produces little carbon dioxide during the process in comparison with other methods, which makes efficiency in life cycle assessment (LCA) [4,7].
The technologies for water electrolysis can be categorized into two types; proton exchange membrane water electrolyzer (PEMWE) and alkaline exchange membrane water electrolyzer (A(EM)WE) operates in the acid and the alkaline condition, respectively. Of these, PEMWE can be operated at the much higher current density than A(EM)WE, because the ionic conductivity of proton is intrinsically much faster than that of hydroxide ion in an electrolyte medium [8]. Nevertheless, it is a serious drawback for PEMWE that requires a relatively high cost for hydrogen production due to a heavy efficiency loss resulting from a high overpotential for the oxygen evolution reaction (OER) at the anode. Hence, the development of new catalysts with improved sluggish kinetics of OER is a critical challenge for commercialization of PEMWE [9ŌĆō12].
To date, RuO2 is known as the best catalysts for OER in acid media, however, it has low durability owe to serious metal ion dissolution [12ŌĆō15]. By this reason, IrO2 can be used as an alternative, however, it also reveals the low activity due to high overpotential. Thus, it is necessary to improve the OER activity of IrO2. One of possible ways is the preparation of iridium based binary or ternary mixed metal oxide [12,16ŌĆō21]. For example, various Ir based catalysts, such as, IrRu mixed oxide, IrO2 on TiC, IrO2 on Ti magneli phase, IrOx core-shell Ta2O5 coating on IrO2, and surface-segregated IrRu alloy, have reported to enhance OER performance [22ŌĆō30]. However, these catalysts are not still enough to achieve satisfactory performance. Thus, we have tried to improve the performance of OER catalysts using a nanoporous thin film. Previously, we fabricated Os de-alloyed nanoporous Ir thin film (dft-IrOs) through de-alloy process, which showed improved the activity and stability for the OER [31]. In this line, we have tried to develop more active Ir based catalysts through additionally introduction of nickel (Ni) to dft-IrOs.
In the present study, the Os de-alloyed nanoporous IrNi thin film (dft-IrNiOs) as an OER catalyst is fabricated through de-alloying of Os from the IrNiOs surface. Where, we have attempted to fabricate a catalyst with the enhanced OER activity by addition of Ni to IrOs, known as a porogen material. Prepared nanoporous thin film through a selective de-alloying from metal alloy was characterized by the surface analysis and evaluated the OER performance using the electrochemical methods.
2. Experimental
2.1 Synthesis of nanoporous film catalyst
Bulk iridium (Ir polycrystal) was purchase from ACI Alloy (Cylindrical type, 1/4ŌĆ│ diameter, 1/4ŌĆ│ height, and 99.99% purity), and surface of bulk metal was polished with alumina powders and sandpaper. Surface of Ir polycrystal was annealed in Ar-3%H2 for 1 min at 800┬░C using Ambrell induction heating system. IrNiOs thin film were prepared on bulk Ir using chemical solution deposition method. Metal precursor including iridium chloride hydrate (Alfa Aesar, 99.9%), nickel chloride hydrate (Alfa Aesar, 99.9%), and osmium chloride hydrate (Alfa Aesar, 99.9%) were employed to prepare thin film. Each solution was prepared 0.1M using distilled water (Aqua ma, water purification system). Ir, Ni, and Os solutions were loaded on Ir polycrystal, then it was dried in oven at 60┬░C for the preparation of thin film electrode. Subsequently, Ir, Ni, and Os coated on Ir polycrystal was annealed to form alloy using an induction heater (AMBRELL, HOTSHOT 2 Ext.FF V4) at 700┬░C for 70 s under Ar/H2 flow (5% hydrogen). Ar purged deionized-water droplet was put onto the surface of thin film to prevent the oxidation of the thin film surface during moving it into the measuring cell after manufacturing of the alloyed IrNiOs electrode. Os was de-alloyed from IrNiOs alloys for the preparation of nanoporous IrNi catalysts (dtf-IrNiOs). Os de-alloying process was carried out with applying the constant current (1 mA cmŌłÆ2) for 100 min (6000 s) using chronopotentiometry (CP). After 100 min dealloying, the stability of dtf-IrNiOs was measured via 30 min de-alloying process. Concentration of dissolved metal ions during de-alloying process and the stability test of dtf-IrNiOs after de-alloying process was determined by an Inductively Coupled Plasma-Mass Spectrometer (ICP-MS, Thermofisher Scientific iCAP Q ICP-MS).
2.2. Instruments
The morphology of the catalysts was observed by SEM (Carl zeiss, SUPRA 25 model) at acceleration voltage of 20 kV and resolution of 10K ŌłÆ50 K. The crystalline structures were characterized using X-ray diffraction (Pohang Accelerator Laboratory, Pohang Accelerator Laboratory) at a scan rate of 2┬░ minŌłÆ1. Oxidation states of dtf-IrOs, dtf-IrNiOs and IrOx nanoparticles before and after sputtering were analyzed using synchrotron XPS (Pohang Accelerator Laboratory, 8A2 beam line, HR-PES 2). ICP-MS was characterized by Thermofisher Scientific iCAP Q ICP-MS.
2.3 Electrochemical measurements for OER
Oxygen evolution reaction (OER) was performed at room temperature in a three electrodes system employing a potentiostat (Biologic VSP). Ag/AgCl and a platinum wire (0.4 mm, Alfa Aesar) were used as reference and counter electrodes. The potential was calibrated using the reversible hydrogen electrode (RHE). The electrolyte (0.1M HClO4) was purged with Ar before and during electrochemical measurements. Cyclic voltammetry (CV) was conducted in the potential range of 0.05ŌĆō1.2 V (vs RHE) at the scan rate of 50 mV sŌłÆ1. The OER measurements were performed in the range of 0.05ŌĆō1.8 V (vs RHE) at the scan rate of 10 mV sŌłÆ1. The rotation speed of rotating disk electrode was 1600 rpm. IR-corrected potential was adopted to all electrochemical data.
3. Results and Discussion
Nanoporous Ir and IrNi thin film catalysts (dtf-IrOs and dtf-IrNiOs) were produced using electrochemical de-alloying in acid media. During preparation of dtf-IrOs and dtf-IrNiOs, dissolving of Os atoms at the surface results in the diffusional movement of surface Ir atoms toward the lower the surface energy. [32,33] It is expected to form a skeleton structure by the continuous Os dissolution during de-alloying process.
Table S1 shows the concentration of metal ions dissolved from the alloy during de-alloying, which has been determined using the ICPŌĆōMS. Os dissolution during the de-alloy process was much greater than that of Ni and Ir, where the concentration of Os ion dissolved during de-alloying process was 4750 ppb. The stability test after the Os de-alloying process showed that Os was dissolved in the highest concentration among the alloy metals, where the Os concentration was reduced by ~1% (from 4750 ppb to 55 ppb) for the stability test. Otherwise, Ir and Ni concentrations were reduced to ~0.1% (0.065 ppb from 17.242 ppb) and ~5% (14.950 ppb from 327.597ppb), respectively during the stability test after de-alloying. It indicates that dft-IrNiOs is sufficiently stable in the present experimental condition.
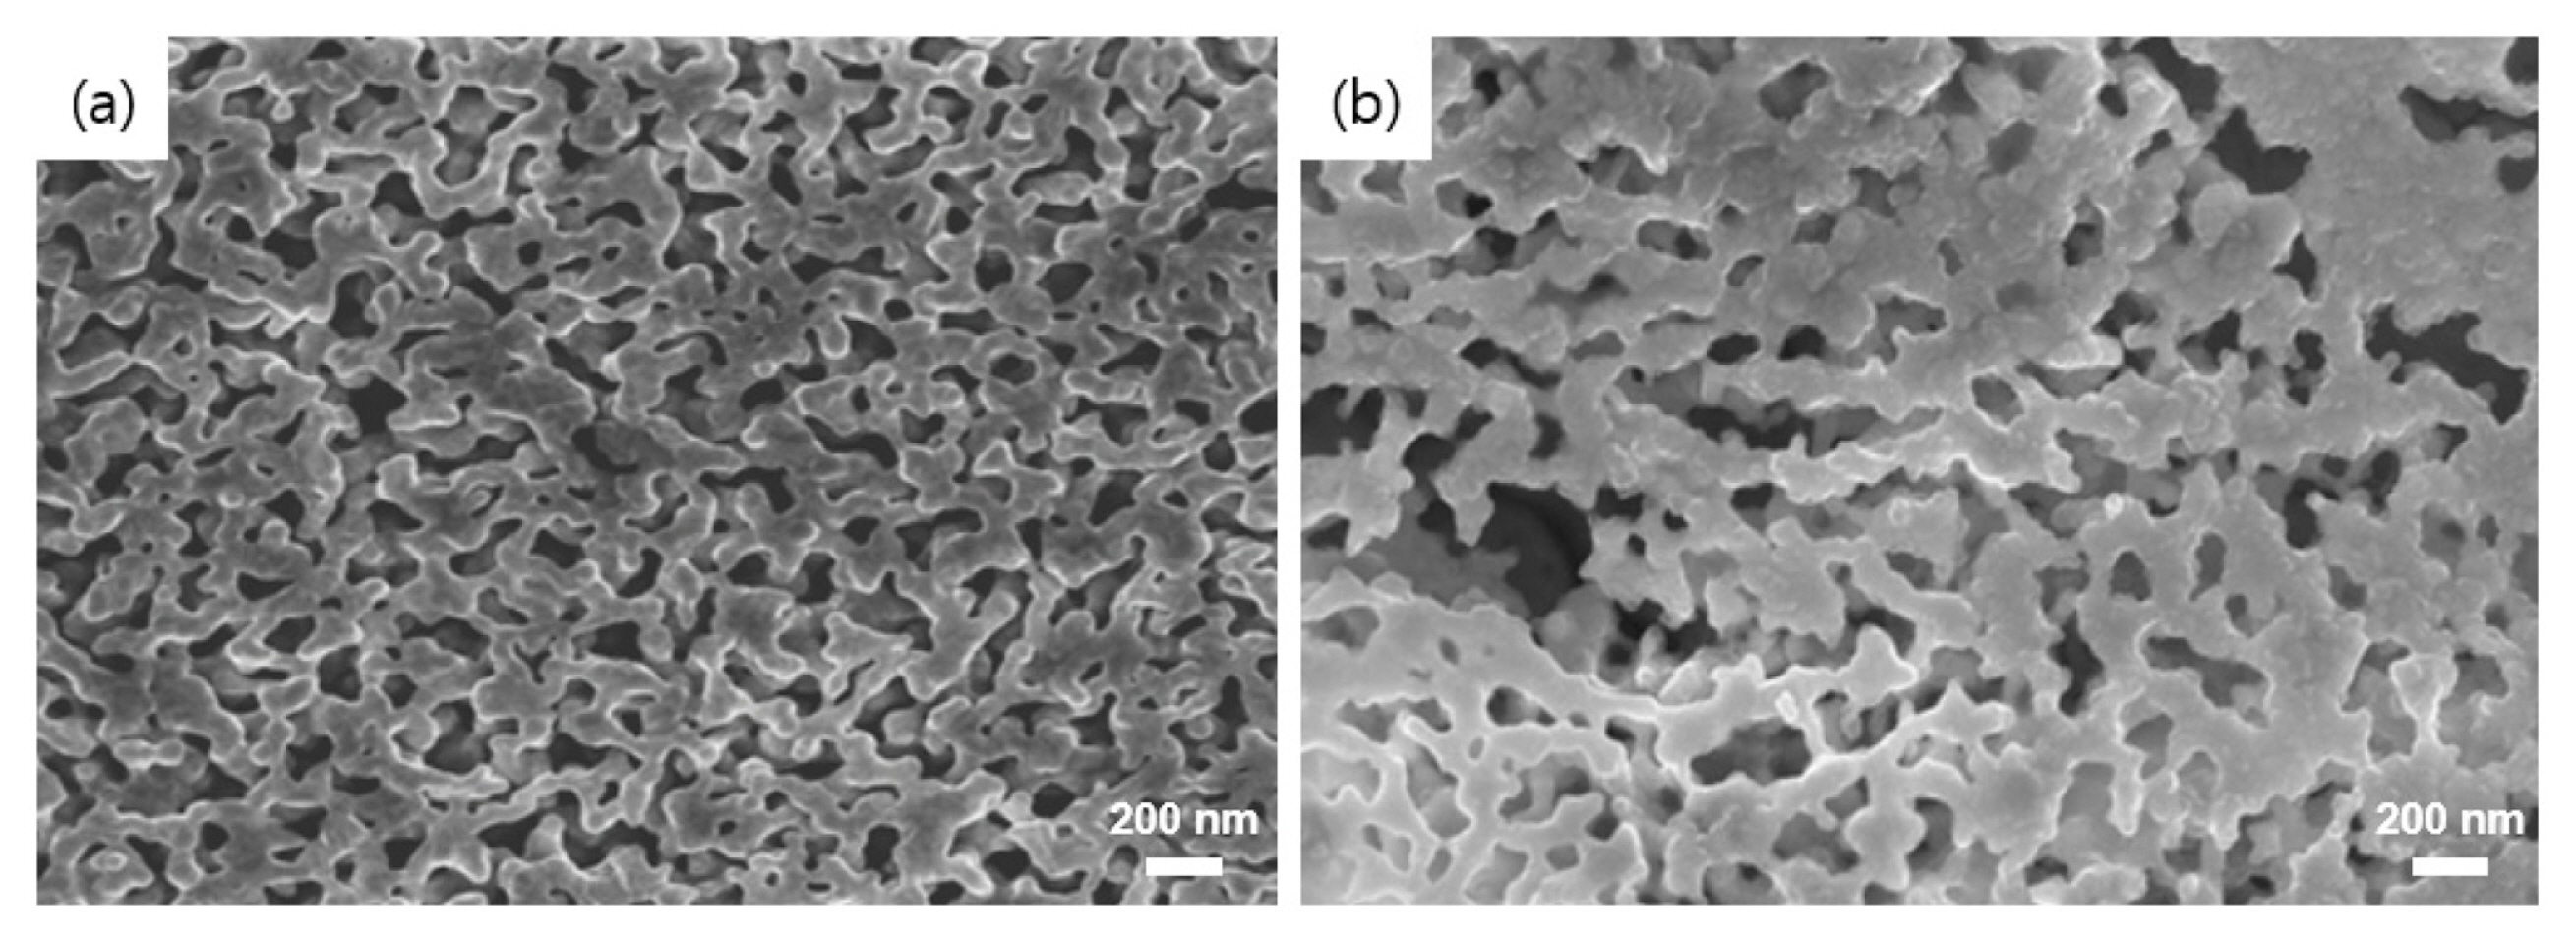
To further confirm the crystal structure before and after Os dissolution, X-ray diffraction (XRD) analysis was performed for the crystal structure and phase of catalysts. The XRD patterns of polycrystalline Ir, polycrystalline Ni, polycrystalline Os, tf-IrNiOs, and dtf-IrNiOs are shown in Fig. S1. The pattern of the polycrystalline Ir and Ni shows several peaks corresponding to (111), (200), (220), (311) and (111), (200), (311) planes at each 2 theta values, respectively, which assigns to the fcc structure. Polycrystalline Os shows peaks corresponding to (100), (002), (101), (102), 110), (103), (200), (112), and (201) planes, which assigns to the hcp structure. The patterns of tf-IrNiOs indicates the presence of Ir, Os and Ni crystal structure, however, dtf-IrNiOs shows only Ir and Ni crystals structure. It means that Os is almost fully dissolved during the de-alloying process. The SEM images of the surface of dtf-IrOs and dtf-IrNiOs were obtained to confirm morphology (Fig. 1). Both catalysts exhibited highly homogeneous and porous surface structures, where the pores are uniformly distributed over the entire films.
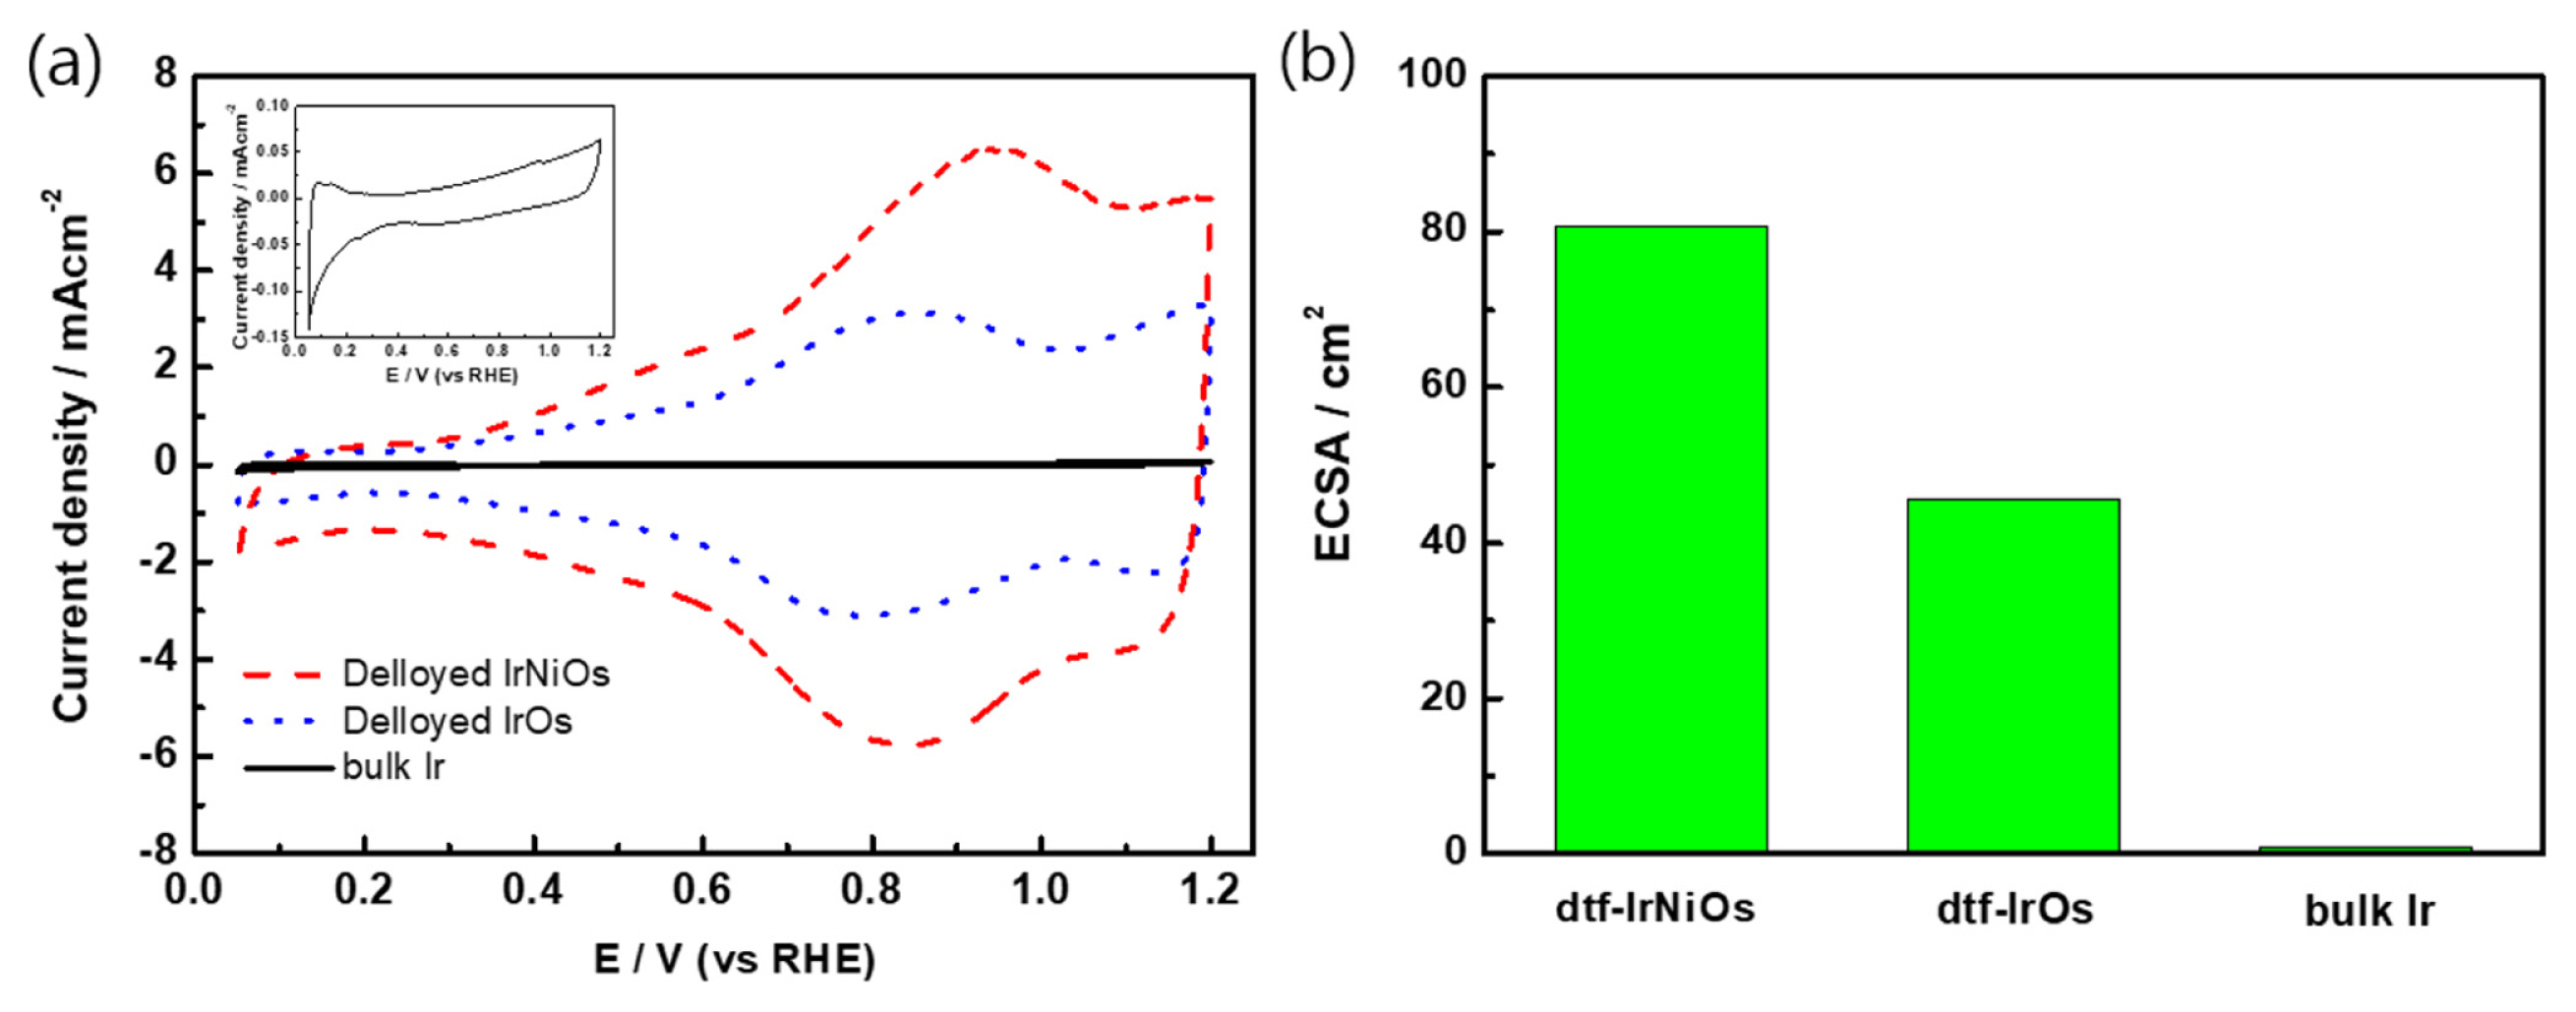
Cyclic voltammograms (CVs) were recorded for dtf-IrNiOs (red dash line), dtf-IrOs (blue dot line) and bulk Ir (black solid line) at 50 mV sŌłÆ1 in 0.1 M HClO4 solution. (Fig. 2). In general, bulk Ir revealed small underpotential hydrogen adsorption (Hupa) peaks between 0.05 V (vs RHE) and 0.4 V (vs RHE) [34]. The CVs of bulk Ir shows a typical redox pattern of Ir, however, appearing only the small peak in hydrogen adsorption region (0.05 ŌĆō 0.4 V) without the strong Ir3+/Ir4+ redox wave (0.8 ŌĆō 1.2 V). On the other hands, the quasi-reversible redox waves corresponding to Ir3+/Ir4+ are observed at + 0.8 / + 0.9 V. The small redox wave around + 1.2 V is expected corresponding to Ir4+/Ir5+ redox process [35]. The current enhancement of redox peak for dtf-IrNiOs compared with that of dft-IrOs indicates the formation of more active catalyst film. As the double layer capacitance of the catalyst increased, OER activity increased by formation of more porous structure [36]. Fig. 2a shows that double layer capacitance of dtf-IrNiOs is larger than that dft-IrOs because of addition of Ni and porosity increase. It means that OER activity of dtf-IrNiOs is better than dtf-IrOs.
Fig. 2b shows electrochemically active surface area (ECSA) of dtf-IrNiOs, dtf-IrOs, and bulk Ir obtained from CVs. ECSA was calculated from the electrochemical double-layer capacitance of the catalyst surface using the reported method in the literature [37]. The results of ECSA show the area increase in the following order; bulk Ir (0.9 cm2) < dtf-IrOs (45.6 cm2) < dtf-IrNiOs (80.8 cm2), where dtf-IrNiOs has the largest surface area (Fig. 2b). It indicates that IrNiOs has superior porous structure and can be expected to exhibit the excellent OER activity.
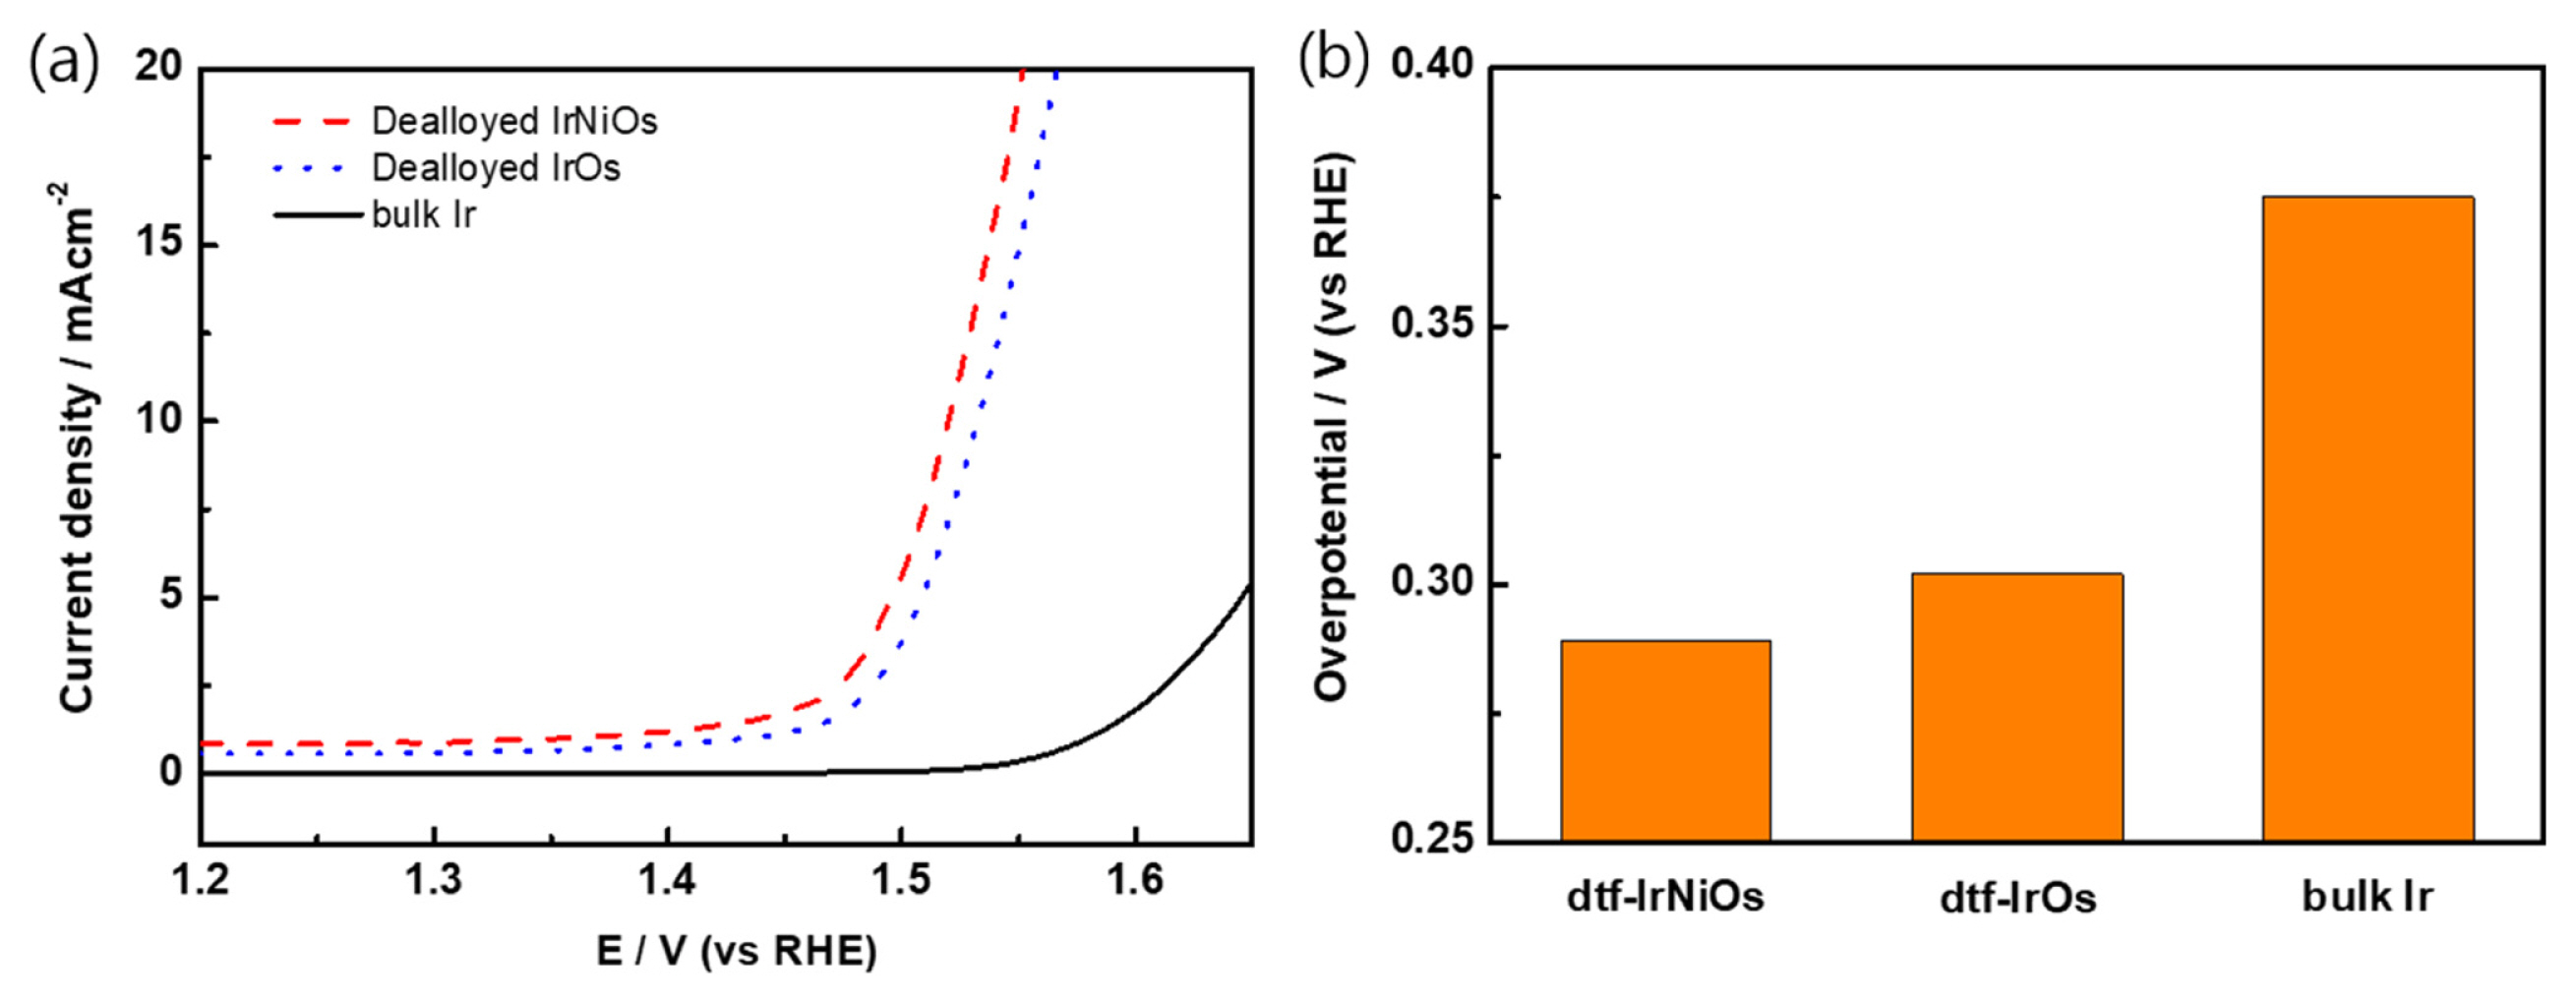
The OER activity of dtf-IrNiOs, dtf-IrOs, and bulk Ir were evaluated using the polarization curves. Fig. 3 shows the polarization curves (Fig. 3a) and the overpotential values were obtained at 10 mA cmŌłÆ2 (Fig. 3b) for dtf-IrNiOs (red-dash), dtf-IrOs (blue-dot) and bulk Ir (black-solid). In this case, the shifted overpotential in the negative direction indicates that the catalytic activity is enhanced in the order: dtf-IrNiOs (0.289 V) < dtf-IrOs (0.302 V) < bulk Ir (0.375 V). It shows that the OER activity of dtf-IrNiOs is better than dtf-IrOs and bulk Ir. To further confirm the effect of surface area, specific activities of dtf-IrNiOs (0.011 mA cmŌłÆ2), dtf-IrOs (0.013 mA cmŌłÆ2), and bulk Ir (0.013 mA cmŌłÆ2) were calculated. Dtf-IrNiOs indicates lower specific activity than others, however, dtf-IrNiOs shows best performance for OER. It is demonstrating that the OER activity is improved because of increased surface area by the introduction of Ni. The magnitude of overpotential was consistent with the trend of ECSA determined from the CVs. It was confirmed that dtf-IrNiOs was formed the optimized nanoporous structure. It is consistent in that the OER reaction rate of the nanoporous thin film catalyst is faster than that of the nanoparticles one [31].
To confirm the oxidized state of dtf-IrOs and dtf-IrNiOs, X-ray photoemission spectroscopy (XPS) has performed. Fig. 4 shows the XPS spectra before and after sputtering of dtf-IrOs (Fig. 4a), dtf-IrNiOs (Fig. 4b), and IrOx (Fig. 4c). The Ir metal peaks (Ir 4f7/2 and Ir 4f5/2) exhibit at 60,9eV and 63.8eV, respectively, which are coincident with the previous report [36]. Before ion-beam sputtering, the binding energy of Ir peaks of dtf-IrOs and dtf-IrNiOs shifted to higher than that of Ir metal, indicating that IrOx was formed at the film surface. After ion-beam sputtering, the surfaces of dtf-IrOs and dtf-IrNiOs were in the Ir metal state, which was observed after approximately 5 nm of the surface removing by sputtering. In case of the IrOx nanoparticles, oxidized states do not change before and after sputtering. The IrOx nanoparticles in the oxidized state disturb the electron transfer due to the oxidized layer, which causes the resistant increase of the electrode, resulting in the lower OER activity. On the other hand, the inside of dtf-IrOs and dtf-IrNiOs is in the metal state, which is not cause decreasing the electron transfer. Due to this reason, dtf-IrOs and dtf-IrNiOs are beneficial as an OER catalyst compared to IrOx. Thus, it demonstrates that the high conductivity of de-alloyed thin film is more effective for OER activity than the IrOx nanoparticles.
4. Conclusions
In conclusion, the performance improved nanoporous IrNi catalyst has been prepared through Os de-alloying of IrNiOs alloy thin film, expecting to be practically useful for a water electrolyzer anode. Nanoporous structured film catalyst was successfully prepared through electrochemical selective dealloying after the formation of tri-metal alloy thin film by introducing Ni into IrOs alloy. We confirmed the variation in the surface oxidation state of iridium resulted from de-alloying progress using XPS (synchrotron x-ray beam). OER performance of dtf-IrNiOs (1:3:3) is more improved than that of dtf-IrOs. This study confirmed that OER activity also improved through the addition of Ni. These results showed the successful preparation of a catalytic activity-improved anode by the enlarged electrochemical active surface area and addition of Ni. We believe that prepared catalysts will contribute to the improvement of the system efficiency of the proton exchange membrane water electrolyzer.